 Open Access Article
Luminescence and energy transfer of warm white-emitting phosphor Mg2Y2Al2Si2O12:Dy3+,Eu3+ for white LEDs
Zizhong Zhua,
Chunjing Taob,
Zhijun Wang b,
Zhiping Yangb and
Panlai Li
 *b
*b
aCollege of Physics Science & Technology, Tangshan Normal University, Tangshan 063000, China
bCollege of Physics Science & Technology, Hebei University, Baoding 071002, China. E-mail: li_panlai@126.com
First published on 5th October 2021
Abstract
A series of Mg2Y2Al2Si2O12:Dy3+,Eu3+ phosphors were synthesized by the solid-state method. The luminescent properties and crystal structures of the Mg2Y2Al2Si2O12:Dy3+,Eu3+ phosphors were analyzed. The XRD results show that the synthesized Mg2Y2Al2Si2O12:Dy3+,Eu3+ phosphors are of pure phase. Mg2Y2Al2Si2O12:Dy3+ can emit blue and yellow light under 367 nm light excitation; when doped with Eu3+, there is an obvious energy transfer from Dy3+ to Eu3+, and warm white light can be realized by adjusting the concentrations of Dy3+ and Eu3+ in Mg2Y2Al2Si2O12. A warm white LED device was fabricated by combining Mg2Y1.88Al2Si2O12:0.05Dy3+,0.07Eu3+ and a UV LED chip (370 nm) under a voltage of 3.2 V and current of 5 mA, the characteristics of the white LED being CIE = (0.4071, 0.3944), CCT = 3500 K and CRI = 91.3.
1. Introduction
The blue light may be inevitably harmful to the human body, and long-term use is not conducive to health. Therefore, a white light-emitting diode (LED) is obtained by exciting single matrix fluorescent powder with ultraviolet (UV) or near-UV light, and UV light will not affect white light.1–5 Dy3+ ions have blue emission peaks (480 nm, 4F9/2 → 6H15/2) and yellow emission peaks (575 nm, 4F9/2 → 6H13/2). White light can be realized by coordinating the ratio of blue light and yellow light.6–11 Sehrawat et al. prepared cold white light-emitting perovskite SrLa2A12O7:Dy3+ nanophosphors.10 Xu et al.11 studied the luminescent properties of Sr4Ca(PO4)2SiO4:Dy3+. When the doping concentration of Dy3+ ion is equal to 0.04, the phosphor emits cold white light, and the luminescent intensity increases by 1.7 times when the charge compensation Li+ ion is added. Zhang et al.12 prepared Ca8ZnY(PO4)7:Dy3+; the photoluminescence of Ca8ZnY(PO4)7:0.12Dy3+ was enhanced by adding Mg2+ and B3+, and the thermal stability was improved after introducing Mg2+. However, generally, a Dy3+ ion single-doped fluorescent material emits cold white light with low index, and hence red light needs to be added to improve the index. Up to now, Eu2+, Mn2+, Eu3+ and Mn4+ have been the most common red emission activators, but the emission spectra of Eu2+ and Mn2+ may extend to the deep red band, making it difficult to maintain high color purity.13–17 Eu3+- and Mn4+-doped red phosphors have attracted extensive attention due to their narrow line emission and good color purity. Mn4+ has two broad excitation bands in the UV (300–400 nm) and blue (400–500 nm) regions. When a white LED is synthesized by Mn4+-activated red fluorescent powder and blue and green fluorescent powder, the excitation band in the blue region causes strong reabsorption and the output of white light will be affected.17,18 Eu3+ can emit orange and red light, which is required by most lighting and display applications.19–22 Leow et al.21 synthesized a series of Eu3+ and Dy3+ co-doped BaB2Si2O8 by the solid-state method, realizing adjustable emission of white light to red light. Hussain et al.22 prepared K3La(VO4)2:Dy3+/Eu3+ by the sol–gel method, and warm white light was observed as a result of an effective energy transfer.The garnet structure has high structural stability and has potential application value for the research and development of the luminescence properties of fluorescent materials.23–26 Pan et al.26 obtained white light by doping Ce3+ in an Mg2Y2Al2Si2O12 matrix and exciting it with a blue LED. Tang combined Lu3Mg2GaSi2O12:0.015Ce and 0.03Sm samples with commercially available red phosphors and blue chips to obtain a warm white LED with a color rendering index of 86.6 and a color temperature of 3592 K.25 Wei integrated a 450 nm LED chip with a Y1.95Ce0.05Mg2Al2Si2O12 phosphor.27 The completed LED device emitted white light, with a CCT value of 4363 K and a CRI value of 83.7. Zhang reported Y2Mg2Al2Si2O12:Ce3+,Mn2+ phosphors for warm-color white LEDs, which are suitable for the current mainstream blue LED chips.28 Therefore, in this work, a Dy3+ and Eu3+ co-doped Mg2Y2Al2Si2O12 (MYAS) phosphor was prepared, and its luminescent properties were studied in detail. By accurately adjusting the doping concentration and proportion of Dy3+ and Eu3+, we have achieved high-quality warm white-light emission from a single substrate.
2. Experimental section
2.1 Materials and synthesis
MYAS:Dy3+/Eu3+ was synthesized by the high-temperature solid-state method. The raw materials were MgO (99.9%), Y2O3 (99.9%), Al2O3 (99.9%), SiO2 (99.9%), Dy2O3 (99.9%) and Eu2O3 (99.9%). The precursors were thoroughly mixed and ground. Then, the mixed materials were transferred to a crucible and placed in a sintering furnace for synthesis reaction at 1500 °C for 3 hours. Finally, the sample was cooled to room temperature and ground completely.2.2 Materials characterization
The crystal structure of the samples was characterized using a D8-A25 focusing diffractometer. A structural analysis system (GSAS) was used to analyze the structure. Photoluminescence and photoluminescence excitation spectra were measured with a Hitachi F4600. The decay curve was obtained using a HORIBA FL-1057 device with a xenon lamp as excitation source. Color coordinates were measured with a PMS-80 color analyzer obtained commercially at room temperature.3. Results and discussion
3.1 XRD patterns of Mg2Y2Al2Si2O12:xDy3+,yEu3+
Fig. 1(a) and (b) show the XRD results of MYAS:xDy3+ and MYAS:Dy3+,yEu3+. The diffraction peaks of all samples are consistent with the structure of the standard card Y3Al5O12 (ICSD#20090) and there are no other miscellaneous peaks,25 which indicate that the synthesized MYAS:xDy3+ and MYAS:xDy3+,yEu3+ have garnet structure. Also, the diffraction peaks have no obvious shift, which indicates that the lattice distortion caused by Dy3+ replacing Y3+ is very small, and therefore it is proved that all the synthesized samples are in a single crystal phase.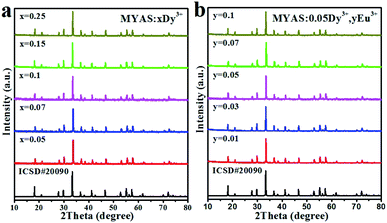 | ||
| Fig. 1 XRD patterns of Y3Al5O12 (ICSD#20090) standard card and (a) MYAS:xDy3+ and (b) MYAS:Dy3+,yEu3+. | ||
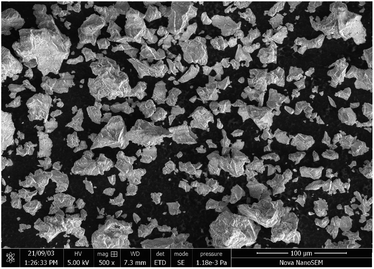
Fig. 2 shows an SEM image of MYAS:0.05Dy3+,Eu3+. It can be seen that the phosphor is composed of irregular particles with a particle size of 5–20 μm.
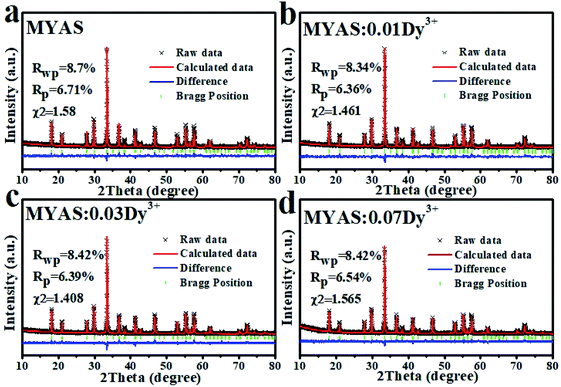
Analysis was conducted in order to further understand the influence of Dy3+ on the lattice parameters of MYAS after entering the lattice of the matrix. According to the standard card ICSD#20090, MYAS:xDy3+ (x = 0, 0.01, 0.03, 0.07, 0.1, 0.15) is refined with GASA software, and the final result is shown in Fig. 3. From Fig. 3(a)–(d), it can be seen that the experimental data (red line) and the calculated data (black line) are very consistent. It can be seen that the χ2, Rp and Rwp obtained by refinement are all within the experimental range (χ2 < 10%, Rp and Rwp < 15%), proving that Dy3+ has successfully entered the matrix and is a pure phase. In the doping process, the radius difference between doped ions and substituted ions should be within 30%, as shown in eqn (1):29–31
 | (1) |
The radius difference calculated by eqn (1) is shown in Table 1. From the results, it can be seen that the differences in ionic radii of the eight-coordinated Mg1, Y and the six-coordinated Mg2 are all less than 30%, so Dy3+ may replace the eight-coordinated Mg1 and the six-coordinated Mg2.
| Rm | Rd | Dr |
|---|---|---|
| Mg1 (0.89 Å, N = 8) | Dy (1.027 Å, N = 8) | 14.3% |
| Y1 (1.019 Å, N = 8) | Dy (1.027 Å, N = 8) | 0.8% |
| Mg2 (0.72 Å, N = 6) | Dy (0.912 Å, N = 6) | 21.1% |
| Al1 (0.535 Å, N = 6) | Dy (0.912 Å, N = 8) | 41.3% |
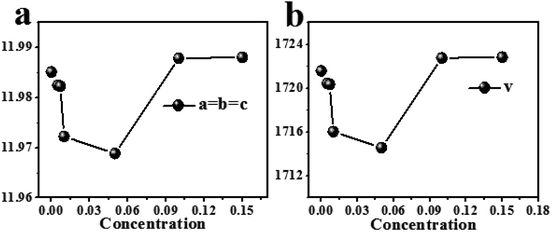
Because the radius (r = 1.03, CN = 8) of Dy3+ is larger than the radius30 of Y3+ (r = 1.02, CN = 8), when Y3+is replaced by Dy3+, the cell parameter and cell volume will both become larger, but it can be seen from Fig. 4(a) and (b) that the cell parameter and cell volume first decrease and then increase with increasing Dy3+ concentration. This is because Mg2+ and Y3+ occupy the same lattice position in the MYAS crystal; hence the decrease in cell parameter and cell volume of MYAS:xDy3+ is caused by the partial substitution of Dy3+ for Mg2+(r = 0.89, CN = 8) in the same lattice position.
In order to further determine the cell parameters and the reasons for the reduction of cell volume, Fig. 5 shows the refined results. The cell parameters and cell volume decrease with an increase of Dy3+ doping concentration. When Dy3+ is used to replace Mg2+ ions in the same lattice position, the charge is unbalanced, thus generating cation vacancies, as shown in eqn (2), and the generation of cation vacancies is helpful to the contraction of the unit cell:29
| 2Dy3+ = 2Mg2+ + VMg2+ | (2) |
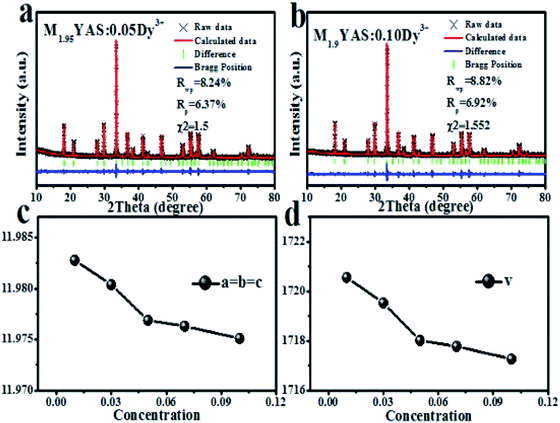 | ||
| Fig. 5 Refinement results of M2−xYAS:xDy3+: (a) x = 0.05, (b) x = 0.1. (c) Cell parameters and (d) cell volume of M2−xYAS:xDy3+. | ||
3.2 Luminescence characteristics of Mg2Y2Al2Si2O12:xDy3+
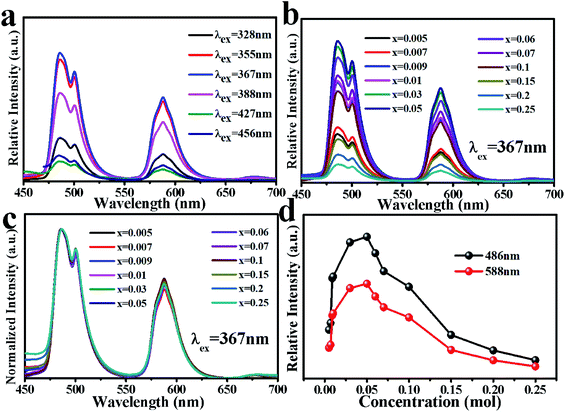
Fig. 6(a) shows the excitation spectrum and emission spectrum of MYAS:0.05Dy3+. For 588 nm emission, the excitation can range from 250 to 500 nm, and the maximum peak is at 367 nm, which mainly comes from the 6H15/2 → 6P5/2 transition of Dy3+,31–34 and the excitation spectrum of Dy3+ covers almost all areas from UV light to blue light. In the emission spectrum, due to the transition of 4F9/2 → 6HJ/2 (J = 11, 13, 15) of Dy3+, three emission peaks at about 486, 588 and 677 nm were obtained respectively, and the two main emission peaks were located in the blue (486 nm) and yellow (588 nm) regions.21 In general, the luminous intensity of 4F9/2 → 6H15/2 of Dy3+ is higher than that of 4F9/2 → 6H13/2, indicating that Dy3+ occupies an inverted symmetry center lattice position in the matrix.22 The intensity of the 486 nm emission is higher than that of 588 nm, as shown in Fig. 6(a), which indicates that Dy3+ occupies the lattice position of the inversion symmetry center in the MYAS matrix. The energy level diagram of Dy3+ is shown in Fig. 6(b).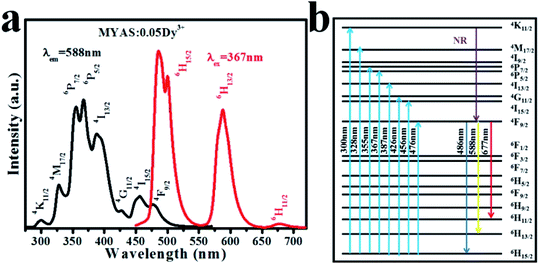 | ||
| Fig. 6 (a) Excitation spectrum and emission spectrum of MYAS:xDy3+ and (b) Dy3+ energy level diagram. | ||
Fig. 7 shows the luminescence intensity of Dy3+ with various doping concentrations of Dy3+ under 367 nm excitation (x = 0.005, 0.007, 0.009, 0.01, 0.03, 0.05, 0.06, 0.07, 0.1, 0.15, 0.2, 0.25). The emission intensity of Dy3+ increases continuously at 486 nm and 588 nm. When x = 0.05, the intensity reaches the maximum, and then as the concentration of Dy3+ continues to increase, the intensity decreases at 486 nm and 588 nm.
In order to study the influence of Dy3+ doping concentration on the luminescent color of MYAS:xDy3+, the relative intensity ratio of yellow (588 nm) and blue (486 nm) regions under 367 nm UV excitation was determined. As shown in Table 2, it can be seen that with the increase of Dy3+ doping concentration, the Y/B ratio increases first.
| Concentration | Y/B | Concentration | Y/B |
|---|---|---|---|
| 0.005 | 0.61 | 0.06 | 0.66 |
| 0.007 | 0.63 | 0.07 | 0.66 |
| 0.009 | 0.63 | 0.10 | 0.66 |
| 0.01 | 0.64 | 0.15 | 0.65 |
| 0.03 | 0.66 | 0.20 | 0.65 |
| 0.05 | 0.67 | 0.25 | 0.65 |
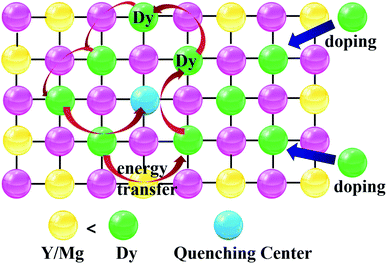
The reason why the emission intensity of Dy3+ increases first and then decreases is that concentration quenching occurs between Dy3+, which involves the energy transfer of activator ions at high concentration.35–38 Fig. 8 explains the concentration quenching of Dy3+. As the doping concentration of Dy3+ ions increases, the distance between ions decreases continuously, and the exchange interaction between Dy3+ ions is strengthened. When the center distance between Dy3+ ions is less than the critical distance, the tunneling effect is easy to occur, resulting in cascade energy transfer, resulting in luminescence quenching.38,39
In order to further explore the concentration quenching mechanism of Dy3+, one can consider the Blasse formula:38–40
| Rc = 2[3V/4πXcN]1/3 | (3) |
For the MYAS matrix, the value of V is 1721.583, N = z = 6, Xc = 5%, and calculated Rc = 22.21, which is far greater than 5. Therefore, the concentration quenching mechanism of Dy3+ involves a multipolar interaction.
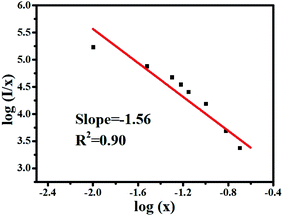
According to the theories of Dexter and Van Uitert, the luminous intensity I of Dy3+ ions follows the following formula:37–40
 | (4) |
As shown in Fig. 9, θ is 4.68, which is close to 6, indicating that the concentration quenching mechanism of Dy3+ in the MYAS matrix involves dipole–dipole interaction.
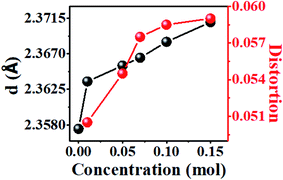
The increase of Y/B ratio is due to the change of dodecahedron symmetry. The yellow emission of Dy3+ results from supersensitive transition and is related to local symmetry. With an increase of Dy3+ doping concentration, the average bond length of dodecahedron Y/Mg(1)O8 gradually becomes longer because the radius of Dy3+ is larger than that of Y3+ (r = 1.02) (Fig. 10). The bond length between the luminescent center and the surrounding ligand changes, and the twist degree of the polyhedron in which it is located also changes. The twist degree of the crystal can be calculated by formula (5):38,39
 | (5) |
Fig. 10 shows the twist degree of crystal Y/Mg(1)O8. As the doping concentration of Dy3+ increases, the twist degree of the crystal gradually increases, causing the yellow light in the emission spectrum of Dy3+ to increase, resulting in an increase in the Y/B ratio.
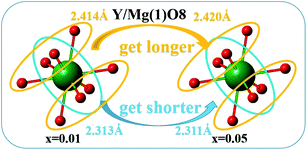
Fig. 11 depicts the reason why the symmetry of dodecahedron Y/Mg(1)O8 decreases. By comparing the bond lengths of dodecahedron Y/Mg(1)O8, it is found that the shorter bond lengths are getting shorter and the longer bond lengths are getting longer, which leads to the reduction of symmetry of dodecahedron Y/Mg(1)O8. The symmetry of dodecahedron Y/Mg(1)O8 decreases, indicating that the proportion of yellow light is gradually increasing (Table 2).
3.3 Luminescence properties of Mg2Y1.95Al2Si2O12:0.05Dy3+,yEu3+
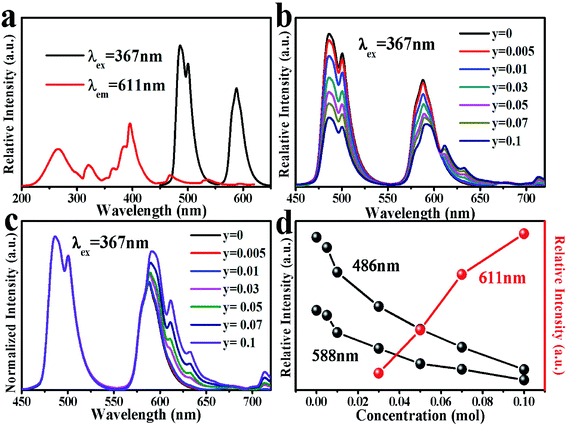
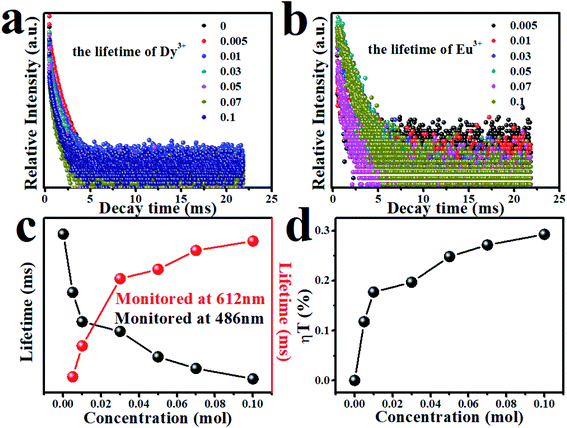
Fig. 12(a) shows the emission spectrum of MYAS:0.05Dy3+ and the excitation spectrum of MYAS:0.05Dy3+,0.05Eu3+. It can be seen that the emission spectrum of Dy3+ and the excitation spectrum of Eu3+ obviously overlap, which indicates that there may be energy transfer from Dy3+ to Eu3+. Fig. 12(b) shows the emission spectrum of MYAS:0.05Dy3+,yEu3+ (y = 0–0.1) excited at 367 nm. The emission spectrum includes not only blue and yellow emission of Dy3+ (4F9/2 → 6H15/2 and 4F9/2 → 6H13/2), but also characteristic emission of Eu3+ (5D0 → 7FJ (J = 2, 3, 4)). The emission peaks at 611 nm, 633 nm and 714 nm correspond to the 5D0 → 7F2, 5D0 → 7F3 and 5D0 → 7F4 electron transitions of Eu3+, respectively.22,24 From the normalized emission spectrum, it can be clearly seen that the proportion of yellow light is increasing significantly (Fig. 12(c)). As the concentration of doped Eu3+ ions increases, the emission intensity at 486 nm and 588 nm (Dy3+) decreases, and the emission intensity of Eu3+ (611 nm) increases (Fig. 12(d)). The emission intensity of Dy3+ decreases continuously, and the reason why the emission intensity of Eu3+ increases continuously may be that Dy3+ transfers more and more energy to Eu3+, which proves that energy transfer from Dy3+ to Eu3+ does occur.That there is energy transfer between Dy3+ ions and Eu3+ ions can be verified by Fig. 13(a) and (b).
Dy3+ and Eu3+ lifetimes τ can be calculated by formula (6):24,25,28
 | (6) |
The lifetimes of Dy3+ and Eu3+ calculated by formula (6) are shown in Fig. 13(c) in the form of a line chart. With an increasing doping concentration of Eu3+, the lifetimes of Dy3+ become shorter and shorter (1.84, 1.62, 1.51, 1.47, 1.38, 1.34, 1.30 ms), which verifies that there is indeed energy transfer between Dy3+ and Eu3+ ions.
The energy transfer efficiency between Dy3+ and Eu3+ can be calculated by formula (7):39
| ηT = 1 − τs/τs0 | (7) |
Fig. 13(d) shows the energy transfer efficiency between Dy3+ and Eu3+. The energy transfer efficiency between Dy3+ and Eu3+gradually increases with an increase of Dy3+ ion concentration in the MYAS matrix. When y = 0.10, the energy transfer efficiency can reach 30%.
In order to determine the type of interaction between Dy3+ and Eu3+, the critical distance between Dy3+ and Eu3+ can be obtained from eqn (3). The calculated value of the critical distance Rc between Dy3+ and Eu3+ is greater than 5, so the energy transfer mechanism between Dy3+ and Eu3+ involves a multilevel interaction.
To further determine the energy transfer mechanism between Dy3+ and Eu3+, the following formula can be used for calculation:40
| ηs0/η = Cα/3 | (8) |
Since quantum efficiency is difficult to obtain, formula (9) can be used instead:39,40
| (Is0/I) = Cα/3 | (9) |
As can be seen from Fig. 14(a)–(c), for MYAS:0.05Dy3+,yEu3+, when α = 6, a best fitting line can be obtained, and R2 for this case is 0.96717. Therefore, the energy transfer mechanism of Dy3+ → Eu3+ involves dipole–dipole interaction.
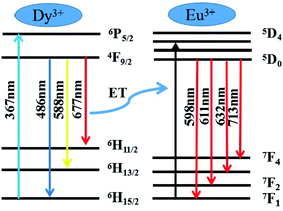
In order to further understand the mechanism of energy transfer between Dy3+ and Eu3+, Fig. 15 shows the mechanism diagram of energy transfer. For MYAS:Dy3+,Eu3+, there is overlap between the emission spectrum of Dy3+ and the excitation spectrum of Eu3+. Part of the emission of Dy3+ will be reabsorbed by Eu3+, resulting in 5D0 → 7FJ (J = 1, 2, 3, 4) electron transition of Eu3+.
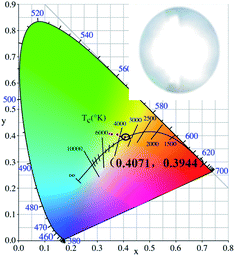
Fig. 16 shows the color coordinates of MYAS:0.05Dy3+,yEu3+(y = 0–0.1) and the warm white LEDs. The specific values are shown in Table 3. With an increase of Eu3+ concentration, the color coordinates of MYAS:0.05Dy3+,yEu3+ (y = 0–0.1) gradually transition from yellow to white and then to red. MYAS:0.05Dy3+,yEu3+ emitted white light with color coordinates of (0.4071, 0.3944) and color temperature of 3500 K. The warm white LED device was fabricated by combining the MYAS:0.05Dy3+,0.07Eu3+ and a UV LED chip (370 nm) under a voltage of 3.2 V and current of 5 mA, and the CIE, CCT and CRI are (0.4071, 0.3944), 3500 K and 91.3, respectively.
| Concentration | MYAS:xDy3+ | Concentration | MYAS:0.05Dy3+,yEu3+ |
|---|---|---|---|
| 0.005 | (0.3231, 0.3785) | 0 | (0.3485, 0.4068) |
| 0.01 | (0.3265, 0.3871) | 0.005 | (0.3530, 0.4053) |
| 0.03 | (0.3311, 0.3882) | 0.01 | (0.3562, 0.4047) |
| 0.05 | (0.3378, 0.3967) | 0.03 | (0.3777, 0.4037) |
| 0.7 | (0.3392, 0.3965) | 0.05 | (0.3882, 0.3971) |
| 0.10 | (0.3374, 0.3959) | 0.07 | (0.4071, 0.3944) |
| 0.15 | (0.3359, 0.3936) | 0.10 | (0.4258, 0.3890) |
4. Conclusions
A series of MYAS:xDy3+,yEu3+ phosphors were prepared by a high-temperature solid-state method. The fluorescent material of MYAS:xDy3+ can absorb UV light in the range of 250 nm to 400 nm. Under excitation of 367 nm UV light, MYAS:xDy3+ shows yellow emission, the optimal doping concentration is 0.05, and its concentration quenching mechanism involves dipole–dipole interaction. Through energy transfer, the luminous color of MYAS:xDy3+,yEu3+ can gradually change into warm white light with CIE chromaticity coordinates of (0.4071, 0.3944) and relative color temperature of 3500 K. A warm white LED device was fabricated by combining MYAS:0.05Dy3+,0.07Eu3+ and a UV LED chip (370 nm), and the CIE, CCT and CRI are (0.4071, 0.3944), 3500 K and 91.3, respectively. Therefore, the MYAS:xDy3+,yEu3+ phosphors have potential application prospects in white LEDs.Conflicts of interest
There are no conflicts to declare.Acknowledgements
The work is supported by the Tangshan science and technology planning project (no. 19130201) and the National Natural Science Foundation of China (no. 51672066) and Foundation of Tangshan Normal University (2020A09).References
- S. Dutta, S. Som and M. M. Lal, et al. Multisite-Occupancy-Driven Intense Narrow-Band Blue Emission from Sr5SiO4Cl6:Eu2+ Phosphor with Excellent Stability and Color Pe, Inorg. Chem., 2020, 59(3), 1928–1939 CrossRef CAS PubMed.
- J. Meyer and F. Tappe, Solid-State Lighting: Photoluminescent Materials for Solid-State Lighting: State of the Art and Future Challenges, Adv. Opt. Mater., 2015, 3(4), 423 CrossRef.
- C. H. Huang, T. M. Chen and W. R. Liu, et al. A single-phased emission-tunable phosphor Ca9Y(PO4)7:Eu2+, Mn2+ with efficient energy transfer for white-light-emitting diodes, ACS Appl. Mater. Interfaces, 2010, 2(1), 259–264 CrossRef CAS.
- X. Y. Meng, K. L. Qiu and Z. Tian, et al. Tunable-emission single-phase phosphors Ba3Ca2(PO4)3F:M (M = Ce3+, Eu2+, Mn2+): Crystal structure, luminescence and energy transfer, J. Alloys Compd., 2017, 719, 322–330 CrossRef CAS.
- Q. Liu, J. Guo and M. H. Fan, et al. Fast synthesis of Dy3+ and Tm3+ co-doped double perovskite NaLaMgWO6: a thermally stable single-phase white-emitting phosphor for WLEDs, J. Mater. Chem. C, 2020, 8, 2117–2122 RSC.
- S. Petoud, S. M. Cohen and J. C. G. Bünzli, et al. Stable Lanthanide Luminescence Agents Highly Emissive in Aqueous Solution: Multidentate 2-Hydroxyisophthalamide Complexes of Sm3+, Eu3+, Tb3+, Dy3+, J. Am. Chem. Soc., 2003, 125, 13324–13325 CrossRef CAS PubMed.
- S. V. Eliseeva and C. G. Bünzli Jean, Lanthanide luminescence for functional materials and bio-sciences, Chem. Soc. Rev., 2009, 39(1), 189–227 RSC.
- P. Han, P. J. Li and J. T. Zhang, et al. The effect of Li+ ions on the luminescent properties of a single-phase white light-emitting phosphor α-Sr2P2O7:Dy3+, Dalton Trans., 2015, 44, 7854–7861 RSC.
- G. Tiwari, N. Brahme and R. Sharma, et al. A study on the luminescence properties of gamma-ray-irradiated white light emitting Ca2Al2SiO7:Dy3+ phosphors fabricated using a combustion-assisted method, RSC Adv., 2016, 6, 49317–49327 RSC.
- P. Sehrawata, A. Khatkarb and S. Devia, et al. An effective emission of characteristic cool white light from Dy3+ doped perovskite type SrLa2Al2O7 nanophosphors in single-phase pc WLEDs, Chem. Phys. Lett., 2019, 737, 136842–136871 CrossRef.
- D. D. Xu, W. Zhou, Z. Zhang and S. J. Li, et al. Improved photoluminescence by charge compensation in Dy3+ doped Sr4Ca(PO4)2SiO4 phosphor, Opt. Mater., 2019, 89, 197–202 CrossRef CAS.
- Y. L. Zhang, M. H. Li and Z. H. Kong, et al. Plant habitat-conscious phosphors: Tuneable luminescence properties of Dy3+-doped Ca8ZnY(PO4)7 phosphors by co-dopants Mg2+ and B3+, Ceram. Int., 2020, 46, 11717–11725 CrossRef CAS.
- S. Som, P. Mitra and V. Kumar, et al. The energy transfer phenomena and colour tunability in Y2O2S:Eu3+/Dy3+ micro-fibers for white emission in solid state lighting applications, Dalton Trans., 2014, 43, 9860–9871 RSC.
- C. H. Wang, Z. H. J. Wang and P. L. Li, et al. Relationships between luminescence properties and polyhedron distortion in Ca9−x−y−zMgxSryBazCe(PO4)7:Eu2+, Mn2+, J. Mater. Chem. C, 2017, 5, 10839–10846 RSC.
- M. Xia, X. B. Wu and Y. Zhong, et al. Photoluminescence properties and energy transfer in a novel Sr8ZnY(PO4)7:Tb3+, Eu3+ phosphor with high thermal stability and its great potential for application in warm white light emitting diodes, J. Mater. Chem. C, 2019, 7, 2927–2935 RSC.
- C. H. Huang, W. R. Liu and T. M. Chen, Single-Phased White-Light Phosphors Ca9Gd(PO4)7:Eu2+, Mn2+ under Near-Ultraviolet Excitation, J. Phys. Chem. C, 2010, 114(43), 18698–18701 CrossRef CAS.
- D. Q. Chen, S. Liu and Y. Zhou, et al. Dual-activator luminescence of RE/TM:Y3Al5O12 (RE = Eu3+, Tb3+, Dy3+; TM = Mn4+, Cr3+) phosphors for self-referencing optical thermometry, J. Mater. Chem. C, 2016, 4, 9044–9051 RSC.
- D. Huang, H. M. Zhu and Z. H. Deng, et al. Moisture-Resistant Mn4+-Doped Core–Shell-Structured Fluoride Red Phosphor Exhibiting High Luminous Efficacy for Warm White Light-Emitting Diodes, Angew. Chem., Int. Ed., 2019, 58, 3843–3847 CrossRef CAS PubMed.
- L. Li, W. Zi and G. Li, et al. Hydrothermal synthesis and luminescent properties of NaLa(MoO4)2:Eu3+, Tb3+ phosphors., Cheminform, 2013, 550, 1–8 Search PubMed.
- Y. Liu, G. X. Liu and J. X. Wang, et al. Single-Component and Warm-White-Emitting Phosphor NaGd(WO4)2:Tm3+, Dy3+, Eu3+: Synthesis, Luminescence, Energy Transfer, and Tunable Color, Inorg. Chem., 2014, 53, 11457–11466 CrossRef CAS PubMed.
- T. Q. Leow, H. Liu and R. Hussin, et al. Effects of Eu3+ and Dy3+ doping or co-doping on optical and structural properties of BaB2Si2O8 phosphor for white LED applications, J. Rare Earths, 2016, 34, 21–29 CrossRef CAS.
- S. k. K. Hussain, H. S. Go and J. J. Han, et al. Energy transfer mechanism and tunable emissions from K3La(VO4)2:Dy3+/Eu3+ phosphors and soft-PDMS-based composite films for multifunctional applications, J. Alloys Compd., 2019, 805, 1271–1281 CrossRef CAS.
- X. Min, X. W. Wu and Y. G. Liu, et al. Energy Transfer from Sm3+ to Eu3+ in Red-Emitting Phosphor LaMgAl11O19:Sm3+, Eu3+ for Solar Cells and Near-Ultraviolet White Light-Emitting Diodes, Inorg. Chem., 2014, 53, 6060–6065 CrossRef CAS PubMed.
- X. Min, J. Xiao, M. H. Fang and Z. Huang, et al. Potassium-ion batteries: outlook on the present and future technologies, Energy Environ. Sci., 2021, 14, 2186–2243 RSC.
- H. Tang, X. Y. Zhang, L. Cheng and J. Xie, et al. Broadband emission of Lu3Mg2GaSi2O12:Ce3+, Sm3+ phosphors and their potential application for w-LEDs, Ceram. Int., 2021, 35, 1–11 Search PubMed.
- Z. F. Pan, Y. Xu and Q. S. Hu, et al. Combination cation substitution tuning of yellow-orange emitting phosphor Mg2Y2Al2Si2O12:Ce3+, RSC Adv., 2015, 5, 9489–9496 RSC.
- Z. Wei, Y. Ji and M. Zhu, et al. Luminescence properties of garnet Y2Mg2Al2Si2O12:Ce3+ phosphors, Chem. Phys. Lett., 2021, 771, 138516–138522 CrossRef CAS.
- X. Zhang, D. Zhang and D. Kan, et al. Crystal structure, luminescence properties and application performance of color tuning Y2Mg2Al2Si2O12:Ce3+, Mn2+ phosphors for warm white light-emitting diodes, Mater. Adv., 2020, 1, 2261–2270 RSC.
- M. Yu, J. Lin and Z. Wang, et al. Fabrication, Patterning, and Optical Properties of Nanocrystalline YVO4:A (A = Eu3+, Dy3+, Sm3+, Er3+) Phosphor Films via Sol–Gel Soft Lithography, Chem. Mater., 2002, 14(5), 2224–2231 CrossRef CAS.
- A. Kumar and J. Manam, Color tunable emission and temperature dependent photoluminescence properties of Eu3+ co-doped Gd2Zr2O7:Dy3+ phosphors, Opt. Mater., 2019, 96, 109373–109383 CrossRef CAS.
- G. Annadural, S. M. M. KenneDy and V. Sivakumar, Synthesis of novel Dy3+ activated Ba2CaZn2Si6O17 phosphors for white light-emitting diodes, Luminescence, 2018, 33, 521–527 CrossRef PubMed.
- T. Nakajima and T. Tsuchiya, Plant Habitat-Conscious White Light Emission of Dy3+ in Whitlockite-like Phosphates: Reduced Photosynthesis and Inhibition of Bloom Impediment, ACS Appl. Mater. Interfaces, 2015, 7, 21398–21407 CrossRef CAS PubMed.
- G. M. Rao, G. S. R. Raju and S. k. K. Hussain, et al. Tunable emissions via the white region from Sr2Gd8(SiO4)6O2:RE3+ (RE3+:Dy3+, Tm3+, Eu3+) phosphors, New J. Chem., 2016, 40, 6214–6227 RSC.
- M. Hermus, P. C. Phan and A. C. Duke, et al. Tunable optical properties and increased thermal quenching in the blue-emitting phosphor series: Ba2(Y1−xLux)5B5O17:Ce3+ (x = 0–1), Chem. Mater., 2017, 29, 5267–5275 CrossRef CAS.
- Y. N. Zhou, W. D. Zhuang and Y. S. Hu, et al. Second-Sphere Polyhedron-Distortion-Induced Broadened and Red-Shifted Emission in Lu3(MgxAl2−x)(Al3−xSix)O12:Ce3+ for Warm WLED, Inorg. Chem., 2019, 58, 9108–9117 CrossRef CAS PubMed.
- Y. C. H. Lin, P. Erhart and M. Bettinelli, et al. Understanding the Interactions between Vibrational Modes and Excited State Relaxation in Y3−xCexAl5O12: Design Principles for Phosphors Based on 5d–4f Transitions, Chem. Mater., 2018, 30, 1865–1877 CrossRef CAS.
- S. H. X. Li, L. Wang and Q. Q. Zhu, et al. Crystal structure, tunable emission and applications of Ca1−xAl1−xSi1+xN3−xOx:RE (x = 0–0.22, RE = Ce3+, Eu2+) solid solution phosphors for white light-emitting diodes, J. Mater. Chem. C, 2016, 4, 11219–11230 RSC.
- X. Li, P. L. Li and Z. J. Wang, et al. Color-Tunable Luminescence Properties of Bi3+ in Ca5(BO3)3F via Changing Site Occupation and Energy Transfer, Chem. Mater., 2017, 29, 8792–8803 CrossRef CAS.
- C. H. Wang, Z. H. J. Wang and P. L. Li, et al. Relationships between luminescence properties and polyhedron distortion in Ca9−x−y−zMgxSryBazCe(PO4)7:Eu2+, Mn2+, J. Mater. Chem. C, 2017, 5, 10839–10846 RSC.
- M. M. Tian, P. L. Li and Z. J. Wang, et al. Synthesis, color-tunable emission, thermal stability, luminescence and energy transfer of Sm3+ and Eu3+ single-doped M3Tb(BO3)3 (M = Sr and Ba) phosphors, CrystEngComm, 2016, 18, 6934–6947 RSC.
| This journal is © The Royal Society of Chemistry 2021 |

