 Open Access Article
Effects of mixing temperature on the extrusion rheological behaviors of rubber-based compounds
Zhongjin Duab,
Yu Duab,
Yankun Gonga,
Guizhi Liua,
Zhuo Li *a,
Guangshui Yua and
Shugao Zhaoa
aKey Laboratory of Rubber-Plastics, Ministry of Education, Shandong Provincial Key Laboratory of Rubber-Plastics, Qingdao University of Science & Technology, Qingdao 266042, China. E-mail: lizhuoqust@126.com
bInstitute of Polymer Materials and Plastics Engineering, TU Clausthal, Agricolastr. 6, Clausthal-Zellerfeld 38678, Germany
First published on 4th November 2021
Abstract
In this study, rim strip (R) and sidewall (S) compounds were prepared at varying initial mixing temperatures. The effects of the mixing temperature on the extrusion rheological behaviors of the compounds were investigated, and the relationships between the compound structure and the extrusion rheological behaviors were studied. The results showed that the tensile stress relaxation rates of both R and S were more sensitive to the mixing temperature than the shear stress relaxation rate, and the former was affected by both the dispersion of carbon black (CB) and the actual molecular weight of the rubbers. Strain sweep results showed that R, which had a higher CB content, had a more obvious Payne effect than S. When the initial mixing temperature increased from 80 °C to 90 °C, both storage modulus (G′) at a low shear strain and the ΔG′ of R obviously decreased, indicating CB dispersion improvement. The S extrudates showed higher die swell ratios (B) than the R extrudates, and the former was more sensitive to mixing temperature. The main factors influencing the B of the R and S were the CB dispersity and the molecular weight, respectively. In addition, at high extrusion rates, a sharkskin phenomenon could be observed for the R extrudate surfaces, whereas the S extrudates were more likely to be integrally distorted.
1 Introduction
Extrusion is a common approach in polymer processing.1–3 In particular, a variety of rubber products, such as tire treads/sidewalls,4–6 seal strips,7,8 wires9 and hoses10,11 are obtained by the extrusion process. Rubber is a type of viscoelastic material, which means it exhibits both viscous and elastic characteristics when undergoing deformation. These two characteristics affect industrial extruding production in different ways. Specifically, viscous flow is associated with the production rate, whereas the elastic property of rubber influences the appearance and dimensional stability of the extrudates,12 which further determines the quality and cost of the final products.13 Some familiar phenomena, for example, die swell and distortion of the extrudate, are considered to be caused by elastic memory.12,14,15 In recent decades, the rheological behaviors of this viscoelastic rubber material have attracted increasing attention from academia.16–18 It is worth noting that the rubber compounds were mostly prepared from rubber composites with a complex formula, and thus their rheological behaviors were influenced by multiple factors. In addition to the rubber structure,19–22 the characteristics, content and introduction method of the ingredients (curing system, fillers, plasticizers, etc.),23–28 as integral parts of rubber composites, play a significant role in determining the rheological behaviors of the composites. For example, Patcharaphun et al.23 concluded that the viscosity of rubber compounds utilizing conventional and efficient vulcanizing systems was lower than that of compounds with nonsulfur systems at any given shearing rate. Furthermore, the mixing process parameters should be carefully controlled since the improper process may lead to issues such as filler aggregation or scorching and thus worsen the rheological properties and aggravate the appearance defects of the extrudates. Studies conducted by Li29 demonstrated that mixing time could affect the die swell ratio (B) of the compounds by influencing the dispersity of carbon black (CB).In addition, it is widely accepted that the extruding process is another decisive factor for extrudates. For industrial manufacture, a screw extruder is applied for extrusion; the screw length-to-diameter ratio (L/D) and configuration,30,31 the barrel temperature,32 the screw rotating speed,33 the feed rate34 and the die shape35 are set according to the material characteristics and the requirements for both the quality and efficiency of the output. In laboratory studies, a capillary rheometer is normally used for rheological behavior investigations.36–39
Coextrusion is a process that simultaneously extrudes two or more materials together through one common die system to create a multilayered extrudate.14,40 It is widely applied in actual tire manufacturing. Defects of the coextrudates are more prone to occur if the rheological properties of the component parts, such as the rim strip and sidewall compounds, are significantly different. It is essential to understand the rheological performance of each part in the coextrusion to optimize the mixing and extrusion process. In this study, two rubber composites with different formulas (with the characteristics of rim strip and sidewall components) were prepared at various initial mixing temperatures in the internal mixer. Their rheological performances were systematically investigated; the effects and their mechanisms of the mixing temperature were discussed.
2 Experimental
2.1 Materials
Natural rubber (NR, TSR 9710, number-average molecular weight (Mn) = 2.4 × 10⁵, weight-average molecular weight (Mw) = 6.5 × 10⁵) was supplied by Hainan Sinochem Rubber Co., Ltd., Hainan, China. Butadiene rubber (BR, BR9000, Mn = 1.0 × 10⁵, Mw = 3.5 × 10⁵) was provided by Chuanhua Synthetic Material Co., Ltd., Zhejiang, China. Emulsion polymerized styrene-butadiene rubber (ESBR, 1502, Mn = 9.8 × 10⁴, Mw = 3.1 × 10⁵) was offered by TSRC Co., Ltd., China. CB (N339) was supplied by Kabote (China) Investment Co., Ltd. Zinc oxide (ZnO) was purchased from US Zinc (Changshu) Co., Ltd., China. Stearic acid (SA) was obtained from Rugao Shuangma Chemical Co., Ltd., China. Aromatic hydrocarbon oil (VIVATEC 500) was provided by H & R China (Daxie) Co., Ltd. N-(1,3-Dimethylbutyl)-N′-phenyl-p-phenylenediamine (6-PPD), N-tert-butylbenzothiazole-2-sulphenamide (NS) and insoluble sulfur were obtained from Sunsine Chemical Co., Ltd., Shandong, China.2.2 Preparation of the compounds
The two compounds investigated in this study were denoted as R and S, and their formulas are shown in Table 1. For the study of extrusion rheological behaviors of the compounds, the curing system was removed from the formula to ensure that the capillary would not be blocked by the cured rubber during the extrusion process at 100 °C. The compounds were prepared using an internal mixer (XSM-500, Shanghai Kechuang, China). The specifics are as follows. The rubbers and the ingredients were added in the first stage of internal mixing. The blends obtained were stored at room temperature for 4 h and then internally mixed again, and rubber compounds were obtained. The initial temperature and the mixing time for each sample are listed in Table 2. Furthermore, for the evaluation of the tensile properties of the composites, the compounds obtained were cured at 160 °C at a pressure of 10 MPa.| Component | Content/phr | |
|---|---|---|
| S | R | |
| a For the study of extrusion rheological behaviors of the compounds, the curing system, including the NS and the insoluble sulfur, was removed from the formula to ensure that the capillary would not be blocked by the cured rubber during the extrusion process at 100 °C. | ||
| NR | 25 | 30 |
| BR | 50 | 70 |
| ESBR | 25 | — |
| 6-PPD | 2 | 2 |
| SA | 2 | 2 |
| ZnO | 3 | 3 |
| CB (N339) | 30 | 70 |
| Aromatic oil | 10 | 5 |
| NSa | 1.5 | 2.5 |
| Insoluble sulfura | 1.5 | 2.5 |
| The first stage mixing process | The second stage mixing process | |||
|---|---|---|---|---|
| Initial temperature/°C | Mixing time/min | Initial temperature/°C | Mixing time/min | |
| R-80 | 80 | 5.5 | 80 | 3.5 |
| R-90 | 90 | 5.5 | 90 | 3.5 |
| R-100 | 100 | 5.5 | 100 | 3.5 |
| S-80 | 80 | 5.0 | 80 | 3.5 |
| S-90 | 90 | 5.0 | 90 | 3.5 |
| S-100 | 100 | 5.0 | 100 | 3.5 |
2.3 Measurements
The Mn and Mw of the rubbers were tested using a gel permeation chromatography (HLC 8320, Tosoh, Japan). The CB dispersity in the compounds was evaluated by a dispersion tester (disperGRADER αview, Alpha Technologies, USA). The bound rubber content (BRC) of the compounds was measured by toluene extraction as follows. The rubber compound was cut into small pieces, weighed (M1, approximately 0.5 g), and then placed into a wire nickel cage with a constant weight (M2). Then, the sample was soaked in 100 mL toluene. After 48 h, the toluene was replaced, and the sample was soaked for another 24 h. Then, the sample with the cage was removed, vacuum dried until its weight no longer changed, and weighed to obtain M3. The BRC was calculated according to eqn (1):
 | (1) |
The viscoelasticity of the compounds was tested by strain sweep using a rubber process analyzer (RPA 2000, Alpha Technologies Co., USA). The strain amplitude range, frequency and temperature applied were 0.43%–100%, 1 Hz and 100 °C, respectively. The stress relaxation process of the compounds was also tracked by RPA under shear mode at various temperatures and shear strain for a time period of 120 s. Furthermore, tensile stress relaxation tests were conducted by a dynamic mechanical analyzer (DMA, TA instrument, Q800) at a fixed strain of 20% for 80 min at 25 °C and 100 °C.
The compounds obtained were extruded using a twin-bore capillary rheometer (Rosand RH 2000, Malvern Co., UK). One of the bores is equipped with a capillary, the length (L) and the diameter (D) of which are 16 mm and 1 mm, respectively. The other bore is fitted with a zero-length orifice die (L and D were 0.25 mm and 1 mm, respectively) for Bagley correction. The extrusion tests of the compounds were carried out at 100 °C at various shearing rates (γas, 5, 10, 20, 50, 100, 200, 500 and 1000 s−1). The diameter of the extrudates (d) was measured by a stereoscopic microscope (Nikon SMZ 1500, Japan), and the die swell ratio (B) was calculated according to eqn (2):
 | (2) |
The tensile tests for the cured composites were conducted by a universal material testing machine (Z005, Zwick, Germany) at a drawing rate of 500 mm min−1, and the tensile strength, elongation at break, and modulus at 100% and 300% elongation were obtained. Five specimens were tested for the evaluation of tensile properties.
3 Results and discussion
3.1 Mixing process
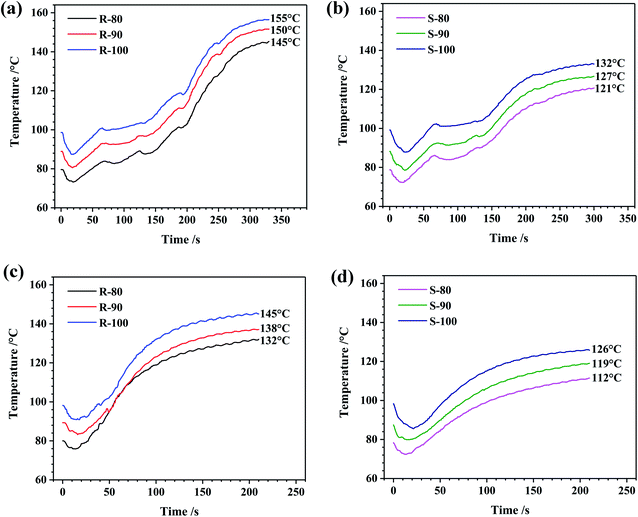
When the rubber and the ingredients were mixed in the internal mixer, heat was generated, and the temperature inside was elevated. With the temperature increase, the rubber is softened, and its flow capability is improved. However, an excessive temperature, which normally occurs late in the process, is not conducive to mixing. In this case, further extension of the mixing time is not effective for the mixing uniformity but may aggravate the oxidative cleavage of the rubber molecule chains.41,42 To solve this problem, a multistage mixing process was invented and widely applied to ensure the mixing quality and performance requirements of the final products.43 In this study, both samples R and S were prepared via a two-stage process.Furthermore, heat generation during mixing was studied. As shown in Fig. 1, the heat generation of the R was much higher than that of the S, which should be due to the higher CB content in the sample R. As the initial temperature increased, the dumping temperature increased, and the heat generation of R was much higher than that of S when the initial temperature was the same. It is worth noting that the dumping temperature differences between R and S were basically the same regardless of the initial temperature. For example, when the initial mixing temperatures were 80–100 °C, the dumping temperature differences between R and S were 23–24 °C and 18–19 °C in the first and second stages, respectively. In general, it can be speculated that heat generation was mainly impacted by the formula of the compounds, whereas the initial temperature can be considered a minor factor influencing heat generation.
To evaluate the mixing uniformity of the compound, the CB dispersity in the matrix was observed. The images, which were transformed by numerical treatment into black-and-white mode, and the agglomerate sizes are shown in Fig. 2 and Table 3, respectively. As shown in Fig. 2, the CB agglomerates are highlighted as light dots, and the dark background is associated with the rubber matrix with well-dispersed CB. The CB aggregation in sample R was much more serious than that in sample S. This difference should be attributed to the high CB content of R. As the initial mixing temperature increased from 80 °C to 90 °C, the CB aggregation of R was mitigated, which indicated a higher mixing uniformity. However, when the mixing temperature was further raised to 100 °C, the mixing uniformity was not obviously changed. As mentioned above, when the mixing temperature was high, the flow capability of the compound increased, which was not conducive to the effects of the rotor on CB–CB interaction breaking. Furthermore, no remarkable difference was found for the mean agglomerate size of R at various mixing temperatures (Table 3).
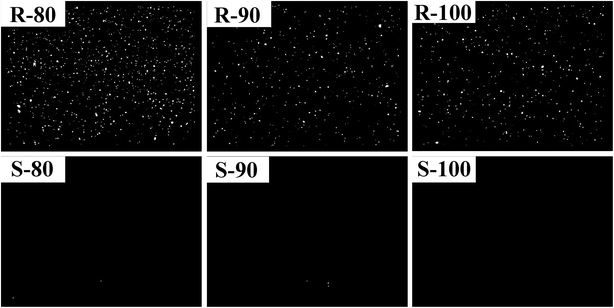 | ||
| Fig. 2 CB dispersity images of the R and S compounds prepared at various initial mixing temperatures. | ||
To further discuss the interaction between the CB and the rubber molecular chain, the BRCs of the compounds were tested, and the results are listed in Table 4. The rubber bounded with the CB in the R was more than that in the S due to the higher CB content in the R. The initial mixing temperature in the range of 80–100 °C did not significantly affect the BRC of either R or S. Generally, the BRC slightly increased with the mixing temperature, indicating a minimally improved CB–rubber interaction.
| R-80 | R-90 | R-100 | S-80 | S-90 | S-100 | |
|---|---|---|---|---|---|---|
| BRC/% | 44.9 ± 0.36 | 45.6 ± 0.64 | 45.3 ± 0.54 | 26.4 ± 0.81 | 26.7 ± 0.87 | 27.3 ± 0.52 |
3.2 Stress relaxation
During the extrusion process, the polymer fluid was subjected to complex stress inside the capillary, for example, tensile and shear stress. The influences of the initial mixing temperature on the stress relaxation behavior of R and S under shear mode are shown in Fig. 3. Under shear mode, all the compounds, especially S, showed rapid stress relaxation. However, the initial mixing temperature did not significantly affect the pace of relaxation. The time for the torque to decrease to 1/e of the samples, as listed in Table 5, was within 0.4–0.5 s and 0.7–0.8 s for S and R, respectively.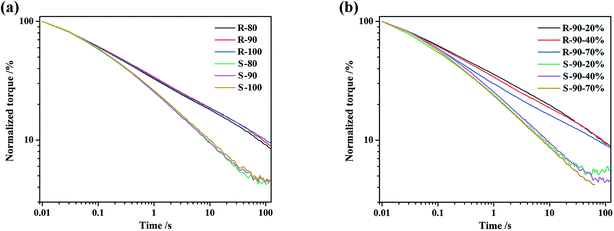 | ||
| Fig. 3 The normalized torque curves of the compounds under shear mode ((a) strain 40%, temperature 60 °C; (b) temperature 60 °C). | ||
Different from the results obtained under shear mode, the tensile stress relaxation rate was lower and more sensitive to the mixing temperature, which is shown in Fig. 4 and Table 6. As shown in Fig. 4(a), when tested at 25 °C, as the mixing temperature increased, the stress relaxation of both the R and S was obviously accelerated. This stress relaxation acceleration should be caused by the decrease in the rubber molecular weight and the improvement in CB dispersion. And the stress of the S dropped much more significantly. This should be due to the lower CB content in the S compound, which led to lower limitation on the rubber molecular chain. Furthermore, the tensile stress relaxation accelerated as the test temperature increased, and the relaxation rates of sample S became similar, whereas the rates of R mixed with various temperatures still showed large differences. It can be speculated that the stress relaxation rate change of S at 25 °C was mainly due to the slight decrease in the rubber molecular weight as the mixing temperature rose. As the test temperature increased, the mobility of the molecular chain sharply increased, and thus, the stress relaxation rate became similar.
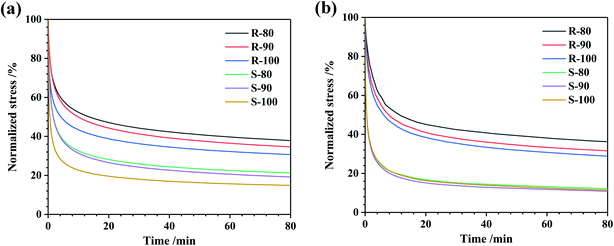 | ||
| Fig. 4 Normalized stress relaxation curves of the compounds under tensile mode ((a) 25 °C; (b) 100 °C). | ||
| Temperature/°C | t1/e/min | |
|---|---|---|
| 25 | R-80 | >80.0 |
| R-90 | 55.0 | |
| R-100 | 25.8 | |
| S-80 | 5.8 | |
| S-90 | 4.9 | |
| S-100 | 1.6 | |
| 100 | R-80 | 75.1 |
| R-90 | 38.9 | |
| R-100 | 27.0 | |
| S-80 | 1.6 | |
| S-90 | 1.3 | |
| S-100 | 1.6 |
3.3 Dynamic strain sweep
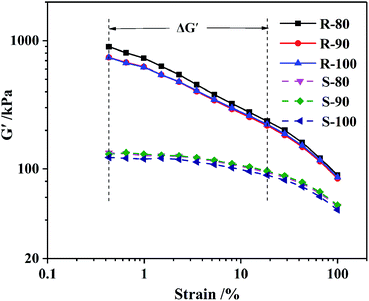
To analyze the internal interactions of CB–CB under dynamic deformation, dynamic strain sweeps of samples R and S with various mixing temperatures were carried out by RPA. The dependence of the storage modulus (G′) on the stain amplitude is shown in Fig. 5. Sample R showed a higher G′ than that of S, especially at the initial stage with a low stain amplitude, which should be due to the stronger CB–CB interaction. As the strain amplitude increased, the G′ of the R sharply decreased, which is described as the “Payne effect”, due to the breakup of the CB–CB network, and the CB–rubber interaction destruction and the disentanglement of the rubber molecular chains also contributed to this phenomenon. However, for S, a linear plateau region at a low strain area can be observed, which was similar to the unfilled rubber materials. This phenomenon is due to the lower content and good dispersion of the CB inside the S samples (Fig. 2), which led to a lack of a CB–CB network. Therefore, the modulus variation at low strains , as listed in Table 7, reflects the CB–CB network in the rubber matrix.
Furthermore, as the mixing temperature increased from 80 °C to 90 °C, G′ in the low strain area deceased, but that at high strain remained relatively stable. Hence, the ΔG′ decreased, which should be due to the improved CB dispersity. When the mixing temperature further increased to 100 °C, G′ was not obviously affected. For sample S, the G′s and ΔG′s of the three samples were not significantly different since CB was highly uniformly dispersed regardless of the mixing temperature in the range of 80–100 °C. The slight decrease in the G′ of S when the initial mixing temperature rises from 90 °C to 100 °C should be due to the rubber molecular weight decreasing.
3.4 B and the appearance of the extrudates
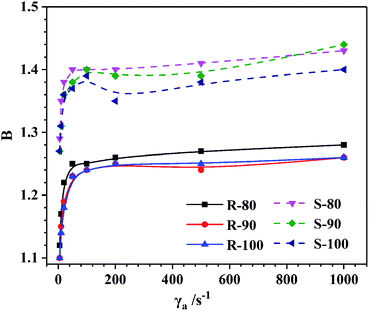
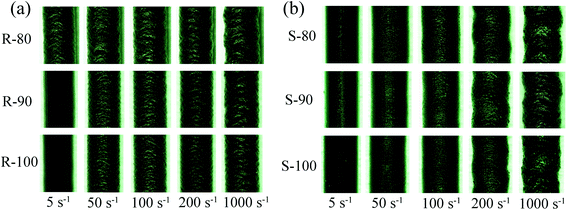
Die swelling of the extrudate is a typical elastic behavior that occurs because of the recovery of elastic deformation imposed inside the capillary. The dependence of B on γa at 100 °C of the compounds is illustrated in Fig. 6. As γa increased, the B of both R and S initially sharply increased and then slowly increased. The increase in B with γa was the result of the increasing recoverable elastic energy stored in the melt flow. However, the dependence between B and γa decreased when γa was above 100 s−1 since the fluidity of the rubbers was relatively high at 100 °C. When the γa reached 1000 s−1, the flow instability became much more severe, which led to significant distortion of the extrudates, especially for sample S (Fig. 7). In this case, the measured value of the extrudate diameter may have deviations to some extent. Generally, as the mixing temperature increased, although the CB dispersity and the BRCs remained basically unchanged, the B of the S obviously decreased. This phenomenon should be associated with the accelerated stress relaxation of the rubber molecular chains (Fig. 4) caused by the molecular weight reduction, which decreased the recovery of elastic deformation. However, for sample R, the increased CB content led to a relatively low elastic deformation ability, and the CB–rubber interaction degree became a major factor influencing B. With the mixing temperature increase, the stress relaxation of the rubber molecular chains significantly accelerated, but B initially decreased and then remained stable. This variation trend was similar to that of the CB dispersity and G′ under low strain conditions.Furthermore, the appearances of the extrudates are compared in Fig. 7. For R-80, all the extrudates with various extruding rates show obvious sharkskin due to the surface instability. Slight global distortion can also be observed when the apparent γa reaches 1000 s−1. As the mixing temperature increased, the sharkskin appearance was mitigated, which should be due to the improved CB dispersity. For sample S, the flow instability was more severe than that of sample R due to the lower content of CB and the presence of ESBR with a large side group; thus, integral distortion occurred when the γa was above 200 s−1. As the mixing temperature increased, the appearance state of the S was also improved.
3.5 Tensile properties of the vulcanizates
The tensile properties of the vulcanizates are very important for the rubber materials in actual applications.44–46 The tensile properties of the cured R and S are listed in Table 8. Compared with the S, sample R was with higher tensile strength and modulus but lower elongation at break due to its high CB content. However, the mixing temperature change in the range of 80 °C to 100 °C has little effect on the tensile properties of the vulcanizates. In other words, the tensile properties of the vulcanizates were less sensitive to the mixing temperature than the extrusion rheological behaviors of both the uncured R and S compounds.| Samples | Tensile strength/MPa | Elongation at break/% | 100% modulus/MPa | 300% modulus/MPa |
|---|---|---|---|---|
| a The elongation at break of the R was less than 300%. | ||||
| R-80 | 18.3 ± 1.28 | 223 ± 16.5 | 5.7 ± 0.08 | —a |
| R-90 | 18.8 ± 0.33 | 221 ± 11.9 | 6.0 ± 0.33 | —a |
| R-100 | 18.1 ± 0.88 | 213 ± 12.7 | 6.0 ± 0.17 | —a |
| S-80 | 15.1 ± 0.39 | 561 ± 10.2 | 1.1 ± 0.02 | 4.6 ± 0.15 |
| S-90 | 14.9 ± 0.76 | 562 ± 22.6 | 1.1 ± 0.02 | 4.6 ± 0.17 |
| S-100 | 15.1 ± 0.55 | 593 ± 5.1 | 1.1 ± 0.03 | 4.2 ± 0.03 |
4 Conclusions
In this paper, a two-stage mixing process was used to prepare rim strip (R) and sidewall (S) compounds with initial mixing temperatures of 80, 90 and 100 °C. The effects and mechanism of the mixing temperature on the rheological behaviors of the two compounds were different due to their different structures. R had a high carbon black (CB) content, and the CB dispersity was the main factor, whereas for S with a low CB content, the rubber molecular weight decrease during mixing became the determining factor. The stress relaxation rates under tensile mode of both R and S were more sensitive to the mixing temperature than the rates under shear mode. Strain sweep results obtained by RPA showed that R had a more obvious Payne effect than S. When the initial mixing temperature increased from 80 °C to 90 °C, both G′ and ΔG′ at low shear strain decreased, indicating CB dispersion improvement. Furthermore, the B of the S extrudates was higher and more sensitive to the mixing temperature than that of the R extrudates. As the mixing temperature increased, the B of S obviously decreased, whereas the B of R initially decreased and then remained basically unchanged. In addition, the increased mixing temperature was conducive to the improvement of the extrudate surfaces.Conflicts of interest
There are no conflicts to declare.References
- C. Abeykoon, Control Eng. Pract., 2016, 51, 69 CrossRef.
- C. Sirisinha, J. Sci. Soc. Thailand, 1997, 23, 259 CAS.
- P. G. Lafleur and B. Vergnes, Polymer extrusion, John Wiley & Sons, Hoboken, 2014 Search PubMed.
- T. Z. Zaeimoedin, M. Mustafa Kamal and A. K. Che Aziz, Adv. Mater. Res., 2016, 1133, 236 Search PubMed.
- M. R. Kashani, J. Appl. Polym. Sci., 2009, 113, 1355 CrossRef CAS.
- C. McAfee, J. A. Whidden and M. L. Dulisse, US Pat., 9868844B2, 2018.
- Y. K. Dai, H. Zheng, C. X. Zhou and W. Yu, J. Macromol. Sci., Part A: Pure Appl.Chem., 2008, 45, 1028 CrossRef CAS.
- Y. S. Ha, J. R. Cho, T. H. Kim and J. H. Kim, J. Mater. Process. Technol., 2008, 201, 168 CrossRef CAS.
- A. Goldshtein, G. Vavilova, A. Rumkin and O. Starý, Mater. Sci. Forum, 2019, 942, 141 Search PubMed.
- L. A. Goettler, A. J. Lambright, R. I. Leib and P. J. Dimauro, Rubber Chem. Technol., 1981, 54, 277 CrossRef CAS.
- R. J. Pazur and T. A. C. Kennedy, Rubber Chem. Technol., 2015, 88, 324 CrossRef CAS.
- A. Bandyopadhyay, M. De Sarkar and A. K. Bhowmick, Rubber Chem. Technol., 2005, 78, 806 CrossRef CAS.
- G. He, T. Luo, Y. G. Dang, L. Zhou, Y. Y. Dai and X. Ji, RSC Adv., 2021, 11, 817 RSC.
- C. Yang and Z. R. Li, J. Appl. Polym. Sci., 2016, 133, 43522 Search PubMed.
- A. M. Yousefi and H. Atsbha, Polym. Eng. Sci., 2009, 49, 229 CrossRef CAS.
- N. C. Das, H. Wang, J. Mewis and P. Moldenaers, J. Polym. Sci., Part B: Polym. Phys., 2005, 43, 3519 CrossRef CAS.
- S. Ganguly and N. C. Das, in Carbon-Containing Polymer Composites, ed. M. Rahaman et al., Springer, Singapore, 2019, p. 271 Search PubMed.
- G. M. C. Alwis, N. Kottegoda and U. N. Ratnayake, Appl. Clay Sci., 2020, 191, 105633 CrossRef CAS.
- S. Sadhu and A. K. Bhowmick, J. Polym. Sci., Part B: Polym. Phys., 2005, 43, 1854 CrossRef CAS.
- Z. Y. Zhu, Rheol. Acta, 2004, 43, 373 CrossRef CAS.
- A. K. Zachariah, V. G. Geethamma, A. K. Chandra, P. K. Mohammed and S. Thomas, RSC Adv., 2014, 4, 58047 RSC.
- N. Rattanasom and K. Suchiva, J. Appl. Polym. Sci., 2005, 98, 456 CrossRef CAS.
- S. Patcharaphun, Y. Sukniyom, W. Chookaew and N. Sombatsompop, Prog. Rubber, Plast. Recycl. Technol., 2014, 30, 129 CrossRef.
- M. Nanda and D. K. Tripathy, J. Appl. Polym. Sci., 2012, 126, 46 CrossRef CAS.
- A. Crié, C. Baritaud, R. Valette and B. Vergnes, Polym. Eng. Sci., 2015, 55, 2156 CrossRef.
- R. Niu, J. Gong, D. H. Xu, T. Tang and Z. Y. Sun, RSC Adv., 2014, 4, 62759 RSC.
- Z. Wang, Y. Han, Z. H. Huang, X. Zhang, L. Q. Zhang, Y. L. Lu and T. W. Tan, J. Appl. Polym. Sci., 2014, 131, 40643 CrossRef.
- Y. Q. Ren, S. H. Zhao, Q. Q. Li, X. Y. Zhang and L. Q. Zhang, J. Appl. Polym. Sci., 2015, 132, 41485 CrossRef.
- J. Li, Master Degree thesis, Qingdao University of Science and Technology, 2018.
- K. Kubota, R. Brzoskowski, J. L. White, F. C. Weissert, N. Nakajima and K. Min, Rubber Chem. Technol., 1987, 60, 924 CrossRef CAS.
- J. W. G. Main, PhD thesis, Martin Luther University Halle-Wittenberg, 2010.
- S. Brockhaus and V. Schöppner, Int. Polym. Sci. Technol., 2015, 42, 1 CrossRef.
- P. Elmiawan, H. Saryanto and D. Sebayang, IOP Conf. Ser.: Mater. Sci. Eng., 2017, 204, 012020 Search PubMed.
- M. Meysami, C. Tzoganakis, P. Mutyala, S. H. Zhu and M. Bulsari, Int. Polym. Process., 2017, 32, 183 CrossRef CAS.
- S. Sharma, K. Sarkar, M. Goswami, A. Deb, S. Dcunha and S. Chattopadhyay, J. Manuf. Process., 2020, 57, 700 CrossRef.
- M. J. Viloria, M. Valtier and B. Vergnes, J. Rheol., 2017, 61, 1085 CrossRef.
- R. Plachy, S. Scheiner, K. W. Luczynski, A. Holzner and C. Hellmich, Polymer, 2017, 123, 334 CrossRef CAS.
- S. Stieger, R. C. Kerschbaumer, E. Mitsoulis, M. Fasching, G. R. Berger-Weber, W. Friesenbichler and J. Sunder, Polym. Eng. Sci., 2020, 60, 32 CrossRef CAS.
- K. Sankaran, G. B. Nando, P. Ramachandran, S. Nair, U. Govindan, S. Arayambath and S. Chattopadhyay, RSC Adv., 2015, 5, 87864 RSC.
- U. Quintavalle, D. Voinovich, B. Perissutti, F. Serdoz, G. Grassi, A. Dal Col and M. Grassi, Eur. J. Pharm. Sci., 2008, 33, 282 CrossRef CAS PubMed.
- M. Pike and W. F. Watson, J. Polym. Sci., 1952, 9, 229 CrossRef CAS.
- R. F. Ohm, in Mixing of Rubber, ed. R. H. Grossman, Chapman & Hall, London, 1997, ch. 6, p. 91 Search PubMed.
- Q. Z. Yang, Practical Rubber Technology, Chemical Industry Press, Beijing, 2005 Search PubMed.
- S. Ganguly, P. Bhawal, A. Choudhury, S. Mondal, P. Das and N. C. Das, Polym.-Plast. Technol. Eng., 2018, 57, 997 CrossRef CAS.
- Z. Yang, Y. Huang and Y. Z. Xiong, RSC Adv., 2020, 10, 41857 RSC.
- L. P. Qin, Y. M. Zhang, Y. F. Zhang and Y. B. Gong, Appl. Clay Sci., 2021, 213, 106237 CrossRef CAS.
| This journal is © The Royal Society of Chemistry 2021 |

