 Open Access Article
New quinoxaline-based VEGFR-2 inhibitors: design, synthesis, and antiproliferative evaluation with in silico docking, ADMET, toxicity, and DFT studies†
Mohammed M. Alanazia,
Hazem Elkady *b,
Nawaf A. Alsaifa,
Ahmad J. Obaidullah
 a,
Hamad M. Alkahtani
 a,
Manal M. Alanazia,
Madhawi A. Alharbia,
Ibrahim H. Eissa
 *b and
Mohammed A. Dahab
 *b
*b
aDepartment of Pharmaceutical Chemistry, College of Pharmacy, King Saud University, P.O. Box 2457, Riyadh 11541, Saudi Arabia
bPharmaceutical Medicinal Chemistry & Drug Design Department, Faculty of Pharmacy (Boys), Al-Azhar University, Cairo 11884, Egypt. E-mail: mohammeddahab@azhar.edu.eg; ibrahimeissa@azhar.edu.eg; Hazemelkady@azhar.edu.eg
First published on 12th October 2021
Abstract
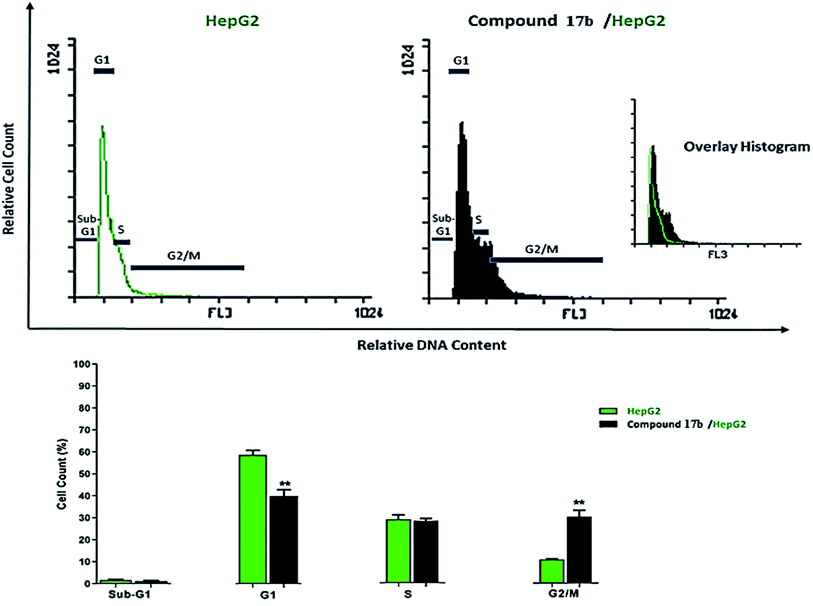
A new series of 3-methylquinoxaline-based derivatives having the same essential pharmacophoric features as VEGFR-2 inhibitors have been synthesized and evaluated for their antiproliferative activities against two human cancer cell lines, MCF-7 and HepG-2. Compounds 15b and 17b demonstrated a significant antiproliferative effect with IC50 ranging from 2.3 to 5.8 μM. An enzymatic assay was carried out for all the tested candidates against VEGFR-2. Compound 17b was the most potent VEGFR-2 inhibitor (IC50 = 2.7 nM). Mechanistic investigation including cell cycle arrest and apoptosis was performed for compound 17b against HepG-2 cells, and the results revealed that 17b induced cell apoptosis and arrested cell cycle in the G2/M phase. Moreover, apoptosis analyses were conducted for compound 17b to evaluate its apoptotic potential. The results showed upregulation in caspase-3 and caspase-9 levels, and improving the Bax/Bcl-2 ratio by more than 10-fold. Docking studies were performed to determine the possible interaction with the VEGFR-2 active site. Further docking studies were carried out for compound 17b against cytochrome P450 to present such compounds as non-inhibitors. In silico ADMET, toxicity, and physico-chemical properties revealed that most of the synthesized members have acceptable values of drug-likeness. Finally, DFT studies were carried out to calculate the thermodynamic, molecular orbital and electrostatic potential properties.
1. Introduction
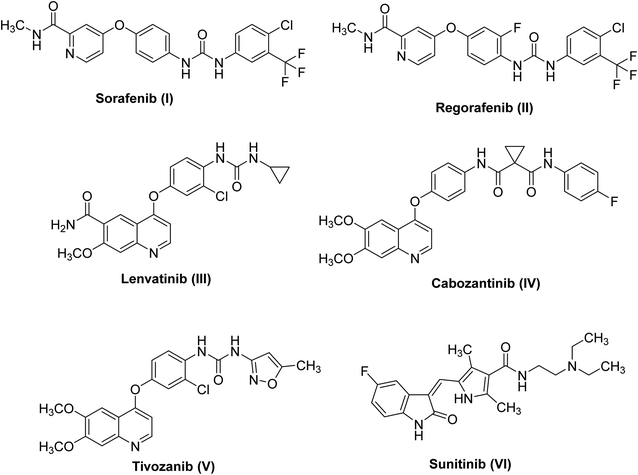
Deregulation of the cell cycle may cause cancer onset, progression, and metastasis.1,2 Receptor tyrosine kinases (RTKs) play a central role in cellular proliferation.3 RTK expression is highly organized in normal cells; however, in cancer cells overexpression of some RTKs was observed.4 Similarly, the vascular endothelial growth factor receptor (VEGFR), an important RTK, plays a remarkable role in angiogenesis.5 It is composed of three isoforms, VEGFR-1, VEGFR-2 and VEGFR-3.6 Chiefly, VEGFR-2 is the main mediator of angiogenesis in cancer cells.7 Signaling of VEGFR-2 is up-regulated at specific phases of cancer to support tumor proliferation and expansion.8 The main concept to discover novel VEGFR-2 inhibitors is to hinder autophosphorylation and dimerization processes of the receptor.9Small molecule inhibitors targeting the kinase domain (KD) leading to blocking signaling pathway hence, suppression of tumor growth.10 In 2007, sorafenib I turned into the first VEGFR-2 inhibitor11 to be utilized in the treatment of hepatocellular carcinoma and renal cell carcinoma.12 During the previous few decades, several VEGFR-2 inhibitors were designed as an adjunctive for cancer therapy. Regorafenib II,13 lenvatinib III,14 cabozantinib IV,15 tivozanib V,16 and sunitinib VI17 were marketed for the treatment of different types of cancers (Fig. 1).
VEGFR-2 inhibitors are classified into three classes: (i) ATP competitive inhibitors, binds to the zone which is fitted by adenine ring of ATP e.g. sunitinib.18 (ii) Inhibitors that are not able to bind at adenine binding site but bind beside the hydrophobic pocket e.g. sorafenib.18 (iii) Covalent inhibitors which covalently bind to cysteine amino acid residue at the binding site and hinder binding of ATP e.g. vatalanib.19
Quinoxaline derivatives are a widespread class of the heterocycles receiving the most attention especially in the field of chemotherapy.20–22 Many drugs incorporating quinoxaline moiety achieved promising results and have been submitted to clinical trials for anticancer therapeutic purposes.23,24
In this work, some quinoxaline derivatives were synthesized and evaluated for their cytotoxicity and VEGFR-2 inhibitory activity. The most active candidate was assessed for its apoptotic effect and cell cycle arrest. Different in silico docking studies were carried out to predict the binding interaction with the prospective target (VEGFR-2) via docking studies. Also, in silico ADMET and toxicity studies were performed to predict the level of drug likeness. Furthermore, DFT studies were carried out to predict the HOMO and LUMO energy as well electrostatic potential map.
1.1 Design concept
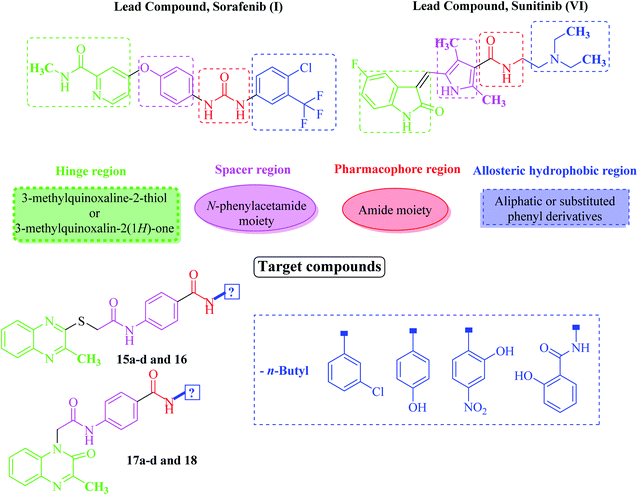
Based on the above-mentioned findings and in the extension of our former work targeting anticancer derivatives,25–32 especially VEGFR-2 inhibitors33,34 we synthesized new quinoxaline derivatives as based on the study of the structure–activity relationships (SAR) of different VEGFR-2 inhibitors. VEGFR-2 inhibitors were found to share basic pharmacophoric features. (i) A head group which is required to be flat hetero aromatic to occupy the hinge region (colored green in Fig. 2). (ii) A hydrophobic spacer to occupy the linker area between the ATP binding domain and the DFG domain of the enzyme35 (colored purple in Fig. 2). (iii) A hydrogen-bonding (pharmacophore) moiety that is required to achieve hydrogen bond interactions with Asp1044 and Glu883 in the DFG motif36 (colored red in Fig. 2). (iv) A terminal hydrophobic (tail) moiety which occupies the allosteric hydrophobic back pocket37 (colored blue in Fig. 2).The main concept of our design was achieved by bioisosteric alteration of VEGFR-2 inhibitors (sorafenib & sunitinib). Such modifications were done at four positions. Firstly, bioisosteric replacement of pyridine or indole rings by 3-methylquinoxalin-2(1H)-one or 3-methylquinoxaline-2-thiol moieties in the hinge region to occupy the adenine region in the ATP binding pocket. The second strategy was to use N-phenylacetamide moiety in the spacer region instead of the central aryl ring of the lead structures aiming to improve VEGFR-2 binding affinity. Thirdly, we noticed that the conserved hydrogen-bonding moiety between the spacer and the allosteric site residues was done using urea (in case of sorafenib) or amide (in case of sunitinib) moieties. In this regard, we designed our quinoxaline compounds with one or two amides pharmacophoric linking moiety containing HBA–HBD functional groups. The fourth strategy was to replace the terminal hydrophobic tail with other different hydrophobic moieties including aliphatic or substituted phenyl derivatives. The concept of using these hydrophobic moieties was to guarantee different lipophilic and electronic environments, which could result in additional hydrophobic interactions with the receptor.
2. Results and discussion
2.1 Chemistry
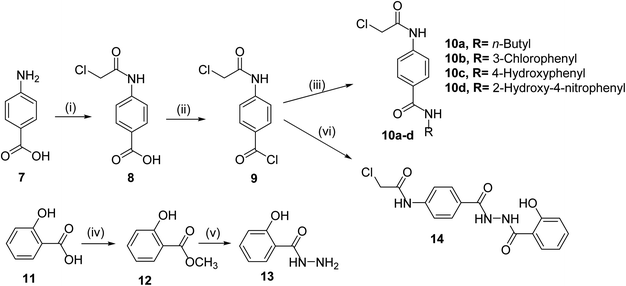
The classical method of quinoxaline preparation is to condensate phenylenediamine with a dicarbonyl compound.38 This procedure requires high temperatures, a strong acid catalyst, and long reaction times. Other strategies described for the synthesis of quinoxaline derivatives involve 1,4-addition of 1,2-diamines to diazenylbutenes.39 There are also several green synthetic methods e.g. one-pot synthesis,40 microwave-assisted synthesis,41 recyclable catalysts42 and reactions in aqueous medium.43 In this study and in the light of above findings, we used 3-methylquinoxalin-2(1H)-one as the scaffold to design new antitumor agents. For the synthesis of our target compounds, compounds 5, 6, 10a–d, and 14 were initially synthesized according to the reported procedures28,44 as outlined in Schemes 1 and 2.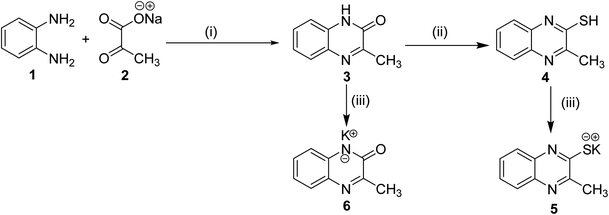 | ||
| Scheme 1 General synthetic route of target salts 5 and 6; reaction conditions: (i) glacial acetic acid/H2O/reflux/2 h, (ii) thiourea/EtOH/reflux/6 h, (iii) Alc. KOH/reflux/30 min. | ||
The final compounds 15a–d, 16, 17a–d and 18 were obtained in good yields following the reported procedures45 described in Schemes 3 and 4.
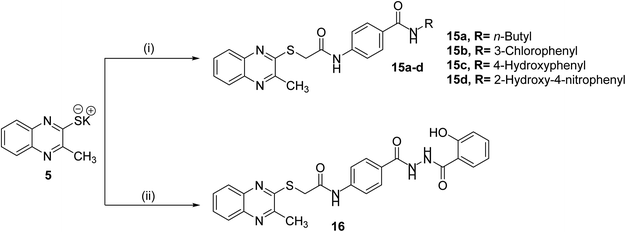 | ||
| Scheme 3 General synthetic route of target final compounds 15a–d and 16; reaction conditions: (i) 10a–d/cat. KI/DMF/WB/6 h, (ii) 14/cat. KI/DMF/WB/6 h. | ||
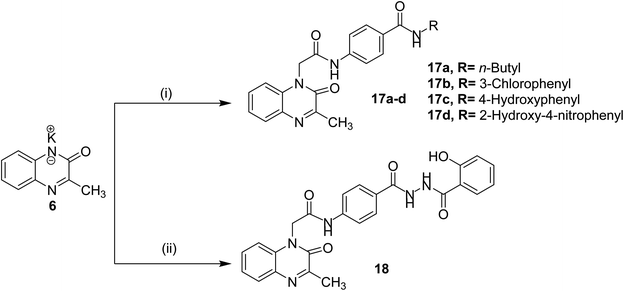 | ||
| Scheme 4 General synthetic route of target final compounds 17a–d and 18; reaction conditions: (i) 10a–d/cat. KI/DMF/WB/6 h, (ii) 14/cat. KI/DMF/WB/6 h. | ||
2.2 Biological evaluation
| Comp. | MCF-7a (IC50, μM) | HepG-2a (IC50, μM) | VEGFR-2a (IC50, nM) | Normal hepatocytesa (IC50, μM) |
|---|---|---|---|---|
| a IC50 values are the mean ± S.D. (standard deviations) of three separate experiments.b NT: not tested. | ||||
| 15a | 62.1 ± 3.2 | 41.2 ± 1.9 | 23.1 ± 0.8 | NTb |
| 15b | 5.8 ± 0.6 | 4.2 ± 0.3 | 3.4 ± 0.2 | NTb |
| 15c | 62.2 ± 2.9 | 50.4 ± 2.4 | 27.8 ± 1.2 | NTb |
| 15d | 61.5 ± 2.3 | 42.8 ± 1.8 | 31.5 ± 1.3 | NTb |
| 16 | 35.8 ± 1.9 | 27.1 ± 1.2 | 18.5 ± 0.8 | NTb |
| 17a | 29.3 ± 2.1 | 24.5 ± 1.0 | 11.2 ± 0.4 | NTb |
| 17b | 2.8 ± 0.2 | 2.3 ± 0.2 | 2.7 ± 0.1 | 24.68 ± 1.3 |
| 17c | 17.9 ± 0.6 | 14.3 ± 0.6 | 13.9 ± 0.5 | NTb |
| 17d | 35.2 ± 1.6 | 22.4 ± 1.3 | 11.2 ± 0.3 | NTb |
| 18 | 22.3 ± 1.2 | 14.8 ± 0.5 | 11.2 ± 0.2 | NTb |
| Sorafenib | 3.51 ± 1.1 | 2.17 ± 0.1 | 3.12 ± 0.8 | 24.34 ± 1.6 |
Based on the biological data, we can reach valuable SAR. It was found that the second series compounds 17a–d and 18 (incorporating 3-methylquinoxalin-2(1H)-one) is more active than corresponding members 15a–d and 16 (incorporating 3-methylquinoxaline-2-thiol). Such results indicate that 3-methylquinoxalin-2(1H)-one moiety is more advantageous than 3-methylquinoxaline-2-thiol moiety. The comparison between compounds containing aliphatic hydrophobic tail (15a and 17a with IC50 values of 23.1 and 11.2 nM, respectively) and the corresponding members containing 3-chlorophenyl moiety (15b and 17b with IC50 values of 3.4 and 2.7 nM, respectively) indicate that aromatic ring containing electron withdrawing group is more preferred biologically than aliphatic moiety. Comparing the IC50 values of compound 15b and 17b incorporating electron withdrawing group with their corresponding members 15c and 17c incorporating electron donating group, indicate that substitution with electron withdrawing group is more advantageous.
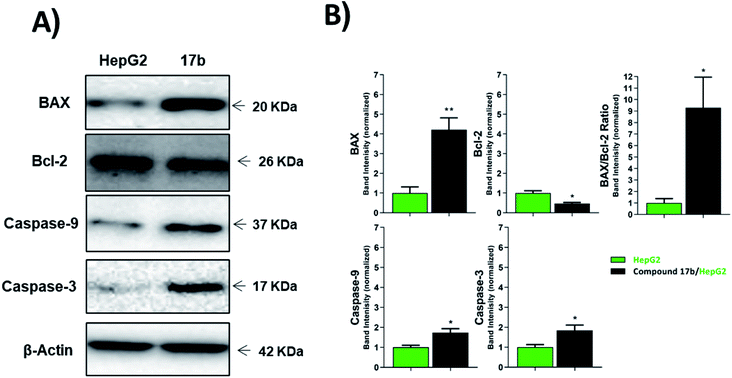 | ||
| Fig. 4 The immunoblotting of the apoptotic markers (normalized to β-actin). *p < 0.05, **p < 0.01, ***p < 0.001. | ||
| Sample | Protein expression (normalized to β-actin)a | ||||
|---|---|---|---|---|---|
| BAX | Bcl-2 | BAX/Bcl-2 ratio | Caspases-9 | Caspases-3 | |
| a Values are given as mean ± SEM of three independent experiments. *p < 0.05 and **p < 0.01 indicate statistically significant differences from the corresponding control (HepG-2) group in unpaired t-tests. | |||||
| HepG-2 | 1.00 ± 0.31 | 1.00 ± 0.12 | 1.00 ± 0.38 | 1.00 ± 0.10 | 1.00 ± 0.13 |
| 17b/HepG-2 | 4.21 ± 0.60** | 0.32 ± 0.04* | 9.30 ± 2.66* | 1.74 ± 0.20* | 1.85 ± 0.26* |
2.3 In silico studies
| Comp. | ΔG [kcal mol−1] | Comp. | ΔG [kcal mol−1] |
|---|---|---|---|
| 15a | −24.63 | 17b | −23.97 |
| 15b | −23.27 | 17c | −23.62 |
| 15c | −23.03 | 17d | −23.67 |
| 15d | −23.47 | 18 | −24.14 |
| 16 | −22.33 | Sorafenib | −22.15 |
| 17a | −24.89 |
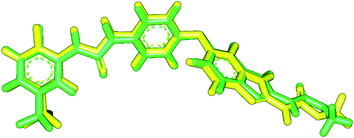
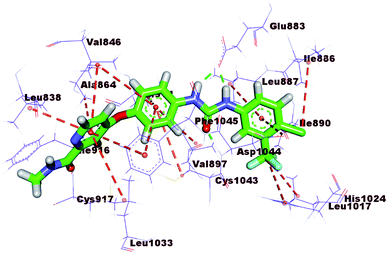
The mode of interaction of compound 15b against VEGFR-2 active site was the same of sorafenib (ΔG = −23.27 kcal mol−1). The amide group was involved in two hydrogen bonds, where the amidic NH formed a hydrogen bond with the carboxylate moiety of Glu883 (2.66 Å) and the carbonyl group formed another hydrogen bond with the NH of Asp1044 (3.0 Å). Additionally, the quinoxaline moiety occupied the hinge region forming two hydrophobic interactions with Leu383 and Phe916. The central phenyl ring formed three hydrophobic interactions with Val897, Val914, and Cys1043. The terminal 3-chlorophenyl moiety was involved in three hydrophobic moieties with Ile890, Lue887, and Ile886. In addition, it formed one electrostatic interaction with Asp1044 (Fig. 7).
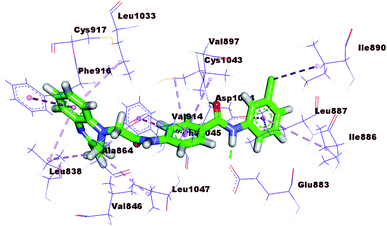
The docking results of compound 17b (ΔG = −23.97 kcal mol−1) are nearly similar to that of sorafenib. In the DFG region, –NH of the amide moiety in the pharmacophore region formed a hydrogen bond with the carboxylate moiety of Glu883 (1.72 Å). Also, carbonyl group of the amide moiety formed another hydrogen bond with the NH of Asp1044 (2.99 Å). In addition, the terminal hydrophobic (3-chlorophenyl moiety) formed three hydrophobic interactions with Leu887, Ile886, and Ile890. Also, it formed electrostatic interaction with Asp1044. Moreover, the quinoxaline moiety occupied the hinge region forming five hydrophobic interactions with Leu1033, Phe916, Leu838, Phe1045, and Leu1047. The central phenyl group formed four hydrophobic bonds with Val914, Val897, Cys1043, and Phe1045. Such binding pattern may explain the promising biological activity of this member comparing the other candidates (Fig. 8).
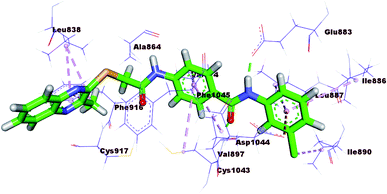
The binding modes of compounds 16 and 18 are depicted in ESI.† All figures in our docking study were visualized using Discovery Studio Visualizer.
| Comp. | Binding free energy (kcal mol−1) | No. of hydrogen bonds | No. of electrostatic interaction | No. of hydrophobic interaction |
|---|---|---|---|---|
| 17b | −16.05 | 0 | 0 | 5 |
| PKT | −25.73 | 1 | 1 | 7 |
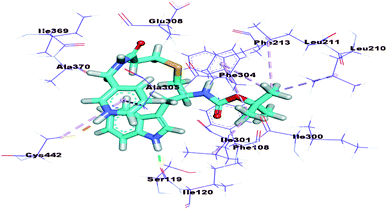
The proposed binding mode of PKT showed binding energy of −25.73 kcal mol−1. It formed one hydrogen bond with Ser119 and one electrostatic bond with Cys442. In addition, it formed seven hydrophobic interactions with Leu210, Leu211, Ile301, Ala305, and Phe304 (Fig. 9).
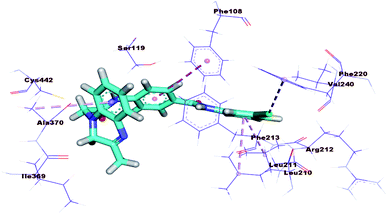
The proposed binding mode of 17b was illustrated in Fig. 10 with binding energy −16.05 kcal mol−1, far less than that of the co-crystallized ligand. In addition, the binding mode of this compound was different from that of the co-crystallized ligand. These results revealed that 17b cannot be CYP3A4 inhibitors and consequently indicates its less liver toxicity.
| Comp. | BBB levela | Solubility levelb | Absorption levelc | CYP2D6 predictiond | PPB predictione |
|---|---|---|---|---|---|
| a BBB level, 0 = very high, + = high, ++ = medium, +++ = low, ++++ = very low.b Solubility level, + = very low, ++ = low, +++ = good, ++++ = optimal.c Absorption level, 0 = good, + = moderate, ++ = poor, ++ = very poor.d CYP2D6, cytochrome P2D6, T = inhibitor, F = non inhibitor.e PBB, plasma protein binding (less than 90% or more than 90%). | |||||
| 15b | ++++ | ++ | 0 | F | More than 90% |
| 17b | +++ | ++ | 0 | F | More than 90% |
| Sorafenib | ++++ | + | 0 | F | More than 90% |
At first, the carcinogenic potency TD50 values (from 9.366 to 142.906 mg per kg body weight per day) of the tested compounds were higher than that of the reference molecule; sorafenib (TD50 = 19.236 mg per kg body weight per day). In addition, the maximum tolerated dose values (from 0.096 to 0.333 g per kg body weight) of both compounds were higher than sorafenib (0.089 g per kg body weight). Furthermore, the tested compounds showed oral LD50 values ranging from 4.703 to 12.496 mg per kg body weight per day which were higher than that of sorafenib (0.823 mg per kg body weight per day). For rat chronic lowest observed adverse effect level (LOAEL), the tested molecules showed higher values (from 0.072 to 0.583 g per kg body weight) than sorafenib (0.005 g per kg body weight). Moreover, the tested compounds were predicted to be mild irritant against eyes and non-irritant against skin. For aerobic biodegradability model, all compounds were anticipated to be non-degradable. In silico toxicity studies for the synthesized compounds are explained in ESI.†
![[thin space (1/6-em)]](https://www.rsc.org/images/entities/char_2009.gif) log
log![[thin space (1/6-em)]](https://www.rsc.org/images/entities/char_2009.gif) P values express the degree of lipophilicity of the chemical compound, where the log
P values express the degree of lipophilicity of the chemical compound, where the log![[thin space (1/6-em)]](https://www.rsc.org/images/entities/char_2009.gif) D values express the degree of lipophilicity of the chemical compound taking into account the ionization states of the molecule.54 An increase in these values indicates an increase in the lipophilic character of the tested compound. It is worthwhile to note that the A
D values express the degree of lipophilicity of the chemical compound taking into account the ionization states of the molecule.54 An increase in these values indicates an increase in the lipophilic character of the tested compound. It is worthwhile to note that the A![[thin space (1/6-em)]](https://www.rsc.org/images/entities/char_2009.gif) log
log![[thin space (1/6-em)]](https://www.rsc.org/images/entities/char_2009.gif) P and log
P and log![[thin space (1/6-em)]](https://www.rsc.org/images/entities/char_2009.gif) D values for most compounds in acceptable range for oral and intestinal absorption (1.44–4.74).55
D values for most compounds in acceptable range for oral and intestinal absorption (1.44–4.74).55In addition, the molecular polar surface area (MPSA) is another key property linked to drug bioavailability; the passively absorbed molecules with MPSA >140 have low oral bioavailability.56 Compounds 15b and 17b showed acceptable values of MPSA less than 140. Moreover, molecular volume (MV) descriptor determines transport characteristics of molecules, such as intestinal absorption.57 The drug diffusivity is inversely proportional to the molecular volume. Molecules with lower MV have higher diffusivity.58 It was observed that both compounds exhibited low molecular volume values (from 315.21 to 353.63) when compared with sorafenib (MV = 323.1). Finally, Lipinski rule of five was applied for compounds 15b and 17b. It was found that both of them have molecular weight less than 500, hydrogen bond acceptor groups less than 10, and hydrogen bond donor group less than 5. This indicates that these compounds are likely to be orally bioavailable (Table 7). Physico-chemical properties for the rest of the compounds are explained in ESI.†
| Comp. | A![[thin space (1/6-em)]](https://www.rsc.org/images/entities/char_2009.gif) log log![[thin space (1/6-em)]](https://www.rsc.org/images/entities/char_2009.gif) Pa Pa |
log![[thin space (1/6-em)]](https://www.rsc.org/images/entities/char_2009.gif) Db Db |
MPSAc | MSAd | MVe | HBAf | HBDg | M. WTh |
|---|---|---|---|---|---|---|---|---|
| a Log of the octanol–water partition coefficient.b The octanol–water partition coefficient calculated considering the ionization states of the molecule.c Molecular surface area: calculates the total surface area for each molecule using a 2D approximation.d Molecular polar surface area: calculates the polar surface area for each molecule using a 2D approximation.e Molecular volume: calculates the 3D volume for each molecule using the current 3D coordinates.f Hydrogen bond acceptor atoms.g Hydrogen bond donor atoms.h Molecular weight. | ||||||||
| 15b | 4.74 | 4.74 | 109.28 | 444.39 | 339.56 | 6 | 2 | 462.951 |
| 17b | 3.12 | 3.12 | 90.87 | 430.37 | 328.25 | 7 | 2 | 446.886 |
| Sorafenib | 4.17 | 4.17 | 92.35 | 434.9 | 323.1 | 7 | 3 | 464.825 |
The results (Table 8) revealed that the total energies of compounds 15b, 17b and sorafenib have negative values which are favorable for spontaneous binding and interaction. In addition, both 15b and 17b have dipole moment values very close to that of sorafenib. The improved dipole moment can enhance hydrogen bond and non-bonded interactions in drug receptor complexes which keep an important role to increase binding affinity. Elevated dipole moment indicated the increased binding affinity with target enzyme during VEGFR-2 inhibitory activities. Thermodynamic parameters for the rest of the compounds are explained in ESI.†
| Name | Total energy (kcal mol−1) | Binding energy (kcal mol−1) | HOMO energy (kcal mol−1) | LUMO energy (kcal mol−1) | Gap energy | μ |
|---|---|---|---|---|---|---|
| 15b | −2139.791 | −10.576 | −0.200 | −0.107 | 0.093 | 2.365 |
| 17b | −1817.724 | −10.717 | −0.201 | −0.103 | 0.098 | 3.061 |
| Sorafenib | −2000.377 | −9.866 | −0.200 | −0.091 | 0.109 | 3.088 |
2.3.6.1 Molecular orbital analysis for compound 17b. According to the frontier molecular orbital theory, the energies of HOMO and LUMO play an important role in chemical reactivity.59 It was evident that compound 17b have gap energy values very close to that of sorafenib. Fig. 11 showed the spatial distribution of molecular orbitals for compound 17b. Molecular orbital analysis for sorafenib and compound 15b are depicted in ESI.†
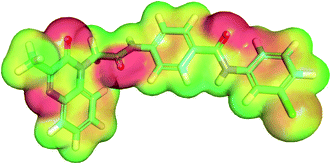
2.3.6.2 Electrostatic potential map for compound 17b. Electrostatic interactions are one of the forces guiding the binding of molecules to proteins. The assessment of this interaction through computational approaches makes it possible to evaluate the energy of protein–drug complexes.60 Next to steric complementarity, electrostatics are one of the main driving forces involved in molecular recognition.61 Electrostatics are known to play a key role in protein–DNA,62 protein–protein63 and protein–substrate61 recognitions.
There are many colored patches in MEP surface according to availability of electron cloud. Atoms with high electronegativity and negative charges display red color and can form hydrogen bonding acceptor. While atoms with poor electron and positive charge display blue color and can form hydrogen bonding donor. The atoms with zero charge values display green to yellow color and can form π- and other types of staking interactions. This molecular detail helps to predict how much they are potential to take part in chemical reactions and to realize their mechanism of interactions.64
The most active compound 17b showed MEP map like that of sorafenib to some extent. The quinoxaline moiety showed a red patch at the nitrogen atoms and carbonyl group which can form hydrogen bond with polar amino acids at the hinge region. The two amide groups in each molecule showed red and blue patches which indicate the possibility of hydrogen bond formation. The aromatic moieties in each molecule showed high electron cloud (green to yellow patches) which can favor the π-staking interaction with aromatic amino acid residues (Fig. 12). Molecular electrostatic potential map for sorafenib and 15b are depicted in ESI.†
3. Conclusion
In the presented work ten quinoxaline derivatives (15a–d, 16, 17a–d, and 18) were designed and synthesized. Compound 17b was the most promising candidate against MCF-7, HepG-2, and VEGFR-2 with IC50 values of 2.8 μM, 2.3 μM, and 2.7 nM respectively, more than that of sorafenib 3.51 μM, 2.17 μM, and 3.12 nM respectively. Also, compound 17b arrested the cell cycle in the G2/M phase and induced apoptosis in HepG-2 cells. Moreover, the mentioned compound upregulated the level caspase-3, caspase-9 and boosted the Bax/Bcl-2 ratio by more than 10-fold, as compared to the control. Docking studies revealed that most compounds have similar binding pattern with VEGFR-2. In silico ADMET, toxicity, and physico-chemical properties divulged that target compounds exhibited acceptable pharmacokinetic profile, and physicochemical properties. Further docking studies for compound 17b against cytochrome P450 showed the non-inhibitory effect of this compound. DFT calculations including total energy, binding energy, HOMO, LUMO, gap energy, dipole moment, and electrostatic potential were performed. The development of other VEGFR-2 inhibitors involving quinoxaline derivatives is ongoing and will be reported in due course.4. Experimental
4.1 Chemistry
All the reagents, chemicals, apparatus were described in ESI.† Compounds 3, 4, 5, 6, 8, 9, 10a–d, 12, 13, and 14 were obtained according to the reported procedures.29,65–684.1.1.1 N-Butyl-4-(2-((3-methylquinoxalin-2-yl)thio)acetamido)benzamide 15a. Yellow crystal (yield, 65%); mp = 190–192 °C; FT-IR (ν max, cm−1): 3370, 3273, 3100, 2956, 2931, 1674, 1621, 1536; 1H NMR (700 MHz, DMSO-d6) δ 10.66 (s, 1H), 8.32 (t, J = 5.6 Hz, 1H), 7.97–7.95 (m, 1H), 7.82 (d, J = 6.0 Hz, 1H), 7.81 (d, J = 6.8 Hz, 2H), 7.73–7.69 (m, 2H), 7.69–7.67 (m, 2H), 4.30 (s, 2H), 3.24 (td, J = 7.1, 5.6 Hz, 2H), 2.67 (s, 3H), 1.51–1.48 (m, 2H), 1.34–1.31 (m, 2H), 0.90 (t, J = 7.4 Hz, 3H); 13C NMR (176 MHz, DMSO-d6) δ 166.93, 165.98, 155.45, 151.97, 141.89, 140.81, 139.34, 130.03, 129.90, 128.91, 128.67, 128.53, 127.37, 118.71, 39.27, 35.38, 31.78, 22.18, 20.14, 14.21; MS (m/z): exact mass calcd for C22H24N4O2S [M]+: 408.2. Found: 408.2. Anal. calcd for C22H24N4O2S: C, 64.68; H, 5.92; N, 13.71. Found: C, 63.86; H, 6.00; N, 13.34.
4.1.1.2 N-(3-Chlorophenyl)-4-(2-((3-methylquinoxalin-2-yl)thio)acetamido)benzamide, 15b. Reddish white crystal (yield, 75%); mp = 223–225 °C; FT-IR (ν max, cm−1): 3400, 3270, 2900, 1668, 1644, 1592; 1H NMR (700 MHz, DMSO-d6) δ 10.77 (s, 1H), 10.29 (s, 1H), 7.98–7.95 (m, 4H), 7.83 (dd, J = 8.2, 1.6 Hz, 1H), 7.79 (d, J = 8.6 Hz, 2H), 7.72–7.68 (m, 3H), 7.38 (t, J = 8.1 Hz, 1H), 7.15 (dd, J = 8.1, 2.1 Hz, 1H), 4.33 (s, 2H), 2.67 (s, 3H); 13C NMR (176 MHz, DMSO-d6) δ 167.12, 165.58, 155.43, 151.96, 142.71, 141.25, 140.81, 139.36, 133.39, 130.75, 130.02, 129.45, 129.30, 128.90, 128.68, 127.37, 123.63, 120.09, 119.02, 118.82, 35.43, 22.18; MS (m/z): exact mass calcd for C24H19ClN4O2S [M]+: 462.1. Found: 463.0. Anal. calcd for C24H19ClN4O2S: C, 62.27; H, 4.14; N, 12.10. Found: C, 61.91; H, 3.92; N, 11.57.
4.1.1.3 N-(4-Hydroxyphenyl)-4-(2-((3-methylquinoxalin-2-yl)thio)acetamido)benzamide 15c. Deep brown crystal (yield, 70%); mp = 250–252 °C; FT-IR (ν max, cm−1): 3450, 3318, 2910, 1669, 1601, 1511; 1H NMR (700 MHz, DMSO-d6) δ 10.91 (s, 1H), 10.76 (s, 1H), 10.24 (s, 1H), 8.13–8.11 (m, 2H), 7.97 (d, J = 4.3 Hz, 2H), 7.84 (d, J = 8.5 Hz, 2H), 7.80–7.77 (m, 2H), 7.72–7.69 (m, 2H), 7.26–7.24 (m, 2H), 4.34 (s, 2H), 2.68 (s, 3H); 13C NMR (176 MHz, DMSO-d6) δ 167.40, 167.08, 155.46, 151.98, 140.81, 139.37, 131.61, 130.06, 129.22, 128.93, 128.69, 127.38, 122.46, 121.72, 119.08, 118.80, 115.41, 35.50, 22.19; MS (m/z): exact mass calcd for C24H20N4O3S [M]+: 444.1. Found: 445.1. Anal. calcd for C24H20N4O3S: C, 64.85; H, 4.54; N, 12.60. Found: C, 64.8; H, 4.86; N, 12.04.
4.1.1.4 N-(2-Hydroxy-4-nitrophenyl)-4-(2-((3-methylquinoxalin-2-yl)thio)acetamido)benzamide 15d. Yellow crystal (yield, 80%); mp = 195–197 °C; FT-IR (ν max, cm−1): 3450, 3269, 2910, 1671, 1594, 1508; 1H NMR (700 MHz, DMSO-d6) δ 11.15 (s, 1H), 10.81 (s, 1H), 9.49 (s, 1H), 8.25 (dd, J = 9.4, 3.9 Hz, 1H), 8.08–8.02 (m, 2H), 7.98 (d, J = 7.7 Hz, 2H), 7.96 (d, J = 4.5 Hz, 2H), 7.83 (d, J = 8.5 Hz, 2H), 7.73 (d, J = 8.4 Hz, 2H), 4.33 (s, 2H), 2.68 (s, 3H); 13C NMR (176 MHz, DMSO-d6) δ 167.18, 165.11, 162.78, 155.44, 151.97, 148.61, 143.65, 143.06, 140.81, 139.36, 133.68, 130.05, 129.27, 128.92, 128.69, 127.38, 121.80, 119.00, 109.89, 36.26, 35.46, 31.24, 22.19; MS (m/z): exact mass calcd for C24H19N5O5S [M]+: 489.1. Found: 490.0. Anal. calcd for C24H19N5O5S: C, 58.89; H, 3.91; N, 14.31. Found: C, 58.48; H, 3.58; N, 14.94.
4.1.1.5 N-(4-(2-(2-Hydroxybenzoyl)hydrazine-1-carbonyl)phenyl)-2-((3-methylquinoxalin-2-yl)thio)acetamide 16. Deep brown crystal (yield, 55%); mp = 208–210 °C; FT-IR (ν max, cm−1): 3450, 3261, 2910, 1647, 1603, 1524; 1H NMR (700 MHz, DMSO-d6) δ 11.97 (s, 1H), 10.76 (s, 1H), 10.67–10.66 (m, 1H), 10.58 (s, 1H), 7.95 (d, J = 1.7 Hz, 2H), 7.77 (d, J = 8.5 Hz, 2H), 7.47 (d, J = 7.0 Hz, 2H), 7.00–6.98 (m, 4H), 6.96 (d, J = 7.1 Hz, 2H), 4.33 (s, 2H), 2.68 (s, 3H); 13C NMR (176 MHz, DMSO-d6) δ 168.28, 167.12, 165.49, 162.78, 159.80, 155.44, 151.97, 142.78, 140.82, 139.36, 134.66, 130.05, 129.06, 128.73, 119.53, 118.91, 117.88, 115.00, 36.26, 35.45, 31.24, 22.19; MS (m/z): exact mass calcd for C25H21N5O4S [M]+: 487.1. Found: 488.1. Anal. calcd for C25H21N5O4S: C, 61.59; H, 4.34; N, 14.37. Found: C, 62.2; H, 3.9; N, 13.27.
4.1.2.1 N-Butyl-4-(2-(3-methyl-2-oxoquinoxalin-1(2H)-yl)acetamido)benzamide 17a. White crystal (yield, 60%); mp = 279–281 °C; FT-IR (ν max, cm−1): 3429, 3318, 2910, 1647, 1601, 1530; 1H NMR (700 MHz, DMSO-d6) δ 10.68 (s, 1H), 8.33 (t, J = 5.6 Hz, 1H), 7.83–7.81 (m, 2H), 7.81–7.78 (m, 1H), 7.65–7.63 (m, 2H), 7.57 (ddd, J = 8.6, 7.1, 1.5 Hz, 1H), 7.52 (dd, J = 8.5, 1.2 Hz, 1H), 7.38 (ddd, J = 8.2, 7.1, 1.2 Hz, 1H), 5.16 (s, 2H), 3.24 (td, J = 7.1, 5.6 Hz, 2H), 2.49 (s, 3H), 1.50 (ddd, J = 8.6, 6.3, 1.9 Hz, 2H), 1.34–1.31 (m, 2H), 0.90 (t, J = 7.4 Hz, 3H); 13C NMR (176 MHz, DMSO-d6) δ 165.91, 165.67, 157.97, 154.85, 141.43, 133.46, 132.46, 130.19, 130.05, 129.27, 128.56, 123.93, 118.76, 115.19, 45.75, 39.28, 31.76, 21.59, 20.14, 14.21; MS (m/z): exact mass calcd for C22H24N4O3 [M]+: 392.2. Found: 392.2. Anal. calcd for C22H24N4O3: C, 67.33; H, 6.16; N, 14.28. Found: C, 67.72; H, 5.87; N, 13.38.
4.1.2.2 N-(3-Chlorophenyl)-4-(2-(3-methyl-2-oxoquinoxalin-1(2H)-yl)acetamido)benzamide 17b. Yellow crystal (yield, 65%); mp >300 °C; FT-IR (ν max, cm−1): 3429, 3318, 2910, 1640, 1603, 1524; 1H NMR (700 MHz, DMSO-d6) δ 10.80 (s, 1H), 10.31 (s, 1H), 7.98–7.96 (m, 3H), 7.81 (dd, J = 8.0, 1.5 Hz, 1H), 7.74–7.73 (m, 2H), 7.71–7.70 (m, 1H), 7.59–7.57 (m, 1H), 7.54 (dd, J = 8.5, 1.3 Hz, 1H), 7.40–7.37 (m, 2H), 7.16 (ddd, J = 8.0, 2.1, 0.9 Hz, 1H), 5.19 (s, 2H), 2.49 (s, 3H); 13C NMR (176 MHz, DMSO-d6) δ 165.85, 165.48, 157.97, 154.85, 142.25, 141.22, 133.47, 133.38, 132.47, 130.78, 130.20, 129.57, 129.33, 129.29, 123.95, 123.66, 120.11, 119.05, 118.87, 115.21, 45.80, 21.59; MS (m/z): exact mass calcd for C24H19ClN4O3 [M]+: 446.1. Found: 447.1. Anal. calcd for C24H19ClN4O3: C, 64.50; H, 4.29; N, 12.54. Found: C, 64.98; H, 4.05; N, 12.09.
4.1.2.3 N-(4-Hydroxyphenyl)-4-(2-(3-methyl-2-oxoquinoxalin-1(2H)-yl)acetamido)benzamide 17c. Yellowish white crystal (yield, 70%); mp >300 °C; FT-IR (ν max, cm−1): 3303, 3261, 2958, 1644, 1601, 1513; 1H NMR (700 MHz, DMSO-d6) δ 10.75 (s, 1H), 9.93 (s, 1H), 9.25 (s, 1H), 7.94 (d, J = 8.6 Hz, 2H), 7.70 (d, J = 8.5 Hz, 2H), 7.58–7.56 (m, 1H), 7.54–7.53 (m, 2H), 7.52 (d, J = 2.2 Hz, 2H), 7.38 (d, J = 7.4 Hz, 1H), 6.74–6.73 (m, 2H), 5.18 (s, 2H), 2.49 (s, 3H); 13C NMR (176 MHz, DMSO-d6) δ 165.75, 164.67, 157.97, 154.85, 154.08, 133.46, 132.47, 131.21, 130.28, 130.20, 129.28, 129.01, 123.94, 122.72, 118.81, 115.41, 115.20, 45.78, 21.59; MS (m/z): exact mass calcd for C24H20N4O4 [M]+: 428.1. Found: 429.1. Anal. calcd for C24H20N4O4: C, 67.28; H, 4.71; N, 13.08. Found: C, 67.08; H, 4.48; N, 12.87.
4.1.2.4 N-(2-Hydroxy-4-nitrophenyl)-4-(2-(3-methyl-2-oxoquinoxalin-1(2H)-yl)acetamido)benzamide 17d. Deep yellow crystal (yield, 70%); mp >300 °C; FT-IR (ν max, cm−1): 3353, 3261, 2958, 1711, 1667, 1597; 1H NMR (700 MHz, DMSO-d6) δ 10.47 (s, 1H), 10.13 (s, 1H), 9.70 (s, 1H), 8.42 (d, J = 8.9 Hz, 1H), 8.25–8.23 (m, 2H), 8.04 (d, J = 2.6 Hz, 2H), 7.94 (d, J = 3.9 Hz, 2H), 7.71 (d, J = 8.6 Hz, 2H), 7.56–7.53 (m, 2H), 4.94 (s, 2H), 1.24 (s, 3H); MS (m/z): exact mass calcd for C24H19N5O6 [M]+: 473.1. Found: 474.0. Anal. calcd for C24H19N5O6: C, 60.89; H, 4.05; N, 14.79. Found: C, 60.63; H, 3.56; N, 14.65.
4.1.2.5 N-(4-(2-(2-Hydroxybenzoyl)hydrazine-1-carbonyl)phenyl)-2-(3-methyl-2-oxoquinoxalin-1(2H)-yl)acetamide 18. Yellow powder (yield 70%); mp: 255–257 °C; FT-IR (ν max, cm−1): 3277, 3261, 2958, 1645, 1602, 1532; 1H NMR (700 MHz, DMSO-d6) δ 11.95 (s, 1H), 10.79–10.77 (m, 1H), 10.62 (s, 1H), 10.52 (d, J = 5.5 Hz, 1H), 7.81–7.80 (m, 2H), 7.72 (d, J = 8.7 Hz, 2H), 7.48–7.46 (m, 2H), 7.27 (d, J = 8.4 Hz, 1H), 7.17 (d, J = 7.6 Hz, 1H), 7.00–6.95 (m, 4H), 5.19 (s, 2H), 2.49 (d, J = 4.4 Hz, 3H); 13C NMR (176 MHz, DMSO-d6) δ 168.23, 167.57, 165.85, 159.79, 157.97, 154.85, 141.85, 134.64, 133.47, 132.47, 130.20, 129.28, 129.08, 128.74, 123.94, 122.15, 119.51, 118.99, 117.88, 115.21, 115.04, 68.33, 45.81, 21.59; MS (m/z): exact mass calcd for C25H21N5O5 [M]+: 471.2. Found: 472.3. Anal. calcd for C25H21N5O5: C, 63.69; H, 4.49; N, 14.85. Found: C, 63.09; H, 4.41; N, 14.47.
4.2 Biological testing
4.3 In silico studies
Conflicts of interest
There is no conflict of interest. Many thanks for Dr Mohamed R. Elnagar, Department of Pharmacology and Toxicology, Faculty of Pharmacy, Al-Azhar University, Cairo, Egypt for his valuable technical assistance.Acknowledgements
The authors extend their appreciation to the Deanship of Scientific Research at King Saud University for funding this work through research group no (RG-1441-333).References
- G. H. Williams and K. Stoeber, J. Pathol., 2012, 226, 352–364 CrossRef CAS PubMed.
- K. Collins, T. Jacks and N. P. Pavletich, Proc. Natl. Acad. Sci. U. S. A., 1997, 94, 2776–2778 CrossRef CAS PubMed.
- A. Bennasroune, A. Gardin, D. Aunis, G. Crémel and P. Hubert, Crit. Rev. Oncol. Hematol., 2004, 50, 23–38 CrossRef PubMed.
- M. K. Paul and A. K. Mukhopadhyay, Int. J. Med. Sci., 2004, 1, 101–115 CrossRef CAS PubMed.
- C. J. Peach, V. W. Mignone, M. A. Arruda, D. C. Alcobia, S. J. Hill, L. E. Kilpatrick and J. Woolard, Int. J. Mol. Sci., 2018, 19, 1264 CrossRef PubMed.
- C. S. Abhinand, R. Raju, S. J. Soumya, P. S. Arya and P. R. Sudhakaran, Cell Commun. Signaling, 2016, 10, 347–354 CrossRef PubMed.
- G. Niu and X. Chen, Curr. Drug Targets, 2010, 11, 1000–1017 CrossRef CAS PubMed.
- J. J. Bower, L. D. Vance, M. Psioda, S. L. Smith-Roe, D. A. Simpson, J. G. Ibrahim, K. A. Hoadley, C. M. Perou and W. K. Kaufmann, npj Breast Cancer, 2017, 3, 9 CrossRef PubMed.
- L. Huang, Z. Huang, Z. Bai, R. Xie, L. Sun and K. Lin, Future Med. Chem., 2012, 4, 1839–1852 CrossRef CAS PubMed.
- S. Tugues, S. Koch, L. Gualandi, X. Li and L. Claesson-Welsh, Mol. Aspects Med., 2011, 32, 88–111 CrossRef CAS PubMed.
- M. M. Maile, E. Y. T. Wong, D. Suzin, N. E. Birrer and R. T. Penson, in Anti-Angiogenesis Drug Discovery and Development, ed. R. Atta ur and M. I. Choudhary, Elsevier, 2014, pp. 191–215, DOI:10.1016/B978-0-12-803963-2.50006-5.
- G. M. Keating and A. Santoro, Drugs, 2009, 69, 223–240 CrossRef CAS PubMed.
- S. M. Wilhelm, J. Dumas, L. Adnane, M. Lynch, C. A. Carter, G. Schütz, K. H. Thierauch and D. Zopf, Int. J. Cancer, 2011, 129, 245–255 CrossRef CAS PubMed.
- K. Okamoto, M. Ikemori-Kawada, A. Jestel, K. von König, Y. Funahashi, T. Matsushima, A. Tsuruoka, A. Inoue and J. Matsui, ACS Med. Chem. Lett., 2015, 6, 89–94 CrossRef CAS PubMed.
- F. M. Yakes, J. Chen, J. Tan, K. Yamaguchi, Y. Shi, P. Yu, F. Qian, F. Chu, F. Bentzien, B. Cancilla, J. Orf, A. You, A. D. Laird, S. Engst, L. Lee, J. Lesch, Y. C. Chou and A. H. Joly, Mol. Cancer Ther., 2011, 10, 2298–2308 CrossRef CAS PubMed.
- A. De Luca and N. Normanno, IDrugs, 2010, 13, 636–645 CAS.
- E. Cabebe and H. Wakelee, Drugs of today, Barcelona, Spain, 2006, vol. 42, pp. 387–398 Search PubMed.
- Y. Liu and N. S. Gray, Nat. Chem. Biol., 2006, 2, 358–364 CrossRef CAS PubMed.
- M. M. Ghorab, M. S. Alsaid, A. M. Soliman and F. A. Ragab, J. Enzyme Inhib. Med. Chem., 2017, 32, 893–907 CrossRef CAS PubMed.
- M. Montana, V. Montero, O. Khoumeri and P. Vanelle, Molecules, 2020, 25, 2784 CrossRef CAS PubMed.
- M. Montana, F. Mathias, T. Terme and P. Vanelle, Eur. J. Med. Chem., 2019, 163, 136–147 CrossRef CAS PubMed.
- E. M. Abbass, A. K. Khalil, M. M. Mohamed, I. H. Eissa and A. M. El-Naggar, Bioorg. Chem., 2020, 104, 104255 CrossRef CAS PubMed.
- M. A. Naylor, M. A. Stephens, J. Nolan, B. Sutton, J. H. Tocher, E. M. Fielden, G. E. Adams and I. J. Stratford, Anti-Cancer Drug Des., 1993, 8, 439–461 CAS.
- T. H. Corbett, P. Lorusso, L. Demchick, C. Simpson, S. L. Pugh, K. White, J. Kushner, L. L. Polín, J. A. Meyer, J. Czarnecki, L. K. Heilbrun, J. P. Horwitz, J. L. Gross, C. H. Behrens, B. A. Harrison, R. J. Mcripley and G. L. Trainor, Invest. New Drugs, 2004, 16, 129–139 CrossRef PubMed.
- H. A. Mahdy, M. K. Ibrahim, A. M. Metwaly, A. Belal, A. B. M. Mehany, K. M. A. El-Gamal, A. El-Sharkawy, M. A. Elhendawy, M. M. Radwan, M. A. Elsohly and I. H. Eissa, Bioorg. Chem., 2020, 94, 103422 CrossRef CAS PubMed.
- A.-G. A. El-Helby, H. Sakr, I. H. Eissa, A. A. Al-Karmalawy and K. El-Adl, Arch. Pharm., 2019, 352, 1900178 CrossRef CAS PubMed.
- A.-G. A. El-Helby, H. Sakr, I. H. Eissa, H. Abulkhair, A. A. Al-Karmalawy and K. El-Adl, Arch. Pharm., 2019, 352, 1900113 CrossRef CAS PubMed.
- N. A. Alsaif, M. A. Dahab, M. M. Alanazi, A. J. Obaidullah, A. A. Al-Mehizia, M. M. Alanazi, S. Aldawas, H. A. Mahdy and H. Elkady, Bioorg. Chem., 2021, 110, 104807 CrossRef CAS PubMed.
- M. A. El-Zahabi, H. Sakr, K. El-Adl, M. Zayed, A. S. Abdelraheem, S. I. Eissa, H. Elkady and I. H. Eissa, Bioorg. Chem., 2020, 104, 104218 CrossRef CAS PubMed.
- S. A. El-Metwally, M. M. Abou-El-Regal, I. H. Eissa, A. B. Mehany, H. A. Mahdy, H. Elkady, A. Elwan and E. B. Elkaeed, Bioorg. Chem., 2021, 112, 104947 CrossRef CAS PubMed.
- A.-G. A. El-Helby, H. Sakr, R. R. Ayyad, H. A. Mahdy, M. M. Khalifa, A. Belal, M. Rashed, A. El-Sharkawy, A. M. Metwaly and M. A. Elhendawy, Bioorg. Chem., 2020, 103, 104233 CrossRef CAS PubMed.
- W. M. Eldehna, M. F. Abo-Ashour, A. Nocentini, P. Gratteri, I. H. Eissa, M. Fares, O. E. Ismael, H. A. Ghabbour, M. M. Elaasser and H. A. Abdel-Aziz, Eur. J. Med. Chem., 2017, 139, 250–262 CrossRef CAS PubMed.
- M. S. T. Nawaf, A. Alsaif, M. M. Alanazi, A. J. Obaidullah, A. A. Al-Mehizia, M. M. Alanazi, S. Aldawas, A. Elwan and H. Elkady, J. Enzyme Inhib. Med. Chem., 2021, 36, 1093–1114 CrossRef PubMed.
- M. M. Alanazi, H. A. Mahdy, N. A. Alsaif, A. J. Obaidullah, H. M. Alkahtani, A. A. Al-Mehizia, S. M. Alsubaie, M. A. Dahab and I. H. Eissa, Bioorg. Chem., 2021, 112, 104949 CrossRef CAS PubMed.
- V. A. Machado, D. Peixoto, R. Costa, H. J. Froufe, R. C. Calhelha, R. M. Abreu, I. C. Ferreira, R. Soares and M. J. Queiroz, Bioorg. Med. Chem., 2015, 23, 6497–6509 CrossRef CAS PubMed.
- V. A. Machado, D. Peixoto, R. Costa, H. J. C. Froufe, R. C. Calhelha, R. M. V. Abreu, I. C. F. R. Ferreira, R. Soares and M.-J. R. P. Queiroz, Bioorg. Med. Chem., 2015, 23, 6497–6509 CrossRef CAS PubMed.
- J. Dietrich, C. Hulme and L. H. Hurley, Bioorg. Med. Chem., 2010, 18, 5738–5748 CrossRef CAS PubMed.
- G. W. H. Cheeseman, R. F. Cookson, Chemistry of Heterocyclic Compounds, ed. A. weissberger and E. C. Taylor, 1979, pp. 1–6, DOI:10.1002/9780470187333.ch1.
- D. Aparicio, O. A. Attanasi, P. Filippone, R. Ignacio, S. Lillini, F. Mantellini, F. Palacios and J. M. de Los Santos, J. Org. Chem., 2006, 71, 5897–5905 CrossRef CAS PubMed.
- M. Piltan, J. Chem. Res., 2017, 41, 712–714 CrossRef CAS.
- J. Gris, R. Glisoni, L. Fabian, B. Fernández and A. G. Moglioni, Tetrahedron Lett., 2008, 49, 1053–1056 CrossRef CAS.
- J. Cai, J. Zou, X. Pan and W. Zhang, Tetrahedron Lett., 2008, 49, 7386–7390 CrossRef CAS.
- Y. V. D. Nageswar, K. H. V. Reddy, K. Ramesh and S. N. Murthy, Org. Prep. Proced. Int., 2013, 45, 1–27 CrossRef CAS.
- M. M. Alanazi, H. A. Mahdy, N. A. Alsaif, A. J. Obiadullah, H. M. Alkahtani, A. A. Al-Mehizia, S. M. Alsubaie, M. A. Dahab and I. H. Eissa, Bioorg. Chem., 2021, 104949 CrossRef CAS PubMed.
- M.-K. Ibrahim, A. A. Abd-Elrahman, R. R. Ayyad, K. El-Adl, A. M. Mansour and I. H. Eissa, Bulletin of Faculty of Pharmacy, Cairo University, 2013, vol. 51, pp. 101–111 Search PubMed.
- T. Mosmann, J. Immunol. Methods, 1983, 65, 55–63 CrossRef CAS PubMed.
- F. Denizot and R. Lang, J. Immunol. Methods, 1986, 89, 271–277 CrossRef CAS PubMed.
- M. Thabrew, R. D. Hughes and I. G. Mcfarlane, J. Pharm. Pharmacol., 1997, 49, 1132–1135 CrossRef CAS PubMed.
- P. O. Seglen, Methods Cell Biol., 1976, 13, 29–83 CrossRef CAS PubMed.
- J. Wang and M. J. Lenardo, J. Cell Sci., 2000, 113, 753–757 CrossRef CAS PubMed.
- J. Dietrich, C. Hulme and L. H. Hurley, Bioorg. Med. Chem., 2010, 18, 5738–5748 CrossRef CAS PubMed.
- X. Xia, E. G. Maliski, P. Gallant and D. Rogers, J. Med. Chem., 2004, 47, 4463–4470 CrossRef CAS PubMed.
- BIOVIA, QSAR, ADMET and Predictive Toxicology, https://www.3dsbiovia.com/products/collaborative-science/biovia-discovery-studio/qsar-admet-and-predictive-toxicology.html, accessed May 2020 Search PubMed.
- I. H. Eissa, A. M. El-Naggar, N. E. El-Sattar and A. S. Youssef, Anti-Cancer Agents Med. Chem., 2018, 18, 195–209 CrossRef CAS PubMed.
- C. Hansch, J. Björkroth and A. Leo, J. Pharm. Sci., 1987, 76, 663–687 CrossRef CAS PubMed.
- M. A. H. F. F. Utilizing, J. Am. Chem. Soc., 1977, 99, 8127–8134 CrossRef.
- Y. Liang, Q.-S. Xu, H.-D. Li and D.-S. Cao, Support Vector Machines and their Application in Chemistry and Biotechnology, CRC Press, 2016 Search PubMed.
- H. C. Ansel, N. G. Popovich and L. V. Allen, Pharmaceutical Dosage Forms and Drug Delivery Systems, Williams & Wilkins, Baltimore, 1995 Search PubMed.
- E. Barim and F. Akman, J. Mol. Struct., 2019, 1195, 506–513 CrossRef CAS.
- G. Bitencourt-Ferreira and W. F. de Azevedo Junior, Curr. Med. Chem., 2021, 28(24), 4954–4971 CrossRef CAS PubMed.
- G. Náray-Szabó, J. Mol. Recognit., 1993, 6, 205–210 CrossRef PubMed.
- R. Rohs, S. M. West, A. Sosinsky, P. Liu, R. S. Mann and B. Honig, Nature, 2009, 461, 1248–1253 CrossRef CAS PubMed.
- A. J. McCoy, V. C. Epa and P. M. Colman, J. Mol. Biol., 1997, 268, 570–584 CrossRef CAS PubMed.
- M. M. Matin, M. S. Hasan, M. Uzzaman, M. M. H. Bhuiyan, S. M. Kibria, M. E. Hossain and M. H. Roshid, J. Mol. Struct., 2020, 1222, 128821 CrossRef CAS.
- I. H. Eissa, A.-G. A. El-Helby, H. A. Mahdy, M. M. Khalifa, H. A. Elnagar, A. B. Mehany, A. M. Metwaly, M. A. Elhendawy, M. M. Radwan and M. A. ElSohly, Bioorg. Chem., 2020, 104380 CrossRef CAS PubMed.
- M. Ibrahim, M. Taghour, A. M. Metwaly, A. Belal, A. Mehany, M. Elhendawy, M. Radwan, A. Yassin, N. El-Deeb and E. Hafez, Eur. J. Med. Chem., 2018, 155, 117–134 CrossRef CAS PubMed.
- D. R. Romer, J. Heterocycl. Chem., 2009, 46, 317–319 CrossRef CAS.
- R. Sarges, H. R. Howard, R. G. Browne, L. A. Lebel, P. A. Seymour and B. K. Koe, J. Med. Chem., 1990, 33, 2240–2254 CrossRef CAS PubMed.
- S. T. Al-Rashood, A. R. Hamed, G. S. Hassan, H. M. Alkahtani, A. A. Almehizia, A. Alharbi, M. M. Al-Sanea and W. M. Eldehna, J. Enzyme Inhib. Med. Chem., 2020, 35, 831–839 CrossRef CAS PubMed.
- R. S. Ismail, S. M. Abou-Seri, W. M. Eldehna, N. S. Ismail, S. M. Elgazwi, H. A. Ghabbour, M. S. Ahmed, F. T. Halaweish and D. A. Abou El Ella, Eur. J. Med. Chem., 2018, 155, 782–796 CrossRef CAS PubMed.
- S. M. Abou-Seri, W. M. Eldehna, M. M. Ali and D. A. Abou El Ella, Eur. J. Med. Chem., 2016, 107, 165–179 CrossRef CAS PubMed.
- I. H. Eissa, A.-G. A. El-Helby, H. A. Mahdy, M. M. Khalifa, H. A. Elnagar, A. B. Mehany, A. M. Metwaly, M. A. Elhendawy, M. M. Radwan and M. A. ElSohly, Bioorg. Chem., 2020, 105, 104380 CrossRef CAS PubMed.
- W. M. Eldehna, G. S. Hassan, S. T. Al-Rashood, T. Al-Warhi, A. E. Altyar, H. M. Alkahtani, A. A. Almehizia and H. A. Abdel-Aziz, J. Enzyme Inhib. Med. Chem., 2019, 34, 322–332 CrossRef CAS PubMed.
- K. K.-W. Lo, T. K.-M. Lee, J. S.-Y. Lau, W.-L. Poon and S.-H. Cheng, Inorg. Chem., 2008, 47, 200–208 CrossRef CAS PubMed.
- A. Sabt, O. M. Abdelhafez, R. S. El-Haggar, H. M. Madkour, W. M. Eldehna, E. E.-D. A. El-Khrisy, M. A. Abdel-Rahman and L. A. Rashed, J. Enzyme Inhib. Med. Chem., 2018, 33, 1095–1107 CrossRef CAS PubMed.
- A. Balah, O. Ezzat and E.-S. Akool, Int. Immunopharmacol., 2018, 65, 493–502 CrossRef CAS PubMed.
- N. M. Aborehab, M. R. Elnagar and N. E. Waly, J. Biochem. Mol. Toxicol., 2020, e22638 Search PubMed.
- M. R. Elnagar, A. B. Walls, G. K. Helal, F. M. Hamada, M. S. Thomsen and A. A. Jensen, Eur. J. Pharmacol., 2018, 826, 106–113 CrossRef CAS PubMed.
- A. G. A. El-Helby, R. R. Ayyad, H. M. Sakr, A. S. Abdelrahim, K. El-Adl, F. S. Sherbiny, I. H. Eissa and M. M. Khalifa, J. Mol. Struct., 2017, 1130, 333–351 CrossRef CAS.
- A. A. Nasser, I. H. Eissa, M. R. Oun, M. A. El-Zahabi, M. S. Taghour, A. Belal, A. M. Saleh, A. B. Mehany, H. Luesch and A. E. Mostafa, Org. Biomol. Chem., 2020, 18, 7608–7634 RSC.
- A. M. El-Naggar, I. H. Eissa, A. Belal and A. A. El-Sayed, RSC Adv., 2020, 10, 2791–2811 RSC.
- M. Hagras, M. A. El Deeb, H. S. Elzahabi, E. B. Elkaeed, A. B. Mehany and I. H. Eissa, J. Enzyme Inhib. Med. Chem., 2021, 36, 640–658 CrossRef CAS PubMed.
- M. A. El-Zahabi, E. R. Elbendary, F. H. Bamanie, M. F. Radwan, S. A. Ghareib and I. H. Eissa, Bioorg. Chem., 2019, 91, 103115 CrossRef CAS PubMed.
- M. K. Ibrahim, I. H. Eissa, M. S. Alesawy, A. M. Metwaly, M. M. Radwan and M. A. ElSohly, Bioorg. Med. Chem., 2017, 25, 4723–4744 CrossRef CAS PubMed.
- A. El-Demerdash, A. M. Metwaly, A. Hassan, A. El-Aziz, T. Mohamed, E. B. Elkaeed, I. H. Eissa, R. K. Arafa and J. D. Stockand, Biomolecules, 2021, 11, 460 CrossRef CAS PubMed.
- K. M. El-Gamal, A. M. El-Morsy, A. M. Saad, I. H. Eissa and M. Alswah, J. Mol. Struct., 2018, 1166, 15–33 CrossRef CAS.
- I. H. Eissa, M. A. Dahab, M. K. Ibrahim, N. A. Alsaif, A. Alanazi, S. I. Eissa, A. Belal and A. M. Beauchemin, Bioorg. Chem., 2021, 104965 CrossRef CAS PubMed.
- M. M. Alanazi, I. H. Eissa, N. A. Alsaif, A. J. Obaidullah, W. A. Alanazi, A. F. Alasmari, H. Albassam, H. Elkady and A. Elwan, J. Enzyme Inhib. Med. Chem., 2021, 36, 1760–1782 CrossRef CAS PubMed.
Footnote |
| † Electronic supplementary information (ESI) available. See DOI: 10.1039/d1ra05925d |
| This journal is © The Royal Society of Chemistry 2021 |

