
 Open Access Article
 This Open Access Article is licensed under a Creative Commons Attribution-Non Commercial 3.0 Unported Licence
Confinement of molecular materials using a solid-state loading method: a route for exploring new physical states and their subsequent transformation highlighted by caffeine confined to SBA-15 pores†
Yannick Guinet,
Laurent Paccou,
Florence Danède and
Alain Hédoux *
*
Univ. Lille, CNRS, INRAE, Centrale Lille, UMR 8207 – UMET – Unité Matériaux et Transformations, F-59000 Lille, France. E-mail: alain.hedoux@univ-lille.fr
First published on 26th October 2021
Abstract
Using the innovative solid-state loading (milling-assisted loading, MAL) method to confine caffeine to cylindrical pores (SBA-15, ∅ = 6 nm) gives the opportunity to explore the original physical states of caffeine and their subsequent transformation using low-frequency Raman spectroscopy, powder X-ray diffraction and microcalorimetry investigations. It was shown that MAL makes possible the loading of the selected form in the polymorphism of caffeine. While form II has similar structural and dynamics properties in confined and bulk forms, the confined rotator phase (form I) exhibits clear differences with the bulk form inherent to its orientational disorder. Interestingly, the two confined forms of caffeine undergo an exothermic disordering transformation upon heating into a physical state at the border between a nanocrystallized orientationally disordered phase and an amorphous state, not existing in the bulk form. The melting of this new physical state was observed at 150 °C, i.e. 85 degrees below the melting temperature of the bulk form I, thus demonstrating the confinement of caffeine. It was also found that the liquid confined to pores of 6 nm mean diameter recrystallizes upon cooling, which can be explained by the very disordered nature of the recrystallized state.
1. Introduction
The caffeine (CAF) molecule, plotted in Fig. S1 in the ESI,† has very broad use in the food and pharmaceutical domains acting as an excipient or active pharmaceutical ingredient (API).1 Anhydrous CAF is an original enantiotropic system composed of two polymorphic forms.2 The Gibbs diagram is plotted in Fig. S2 in the ESI.† Form II (CAF-II) is the commercial and stable crystalline form at room temperature which transforms into an orientationally disordered form I (CAF-I) upon heating at 153 °C.3 In this high-temperature phase, also named the rotator phase, molecules are continuously rotating around their 6-fold molecular axis.4 Despite this orientational molecular disorder, the powder X-ray diffraction (PXRD) pattern of CAF-I is composed of narrow Bragg peaks just reflecting the periodicity of the molecular mass centers in a hexagonal lattice,5,6 since there is no periodicity of atomic positions. Diffraction patterns of CAF-I and CAF-II are plotted in Fig. S3 in the ESI,† and unit cells are shown in Fig. S4.† By contrast, the low-frequency Raman spectrum (LFRS) of CAF-I is similar to the spectrum of the amorphous state, i.e. composed of a simple very broad band reflecting the vibrational density of states (VDOS). In the rotator phases, the LFRS mainly results from the inhomogeneous broadening of phonons associated with molecular librations. Low-frequency spectra of both forms are plotted in Fig. S5 in the ESI.† From a dynamics point of view, rotator phases are generally considered as undercooled liquids,7,8 that is confirmed by comparing LFRS of CAF-I and the liquid state (Fig. S5†). Upon cooling below 153 °C CAF-I can be maintained in a very slowly relaxing metastable situation at room temperature,4 the CAF-I → CAF-II transformation being very hindered below 90 °C.CAF was frequently associated with conformers to prepare cocrystals9 for enhancing caffeine solubility, as for other APIs in order to improve the bioavailability of poorly soluble compounds in crystalline forms.10 Another strategy to address this issue is the confinement of drugs within mesoporous silica (MPS).11–13 During the two last decades,13 the analyzes of MPS as drug delivery systems were strongly developed,14 since these inorganic carriers make possible drug stabilization in a more soluble amorphous or nanocrystallized state, and provide an efficient protection of drugs against physiological barriers. Additionally, nanoconfinement gives the opportunity to manipulate the crystalline state of pharmaceuticals15 in order to optimize their properties.16 However, most of loading methods are based on drug adsorption by capillarity of API solution (wet impregnation method) or melt API, inducing either the use of toxic organic solvents or chemical degradation for high Tm APIs. The recent development of the solid-state loading (milling-assisted loading, MAL) method17 by the authors allows to overcome this obstacle, by comilling MPS and APIs with desired APIs dosage if lower than wt 40%. It was shown that milling doesn't destroy the pore architecture, only reducing the grain size of MPS.17 Interestingly, MAL method makes crystallization within pores possible18 from preexisting nuclei bypassing the nucleation process, not possible from a solution or from a melt. This gives the opportunity to explore new routes for achieving original physical states characterized by stability strongly dependent on the geometrical geometry. This paper focuses on the analysis of anhydrous CAF confined in SBA-15 via MAL method. Two types of composites were obtained by co-milling wt 65% of SBA-15 with either wt 35% of CAF-I or wt 35% of CAF-II. This API concentration was chosen to ensure the total filling of SBA-15 by the maximal load of CAF (<wt 40%).17
2. Experimental
2.1. Material
In this study, SBA-15 purchased from Sigma-Aldrich was used as MPS. This mesoporous matrix is characterized by a porous volume Vp = 0.72 cm3 g−1 and an average pore size Dp = 6 nm determined from N2 adsorption–desorption isotherms using the Barrett–Joyner–Halenda (BJH) calculation on the adsorption branch. The distribution of pore diameter is plotted in Fig. S6 in ESI.† Caffeine (CAF), purchased from Acros Organics (purity 99.8%) and used without further purification as model API in API:SBA-15 composites.2.2. Methods
Low-frequency Raman spectra (LFRS) were collected using a high-resolution Raman XY-Dilor spectrometer to analyze the non-polarized back-scattered light. The spectrometer is composed of a double monochromator comprising four mirrors characterized by a focal length of 800 mm, and a spectrograph. The choice of experimental conditions (incident radiation, entrance and exit slit width opened at 200 μm) gives a spectral resolution of about 1 cm−1 in the 5–150 cm−1 region, and allows the rejection of exciting light (the 660 nm line of a solid diode laser) down to 5 cm−1. The spectrometer is equipped with a liquid nitrogen cooled charge coupled device detector. The high sensitivity of the detector and the large analyzed scattered volume (∼0.5 cm3) allow us to record low-frequency Raman spectra in the 5–150 cm−1 range in 60 seconds. Powder samples were loaded in spherical pyrex cells hermetically sealed. The temperature of sample was regulated using an Oxford nitrogen flux device that keeps temperature fluctuations within 0.1 °C. Spectra were collected during heating ramps at 1 °C min−1 with an acquisition time of 60 seconds allowing to collect 1 spectrum per degree.The analysis of LFRS of disordered molecular materials, consisting to transform raw data (IRaman(ω,T)), in Raman susceptibility (χ′′(ω)) via the reduced intensity (Ir(ω)), is shown in Fig. S5 in ESI† and widely described for other molecular systems.19
X-Ray diffraction was performed on as-received powder CAF and CAF:SBA-15 composites using a Panalytical X'pert PRO MPD diffractometer. The Debye–Scherrer geometry was used, operating with the CuKα1,2 radiation selected by a hybrid monochromator. The Lindemann glass capillary (∅ = 0.7 mm) mounted at the center of the goniometer circle was rotating about the horizontal axis during the data collection in order to ensure the proper averaging over the individual crystallites. Composites were heated in a Huber HTC 9634 furnace composed of a Kapton window giving a diffuse intensity to the diffraction pattern below 2θ = 7°. Consequently, PXRD patterns were collected in the 8–35° 2θ-range.
Micro calorimetry experiments were carried out using a very sensitive microcalorimeter (Micro DSC III, Setaram) using the 3-dimensional sensor technology. Masses of 110 mg of CAF-I (wt 35%):SBA-15 and 150 mg of CAF-II (wt 35%):SBA-15 composites were input in one furnace, and a similar mass of alumina was input in the second furnace. Both furnaces were hermetically closed. The calorimeter head was flushed with highly pure nitrogen gas during measurements. Two successive heating runs from 0 up to 180 °C at 1 °C min−1 of freshly prepared composites were carried out. This scanning rate was selected in order to analyze Raman and thermal data collected with the scanning rate.
3. Results and discussion
3.1. Analysis of the physical state of composites at room temperature
The two composites freshly prepared with CAF-I and CAF-II were firstly analyzed by X-ray diffraction and low-frequency Raman spectroscopy at room temperature. PXRD patterns and LFRS of CAF-I and CAF-II in bulk forms obtained in studies previously published20,21 are plotted in Fig. S3 and S5 in ESI.† These data were used to describe the physical state of confined CAF with respect to CAF-I and CAF-II in bulk form. PXRD patterns of CAF-I:SBA-15 and CAF-II:SBA-15 directly collected after MAL are plotted in Fig. 1a with patterns of the capillary tube and SBA-15 within the capillary tube. Given that CAF-I and CAF-II can be identified in the 10–13° 2θ-range, and both capillary tube and SBA-15 give no contribution in this in the 2θ-window, PXRD of confined CAF-I and CAF-II are compared to bulk forms in this 10–13° 2θ-region in Fig. 1b. Fig. 1a and b highlight a significant broadening of Bragg peaks of confined CAF-I, while Bragg peaks of bulk CAF-II are slightly broadened within the pores. The strong broadening of the narrow Bragg peak (111) of CAF-I can be analyzed from the Scherrer equation:22Lhkl = 0.9λ/(FWHM(2θ)cos![[thin space (1/6-em)]](https://www.rsc.org/images/entities/char_2009.gif) θ) θ) |
 | ||
| Fig. 1 PXRD patterns at room temperature of CAF-I and CAF-II confined by MAL in SBA-15 mesoporous silica; (a) in the 8–30 2θ-range; (b) in the 10–13 2θ-range compared with bulk forms of CAF-I and CAF-II. | ||
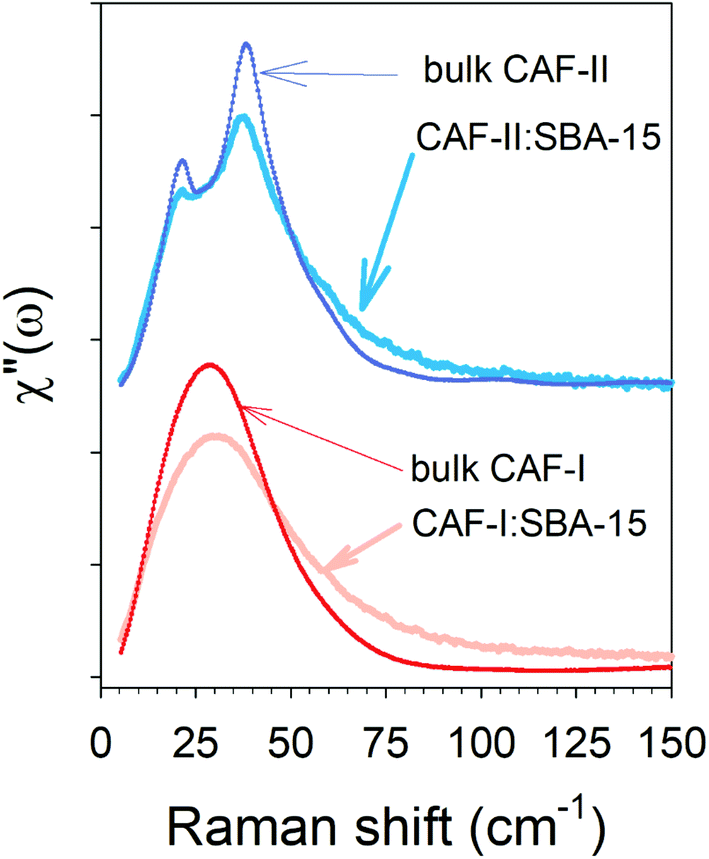 | ||
| Fig. 2 Raman susceptibility representation of LFRS at room temperature of CAF-I and CAF-II confined by MAL in SBA-15 mesoporous silica, compared with bulk forms of CAF-I and CAF-II. | ||
3.2. Analysis of the physical stability of composites upon heating
The two types of freshly prepared composites were firstly analyzed by microcalorimetry upon two successive heating runs. The first run was performed from 0 up to 180 °C at 1 °C min−1, and the second was performed in the same conditions after cooling the sample at 1 °C min−1 and a stabilization period of 30 min. Heat flow curves are plotted in Fig. 3a for CAF-I:SBA-15 and in Fig. 3b for CAF-II:SBA-15. Each first heating run exhibits two thermodynamic features corresponding to a smooth exothermic transformation (Cp-decrease) spanning more than 50 °C from 35 to 90 °C, followed by a drastic Cp-increase ending by an endotherm around 150 °C. In the second heating run, the initial value of Cp has increased (significantly greater for CAF-II) and the first exothermic feature is no more observed. Only the endotherm is observed but slightly shifted toward the high temperatures. The Cp-change between the beginnings of the two successive heating runs indicates a more disordered state of CAF molecules after the first heating, and the molecular disordering is more important starting from CAF-II. LFRS was mainly used for describing the transformations of CAF organizations associated with these thermodynamic features, since the Raman signal is essentially resulting from the light scattered by CAF molecules.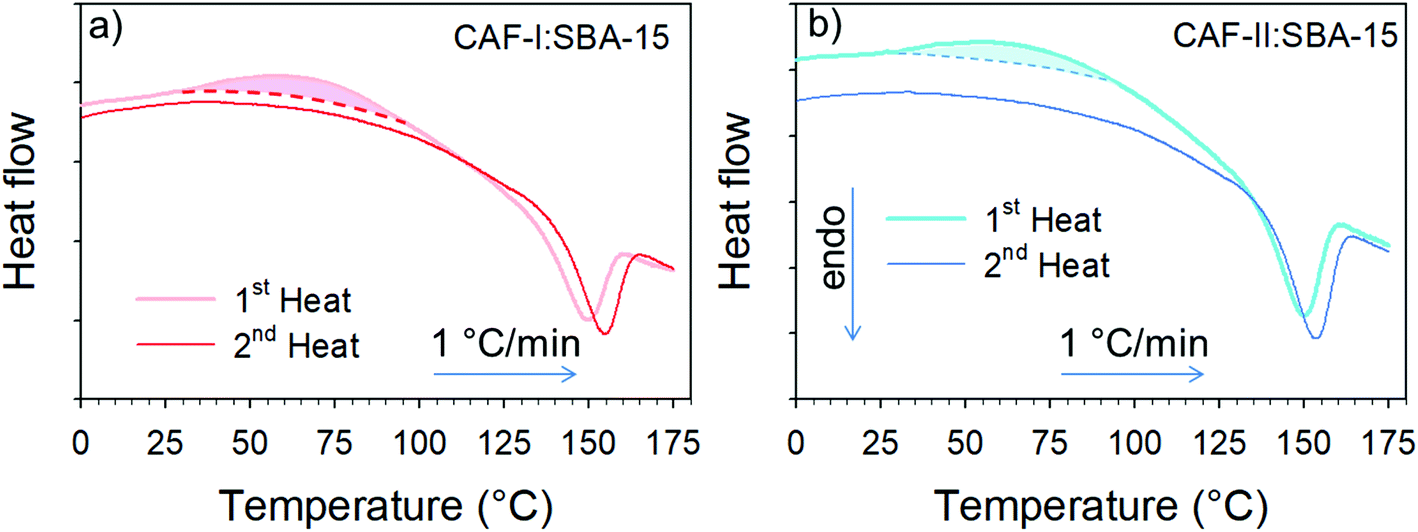 | ||
| Fig. 3 Heat flow traces corresponding to two successive heating runs of freshly prepared composites (a) CAF-I confined by MAL; (b) CAF-II confined by MAL. | ||
In a first step, the exothermic transformation was firstly analyzed by plotting the temperature dependence of low-frequency spectra in the reduced intensity representation (Ir(ω)) in Fig. 4a and b for the CAF-I:SBA-15 and CAF-II:SBA-15 composites respectively.
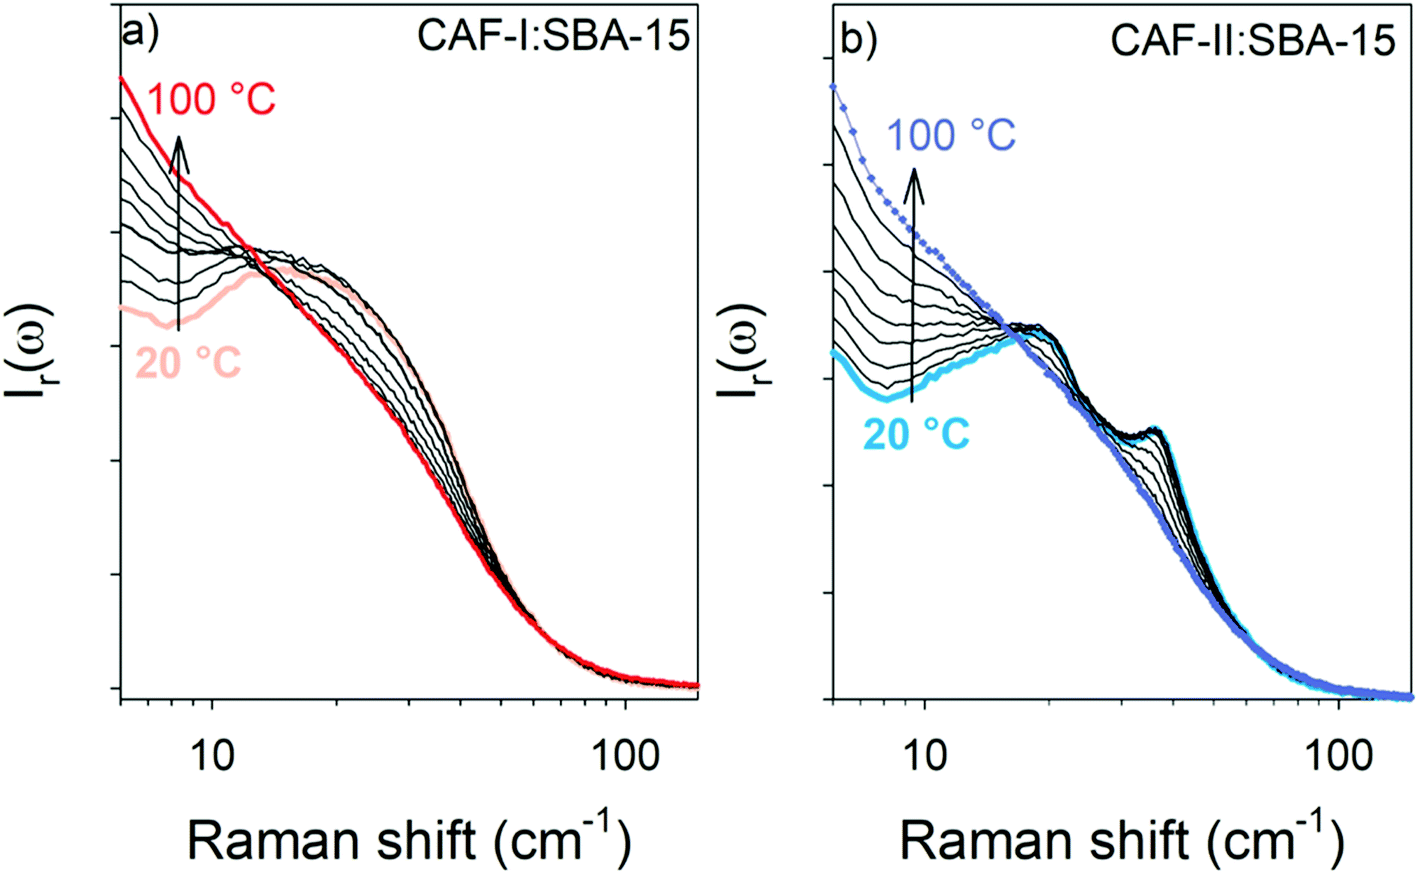 | ||
| Fig. 4 Ir(ω)-spectra collected during a first heating ramp at 1 °C min−1 of freshly prepared composites plotted by step of 10 °C in the 20–100 °C range corresponding to the first exothermic transformation; spectra of (a) CAF-I:SBA-15 (b) CAF-II:SBA-15. The arrows show the increase of the quasielastic intensity highlighting the disordering nature of the exothermic transformation. A logarithm ω-scale was used for a clear representation of spectral changes at very low-frequencies. | ||
Both figures show the increase of the quasielastic intensity, and a transformation of the vibrational band-shape above 15 cm−1. Fig. 4a shows that the increase of the quasielastic intensity below 15 cm−1, corresponding to fast relaxational motions, is accompanied with a flattening of the single-component band-shape above 15 cm−1. It is observed in Fig. 4b that the two-component band-shape, distinctive of CAF-II, is continuously transforming into a broad band, mimicking that observed in the spectrum of CAF-I:SBA-15. Obviously, Fig. 4b shows the exothermic transformation of confined CAF-II into a more disordered state. Fig. 5a and b present the comparison between the two composites after the first transformation (at 100 °C) analyzed by LFRS and PXRD respectively. These figures show that the LFRS and the PXRD in the 9–15 2θ region of CAF-I:SBA-15 and CAF-II:SBA-15 become similar at 100 °C, indicating that CAF molecules are in the same physical state at 100 °C regardless of the form initially loaded in the MPS matrix. The inset of each Fig. 5a and b provides a comparison between molecular organizations in confined CAF-I at room temperature and at 100 °C from the analyzes of χ′′(ω)-spectra and PXRD data. In both cases, the differences between spectra or Bragg peaks are only induced by the thermal expansion inherent to the temperature change. No change in the molecular organizations in confined CAF-I can be detected by LFRS and PXRD, indicating that the exothermic transformation revealed in Fig. 3a is just associated with a change in the relaxational dynamics of CAF molecules, and corresponds to the transformation of CAF-I into CAF-I′ distinguished from CAF-I, just by its molecular dynamics. The exothermic transformation of CAF-II:SBA-15 composite can be described as the transformation of CAF-II into CAF-I′ under confinement, probably similar to the polymorphic transformation between bulk CAF-I and bulk CAF-II at 153 °C.
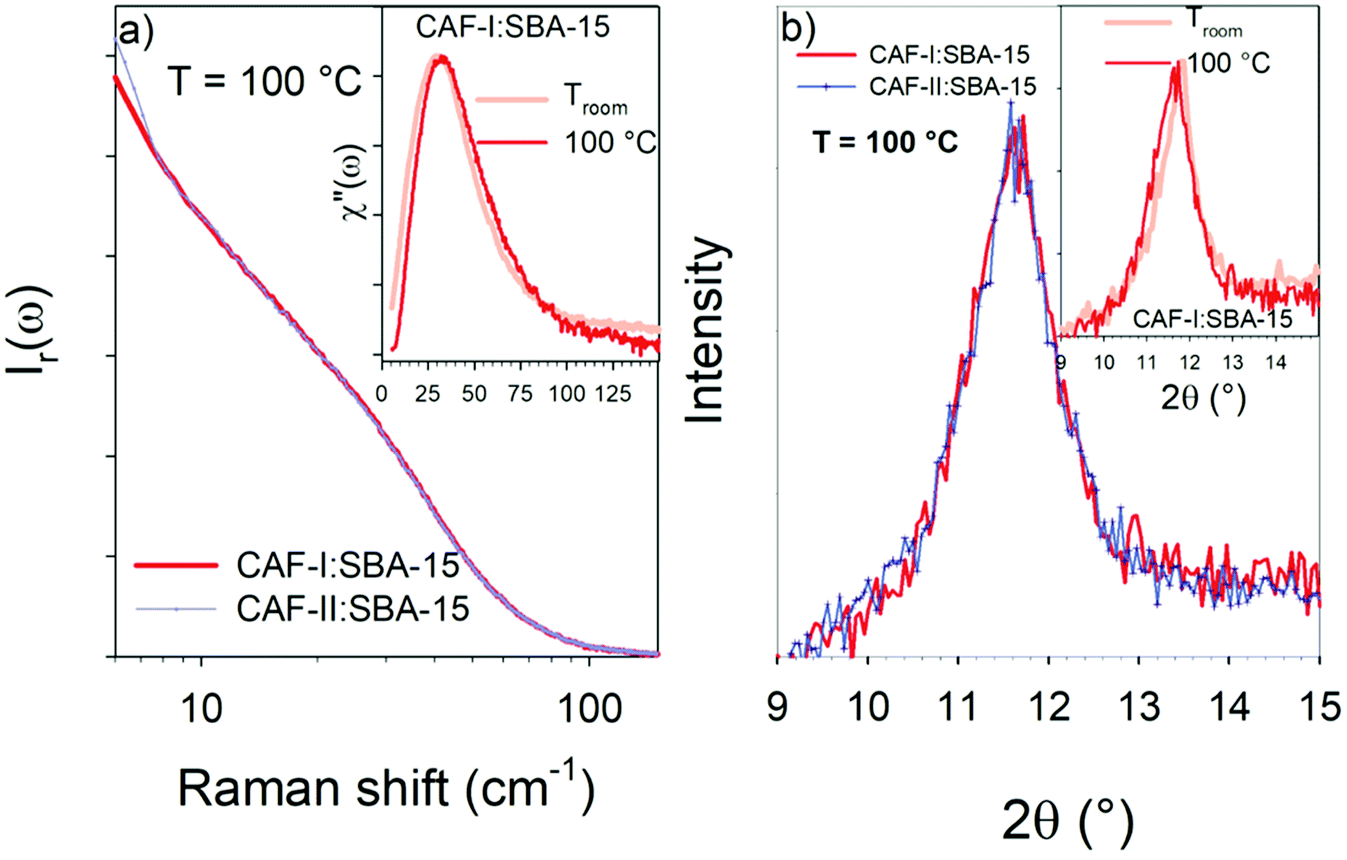 | ||
| Fig. 5 Analysis of the physical state of the two composites at 100 °C, from (a) LFRS plotted in reduced intensity (Ir(ω)-spectra) using a logarithm ω-scale for a better analysis of the low-frequency range; Raman susceptibilities collected in the CAF-I:SBA-15 composite are plotted in the inset on either side of the exothermic transition at room temperature and 100 °C (b) PXRD plotted in the 9–15 2θ-region corresponding to the broadened 110 Bragg peak of CAF-I; data collected in the CAF-I:SBA-15 composite are plotted in the inset on either side of the exothermic transition at room temperature and 100 °C. | ||
In a second step the second endothermic transformation observed in Fig. 3 for each composite in two successive runs was analyzed upon further heating above 100 °C. Fig. 6a shows the reduced intensity representation of the LFRS of CAF-I:SBA-15 plotted between 100 and 180 °C by step of 10 °C, knowing that the two composites are similar above 100 °C.
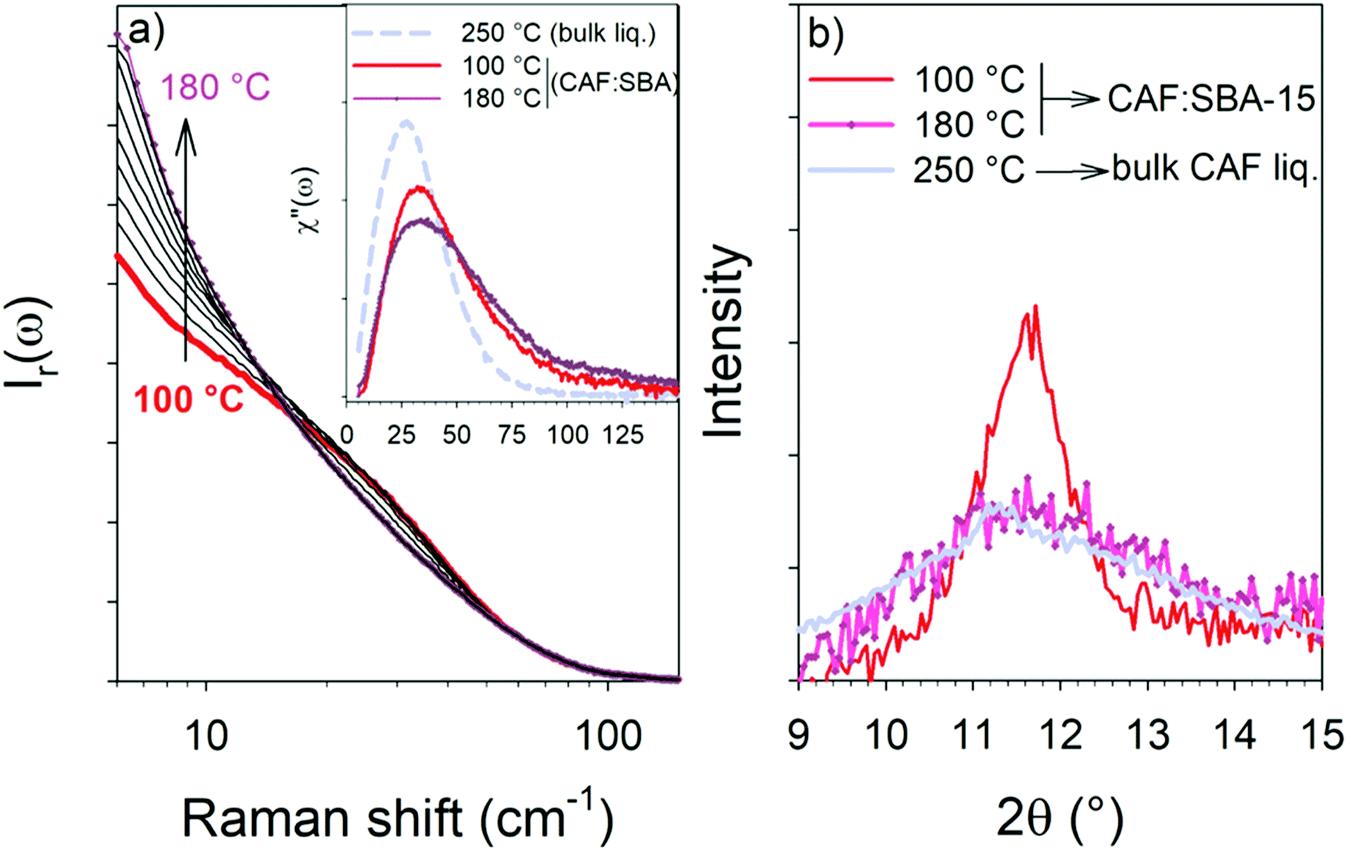 | ||
| Fig. 6 Analysis of the endothermic transformation from (a) LFRS plotted in reduced intensity by step of 10 °C between 100 and 180 °C; Raman susceptibilities of the CAF-I:SBA-15 composite taken on either side of the transformation are plotted in the inset and compared to that of the liquid in the bulk form (b) PXRD plotted in the 9–15° 2θ-region on either side of the transformation compared with that of the liquid in the bulk form. | ||
The temperature dependence of Ir(ω)-spectrum exhibits a continuous increase of the quasielastic component accompanied with an enhanced flattening of the vibrational component corresponding to an enhanced broadening of the Raman susceptibility plotted at 100 and 180 °C in the inset of Fig. 6a. The broadening of the χ′′(ω)-spectrum can be explained from the consideration of additional vibrational modes to the VDOS mostly restricted to librational modes in rotator phases (CAF-I). It can be assumed that the appearance of additional vibrational motions, including interactions with the pore surface, is induced by the spatial confinement of CAF molecules promoting intermolecular interactions. Above 160 °C, i.e. at temperatures above the endotherm, the LFRS becomes temperature independent. Considering the strong enhancement of the quasielastic intensity between 100 and 150 °C, the endotherm was interpreted as the melting of CAF-I′.
This assumption is also supported by the plot of PXRD in 9–15° 2θ-region of confined CAF at 100 and 180 °C in Fig. 6b, which shows a drastic broadening of the Bragg peak at 180 °C superimposed with the plot of the bulk liquid form in this 2θ-region. This indicates that the melting temperature of CAF crystallites confined to cylindrical pores of 6 nm diameter is decreased of about 80 °C, in agreement with the Gibbs–Thomson effect.23 Consequently, the second transformation observed in both composites by microcalorimetry ending by an endothermic peak can be interpreted as a first-order crystal – liquid phase transition corresponding to the melting of CAF in a liquid state characterized by the same molecular organization as in the bulk form, but with different properties of the molecular dynamics. Both confined CAF-I′ and confined liquid have the same structural organization as in bulk forms but different molecular dynamics.
3.3. Analysis of composites cooled down to room temperature after heating up to 180 °C
The LFRS and PXRD of the two composites cooled at room temperature after the first heating ramp are compared with those of the freshly prepared CAF-I:SBA-15 composite in Fig. 7a and b. Both figures show that the two composites are in the same physical state at room temperature after cooling from 180 °C, as it can be expected since CAF is in the liquid state in the two composites at 180 °C. These figures also show that this physical state is corresponding to CAF-I′ form, structurally close to CAF-I freshly confined to the pores by MAL but with different dynamics. This description is consistent with the absence of exothermic feature in the heat flow curves corresponding to the second heating run in Fig. 3a and b. The observation of the endotherm upon the second heating confirms its interpretation as the melting of CAF-I′. It is also the signature of the recrystallization after cooling the liquid at room temperature that can be considered as an unusual phenomenon for a pore size of 6 nm. This is confirmed by the microcalorimetry analysis performed upon cooling both composites. Fig. 8 shows the heat flow trace obtained upon cooling the CAF-II:SBA-15 composite. The exotherm of crystallization is observed upon cooling, ending around 100 °C. Fig. 8 shows that this temperature also corresponds to the ending of the exothermic transformation observed upon the first heating run. The capability of CAF to recrystallize under geometrical confinement at the nanoscale is probably related to the very close description between the physical states of the nanocrystalline rotator phase (CAF-I′:SBA-15) and the liquid state confined to SBA-15. The slight shift toward the high temperatures observed on the second heating in the two composites indicates a slight size increase of the CAF-I′ nanocrystals after melting. It is worth noting that all the transformations observed upon heating/cooling the two composites clearly show that CAF is completely loaded within SBA-15 matrices.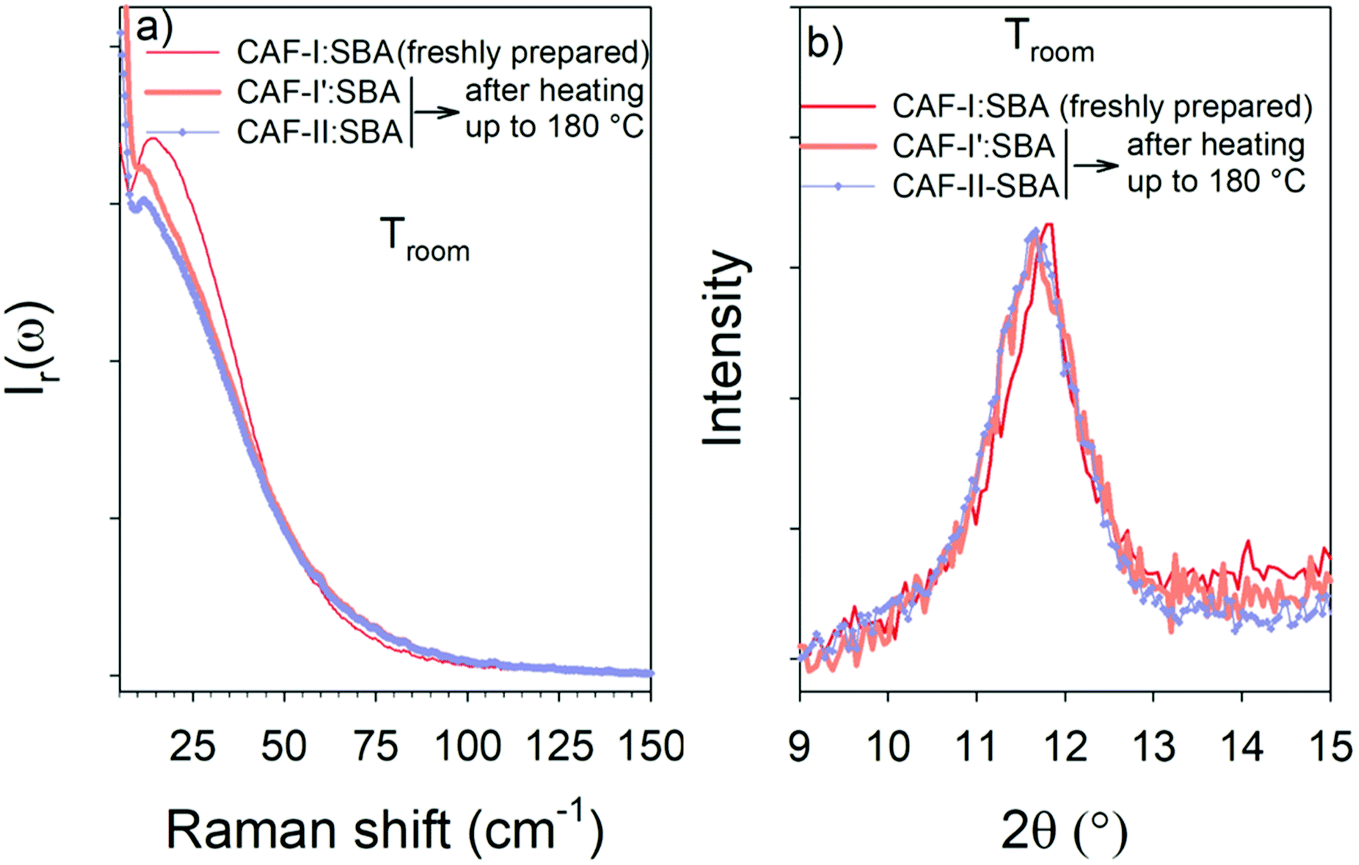 | ||
| Fig. 7 Analysis at room temperature of the physical state of CAF in the two composites after cooling from the liquid state (180 °C) from (a) LFRS plotted in reduced intensity (b) PXRD plotted in the 9–15° 2θ-region of the two composites cooled down to room temperature from 180 °C, compared to data collected in the freshly prepared CAF-I:SBA-15 composite. | ||
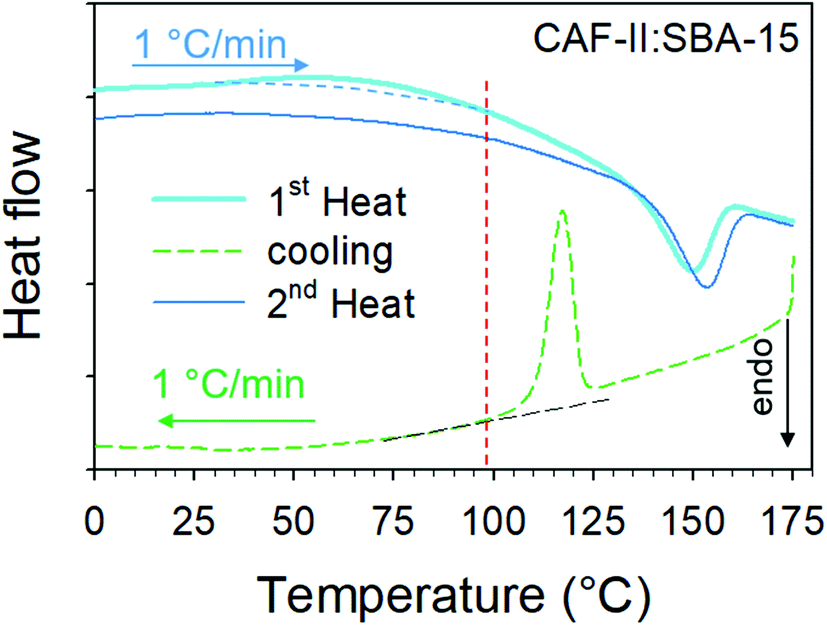 | ||
| Fig. 8 Heat flow traces obtained upon two successive heating ramp compared with that obtained upon cooling; the vertical dashed line highlights the correspondence between the end of the crystallization upon cooling and the end of the exothermic transformation upon the 1st heating. | ||
3.4. MAL method: a route to explore and manipulate original physical states of materials confined to pores at the nanoscale
This study has firstly shown the capabilities of the MAL method to load the desired polymorphic form of CAF, that is impossible by wet impregnation methods i.e. capillarity of a CAF solution into channels of 6 nm mean diameter. It is well known that the confinement of molecular materials changes the molecular dynamics of amorphous states, especially the molecular mobility more rapid in the channel core and slower close to the surface.24,25 In the present case, CAF-I is a rotator phase with molecular dynamics similar to that of undercooled liquids. This can explain the band-shape of the LFRS of confined CAF-I, observed in Fig. 2, clearly different from that of the bulk form, while similar spectra are observed for bulk and confined CAF-II. However, PXRD data indicate a similar distribution of the molecular mass centers in CAF-I with an important size effect responsible for the strong broadening of Bragg peaks. Knowing that the Bragg peaks in rotator phases are just resulting from the periodicity of the molecular mass centers, the size effect can be inherent to the interactions between CAF molecules and the pore surface breaking the periodicity of the mass centers and modifying the band-shape of the CAF-I VDOS. Intermolecular forces are more important in the more ordered CAF-II form that can explain the similar band-shape of the LFRS in bulk and confined CAF-II.The most original phenomenon observed in the study of the two composites results from the detection of an exothermic disordering transformation corresponding to the conversion of CAF-I into CAF-I′ in the CAF-I:SBA-15 composite and to the polymorphic transition of CAF-II into CAF-I′ in the CAF-II:SBA-15 composite. It was observed that these transformations are associated with a change in the band-shape of the VDOS, inevitably correlated to a Cp change. It is related to a change in frequency spectra of lattice vibrations induced by the randomization of the molecular mass centers associated with the size effect determined from the analysis of the broadened 110 Bragg peak. This change in the VDOS has undoubtedly a contribution to Cp greater than that of disorder. This statement is supported by more important changes in the vibrational component of the LFRS (ω > 15 cm−1) than the increase of quasielastic intensity (ω < 15 cm−1). CAF-I′ can be considered on the border between a rotator crystalline phase and an amorphous state.
The first-order endothermic peak observed at about 150 °C was interpreted as the melting of nanocrystals of CAF-I′, mainly corresponding to the complete randomization of the molecular mass centers with similar consequences on the LFRS as previously observed for the CAF-I → CAF-I′ transformation, i.e. increase of the quasielastic intensity and the enhanced modifications in the band-shape of the VDOS. It is clearly observed in Fig. 6a that the LFRS modifications above 15 cm−1 corresponding to the melting of CAF-I′ are minor than those observed in Fig. 4a for the CAF-I → CAF-I′ transformation. The melting is mainly characterized by the quasielastic intensity increase, while the exothermic transformation is mainly characterized by the change in the vibrational component.
Upon cooling from 180 °C down to room temperature molecules return in a relative organized CAF-I′ configuration, in which molecular mass centers present a periodicity restricted at the nanoscale. As a consequence, the exothermic disordering transformation is no more observed upon the second heating ramp in Fig. 3. It is worth noting that it is a rare example of recrystallization of materials confined to cylindrical pores of 6 nm mean diameter. This phenomenon is mostly connected to the nature of the rotator phase, the analogous of an undercooled liquid from a dynamics point of view.
4. Conclusion
This paper shows that the innovative MAL method, developed by the authors, is a very efficient and unique solid-state method for loading molecular materials within mesoporous silica matrices, as recently confirmed in a very recent study performed by another group.26 It is now recognized as an alternative to solvent-based drug loading methods, and considered as very useful for pharmaceutical applications.27,28 We show that using this solid-state method makes possible to confine the selected crystalline form of a polymorphic system. In addition to the specific properties very suitable for confining APIs to MPS matrices used as drug-delivery,17 MAL method can be also considered as an original route to explore new physical states of the condensed matter confined at the nanoscale and their subsequent transformations. Indeed, it was shown that both crystalline forms of caffeine undergo an exothermic disordering transformation into a new form I′, only existing under confinement, on the border between a nanocrystalline orientationally disordered phase and an amorphous state. Form I′ remains stable on a wide temperature domain ranging from room temperature up to about 150 °C. This study shows that confining CAF to SBA-15 makes it possible to stabilize a new disordered nanocrystallized phase with an enhanced water solubility with respect to bulk forms, that is an important issue for pharmaceutical applications.Conflicts of interest
There are no conflicts to declare.References
- A. Juban, S. Briancon and F. Puel, Drug Dev. Ind. Pharm., 2016, 42, 1857–1864 CrossRef CAS PubMed.
- H. Bothe and H. K. Cammenga, J. Therm. Anal., 1979, 16, 267–275 CrossRef CAS.
- A. Cesaro and G. Starec, J. Phys. Chem., 1980, 84, 1345–1346 CrossRef CAS.
- M. Descamps, N. Correia, P. Derollez, F. Danede and F. Capet, J. Phys. Chem. B, 2005, 109, 16092–16098 CrossRef CAS PubMed.
- P. Derollez, N. Correia, F. Danede, F. Affouard, J. Lefebvre and M. Descamps, Acta Crystallogr., 2005, B61, 329–334 CAS.
- G. Enright, V. Terskikh, D. Brouwer and J. Ripmeester, Cryst. Growth Des., 2007, 7, 1406–1410 CrossRef CAS.
- R. Brand, P. Lunkenheimer and A. Loidl, J. Chem. Phys., 2002, 116, 10386–10401 CrossRef CAS.
- P. Lunkenheimer, U. Schneider, R. Brand and A. Loidl, Contemp. Phys., 2000, 41, 15–36 CrossRef CAS.
- S. Karki, T. Friscic, W. Jones and W. Motherwell, Mol. Pharmaceutics, 2007, 4, 347–354 CrossRef CAS PubMed.
- J. W. Steed, Trends Pharmacol. Sci., 2013, 34, 185–193 CrossRef CAS PubMed.
- S. J. Dengale, H. Grohganz, T. Rades and K. Lobmann, Adv. Drug Delivery Rev., 2016, 100, 116–125 CrossRef CAS PubMed.
- E. Juere and F. Kleitz, Microporous Mesoporous Mater., 2018, 270, 109–119 CrossRef CAS.
- M. Vallet-Regi, A. Ramila, R. P. Del Real and J. Perez-Pariente, Chem. Mater., 2001, 13, 308–311 CrossRef CAS.
- M. Vallet-Regi, M. Colilla, I. Izquierdo-Barba and M. Manzano, Molecules, 2018, 23, 47–65 CrossRef PubMed.
- M. Beinier, G. Rengarajan, S. Pankaj, D. Enke and M. Steinhart, Nano Lett., 2007, 7, 1381–1385 CrossRef PubMed.
- C. Leuner and J. Dressman, Eur. J. Pharm. Biopharm., 2000, 50, 47–60 CrossRef CAS PubMed.
- B. Malfait, N. Correia, A. Mussi, L. Paccou, Y. Guinet and A. Hédoux, Microporous Mesoporous Mater., 2019, 277, 203–207 CrossRef CAS.
- B. Malfait, N. Correia, C. Ciotonea, J. Dhainaut, J.-P. Dacquin, S. Royer, N. Tabary, Y. Guinet and A. Hédoux, J. Chem. Phys., 2020, 153, 154506–154513 CrossRef CAS PubMed.
- A. Hédoux, Adv. Drug Delivery Rev., 2016, 100, 133–146 CrossRef PubMed.
- A. Hédoux, A.-A. Decroix, Y. Guinet, L. Paccou, P. Derollez and M. Descamps, J. Phys. Chem. B, 2011, 115, 5746–5753 CrossRef PubMed.
- A. Hédoux, Y. Guinet, L. Paccou, F. Danede and P. Derollez, J. Pharm. Sci., 2013, 102, 162–170 CrossRef PubMed.
- P. Scherrer, Nachr. Ges. Wiss. Goettingen, Math.-Phys. Kl., 1918, 2, 98–100 Search PubMed.
- W. Thomson, Philos. Mag., 1869, 42, 448–452 Search PubMed.
- C. Jackson and G. McKenna, J. Non-Cryst. Solids, 1991, 131–133, 221–224 CrossRef CAS.
- W. Thompson, J. Chem. Phys., 2018, 149, 170901 CrossRef PubMed.
- K. Trzeciak, S. Kazmierski, K. Druzbicki and M. Potrzebowski, J. Phys. Chem. C, 2021, 125, 10096–10109 CrossRef CAS.
- K. Trzeciak, S. Kazmierski, E. Wielgus and M. Potrzebowski, Microporous Mesoporous Mater., 2020, 308, 110506–110523 CrossRef CAS.
- K. Trzeciak, A. chotera-Ouda, I. Bak-Sypien and M. Potrzebowski, Pharmaceutics, 2021, 13, 950–993 CrossRef PubMed.
Footnote |
| † Electronic supplementary information (ESI) available: Structure of caffeine molecule; Gibbs diagram of bulk caffeine; powder X-ray diffraction patterns of bulk caffeine in both crystalline forms I and II; structural description of crystalline forms of caffeine; analysis of the low-frequency Raman spectrum of disordered molecular materials; the textural properties of SBA-15; comparison of raw spectra between bulk and confined caffeine crystalline forms at room temperature. See DOI: 10.1039/d1ra05757j |
| This journal is © The Royal Society of Chemistry 2021 |