 Open Access Article
Creative Commons Attribution 3.0 Unported Licence
One-step upgrading of bio-based furfural to γ-valerolactone via HfCl4-mediated bifunctional catalysis†
Mingrui Li,
Yixuan Liu,
Xialing Lin,
Jinyu Tan,
Song Yang * and
Hu Li
 *
*
State Key Laboratory Breeding Base of Green Pesticide & Agricultural Bioengineering, Key Laboratory of Green Pesticide & Agricultural Bioengineering, Ministry of Education, State-Local Joint Laboratory for Comprehensive Utilization of Biomass, Center for R&D of Fine Chemicals, Guizhou University, Guiyang, Guizhou 550025, China. E-mail: hli13@gzu.edu.cn; jhzx.msm@gmail.com
First published on 2nd November 2021
Abstract
γ-Valerolactone (GVL) is an attractive biomass-derived platform molecule that plays an important role in the production of biofuels and biopolymers. The synthesis of GVL from renewable biomass and its derivatives has great application prospects but also presents challenges due to the multiple conversion steps involved. Here, a HfCl4-mediated acid–base bifunctional catalytic system was developed, which was demonstrated to be efficient for upgrading furfural (FF) to GVL in a single pot with unprecedented performance. The Lewis acidity of Hf4+ and moderate basicity of HfO(OH)2·xH2O, and strong Brønsted acidity of HCl in situ generated from HfCl4 hydrolysis were found to play a synergistic role in the cascade reaction processes, mainly contributing to the pronounced catalytic activity. The effects of the key reaction parameters, such as the catalyst dosage, reaction time, and temperature, on GVL production were optimized by response surface methodology. It is worth mentioning that the recovered catalyst after thermal treatment could be directly used for the hydrogen transfer processes, like FF-to-furfuryl alcohol conversion. This catalytic strategy opens a new avenue for the selective conversion of biomass feedstocks involving multiple steps and complex processes.
1. Introduction
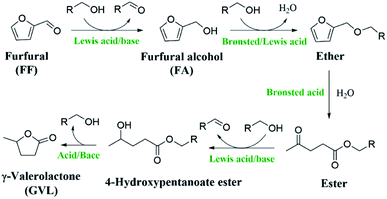
With the increasing demand for fine chemicals and fuels in modern society, the excessive exploitation and consumption of nonrenewable fossil energy resources are getting worse. There is thus an urgent need to seek renewable energy substitutes.1,2 Biomass is the most abundant organic carbon source and is widely distributed, which make it often used to produce biofuels and various valuable chemicals.3–6 Among the biomass feedstocks, C5 sugars (e.g., arabinose and xylose) obtained from hemicellulose can be converted into furfural (FF), furfuryl alcohol (FA), and levulinic acid, which can be further upgraded to γ-valerolactone (GVL), an important and valuable chemical.7–9 GVL is considered a green solvent, biofuel additive, and biopolymer precursor because of its high lightning and low melting point.10–14 The process of preparing GVL by the hydrogenation of levulinic acid usually requires dangerous high-pressure H2 and the use of expensive noble metals as catalysts,15–19 which is not in line with the concept of energy-saving green chemistry. FF as an important biomass derivative has been reported to be able to successfully synthesize GVL in one pot.20 The synthesis of GVL from FF usually uses formic acid or alcohol as a hydrogen source instead of high-pressure hydrogen, which makes the process safer and greener. Moreover, by completing the process through a one-pot method, it is possible to effectively reduce the chemical waste caused by each step of the separation and purification, which makes it a more efficient and energy-saving process. Despite this, there are only limited reports on the synthesis of GVL from FF in one pot.21–23 The main barrier could be that the selective transformation of FF into GVL requires multiple steps (Scheme 1), including hydrogenation, hydrolysis ring-opening, partial hydrogenation, cyclization, and other steps (e.g., etherification, esterification, and lactonization), in which a specific active site is needed for each step of the reaction.9,24,25 In addition, the reaction process is often accompanied by the formation of humin,26–28 making it far from ideal for commercialization.In line with this, many bifunctional catalysts (e.g., Au/ZrO2 + ASM-5, Hf-MOF-808 + Al-beta, Zr-HY + Al-HY, CuAl + H-ZSM-5, HZ-ZrP, DUT-67(Hf), HPW/Zr-beta, and ZrO2-SBA-15) have been developed to catalyze the conversion of FF to GVL.20–23,29–35 The selective conversion of FF to GVL requires two key catalytic transfer hydrogenation (CTH) reactions, which can be achieved by Lewis acid–base sites.36–41 In particular, the strength of Lewis acid–base sites was found to affect the yield of GVL. Lewis acid–base sites of a medium strength are more conducive to the occurrence of CTH reactions.33 In addition, the Brønsted acid site is also essential for the ring-opening reaction.31 In the reported studies, the non-noble metals that catalyze the cascade transformation of FF into GVL are mostly Zr-based catalysts,26–28 while there are few reports on Hf-based catalysts.30 Although these prepared catalysts show good catalytic activity for the conversion of FF to GVL, they have some disadvantages too that cannot be ignored. For instance, the preparation of the catalyst requires many complicated steps, while some may not require many steps but a long preparation cycle or time is necessary.32,34 Therefore, it is still desirable to develop low-cost, high-efficiency, and easily available catalysts for the conversion of FF to GVL.
In this work, a HfCl4-mediated acid–base bifunctional catalytic system was developed, which could effectively upgrade FF to GVL in one pot. The yield of GVL could reach 64.2% at 453 K in 8 h. It was found that the Lewis acid (HfCl4) and the in situ-formed Lewis base species HfO(OH)2·xH2O in medium strength were conducive to promoting FF and isopropyl levulinate (IPL) to undergo the CTH process, while the strong Brønsted acid (HCl) generated by HfCl4 hydrolysis made the furan ring open easily. Overall, the acid–base sites in the bifunctional catalyst were found to play a synergistic role in the efficient conversion of FF to GVL. The effects of the reaction temperature, reaction time, hydrogen donor, and catalyst dosage on the catalyst performance were studied, and further optimized by response surface methodology (RSM). In addition, the reaction kinetics and involved reaction mechanisms were also studied. Interestingly, the recovered catalyst calcined at 723 K for 6 h could effectively catalyze the transfer hydrogenation of FF to FA.
2. Experimental
2.1 Materials
Furfural (C5H4O2, >99%), naphthalene (C10H8, >99%), furfuryl alcohol (C5H6O2, >99%), γ-valerolactone (C5H8O2, >98%), methanol (CH4O, 99%), ethanol (C2H6O, 99%), 2-propanol (C3H8O, 99%), 2-butanol (C4H10O, 99%), 2-pentanol (C5H12O, 99%), ethyl acetate (C4H8O2, 99%), hafnium chloride (HfCl4, 99%), and ethyl levulinate (C7H12O3, 98%) were procured from Shanghai Aladdin Industrial Inc. All other reagents were of analytical grade and used without further treatment.2.2 Catalytic conversion of FF to GVL
The conversion of FF to GVL was conducted in a 15 mL stainless steel reactor. Typically, 1 mmol FF (0.096 g), 15 mg naphthalene (internal standard), 0.015–0.06 mol% HfCl4 (1 g corresponding to 0.3 mol% HfCl4), and 6 mL 2-propanol were added to the reaction kettle. Then, the kettle was sealed, followed by transferring into a pre-heated oil bath to the desired temperature, and reacting for a certain time under magnetic stirring. After the reaction was finished, the reaction kettle was cooled to room temperature in a short time, and the mixture was filtered by a filter membrane, which was then analyzed by gas chromatography (GC) and gas chromatography-mass spectrometry (GC-MS).2.3 Analytical method
The substances contained in the resulting liquid mixture were identified by a GC-MS system (Agilent 6890-5973) equipped with a 5973 MS mass spectrometer. GC (Agilent 7890B) equipped with an HP-5 column (30 m × 0.25 mm × 0.25 μm), and a flame ionization detector (FID) was used to determine the specific concentration or for the quantitative analysis of the various substances. The conversion of FF and the yield of the product (e.g., GVL and IPL) were calculated from standard curves made with commercial samples using naphthalene as an internal standard. The concentration of the respective substance in the solution was calculated with the following equations:
 | (1) |
 | (2) |
2.4 Catalyst characterization
FT-IR (Fourier transform infrared) spectra were recorded on a PerkinElmer 1710 spectrometer (KBr disc) in the wavenumber range of 400–4000 cm−1. XRD (X-ray diffraction) patterns were recorded on a Bruker D8 Advance system using Cu Kα radiation with 2θ = 5°–80°. XPS (X-ray photoelectron spectroscopy) analysis was conducted on a Physical Electronics Quantum 2000 Scanning ESCA Microprobe (Mono Al-Kα, hν = 1486.6 eV). The pass energy of the full-spectrum scan was 100 eV, and the pass energy of the narrow-spectrum scan was 60 eV. The XPS spectra were calibrated based on the surface contamination C 1s (284.8 eV). The residual Hf in the reaction liquid was tested by ICP-OES (inductively coupled plasma optical emission spectroscopy, Agilent 720). SEM (scanning electron microscopy) images were obtained using a ZEISS SIGMA300 system. The powder samples were bonded on conductive adhesive for the SEM measurements. HR-TEM (high-resolution transmission electron microscopy) images were obtained using an FEI TALOS F200C system, with a resolution of 0.16 nm. The TEM samples were dispersed in absolute ethanol after ultrasonic vibration and deposited on a carbon-coated copper grid.3. Results and discussion
3.1 Effect of the reaction temperature and time
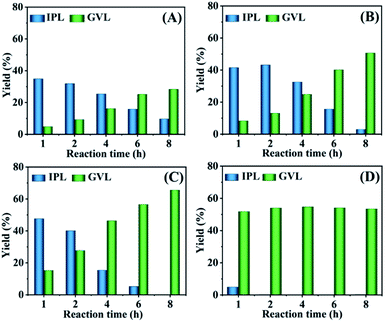
The effect of the reaction temperature on the cascade transformation of FF into GVL was investigated over HfCl4 at 413–473 K. FF could be almost completely transformed at the reaction temperature of 413–473 K in the reaction time range of 1 h to 8 h (Fig. S1†). As shown in Fig. 1, as the reaction temperature rose from 413–453 K (reaction for 1 h), the yield of GVL and IPL increased from 4.8% and 34.8% to 15.2% and 47.6%, respectively. This indicated that a higher temperature was favourable for the GVL synthesis from FF. When the reaction time was extended from 1 h to 8 h (at 453 K), the yield of GVL increased from 15.2% to 64.2%. Obviously, a longer reaction time and higher temperature were more conducive to the formation of GVL. In addition, it must be mentioned that IPL was the main by-product in all cases and could be gradually converted to GVL as the reaction time extended. This may be because the conversion of IPL to GVL required two processes: transfer hydrogenation and cyclization, and the isopropyl group is difficult to be removed in the cyclization reaction. Therefore, a higher temperature and longer reaction time were conducive to a better GVL yield. After heating to 473 K for 1 h, the yield of GVL reached 51.8% (Fig. 1D). However, the yield of GVL did not change significantly with the extension of the reaction time. It is speculated that a higher reaction temperature will promote the occurrence of side reactions, resulting in an increase in humin attached to the catalyst and a reduction in active sites that can be contacted. Therefore, continuing to extend the reaction time does not significantly increase the yield of GVL. In addition, an interesting phenomenon could also be observed, wherein the yield of GVL obtained at 473 K was lower than at 453 K. This is because the origin of the Lewis acid site (Hf4+) should be attributed to HfCl4, and HfO(OH)2·xH2O is gradually generated as the reaction progresses. A relatively high reaction temperature accelerates the reaction and also promotes the formation of HfO(OH)2·xH2O, because –OH in HfO(OH)2·xH2O may occupy the empty orbital of Hf4+, resulting in a decrease in the strength of the Lewis acid sites in the catalyst. Therefore, the yield of GVL decreased when the reaction temperature was too high.3.2 Effect of the hydrogen source type
The catalytic results of HfCl4 in the conversion of FF to GVL with different primary and secondary alcohols as hydrogen donors at 453 K for 8 h are shown in Fig. 2. When methanol was used as a hydrogen source, the yield of GVL was as low as 7.9%, with the IPL yield only 14.7%. On the contrary, ethanol showed a good hydrogen-donating ability, and the yield of GVL was as high as 52.9%, with the IPL yield as low as 2.8%. This may be due to the steric hindrance of methanol while ethanol is small, and the hydrogen supply capacity mainly depends on the reduction potential energy of alcohol. Table S1† provides data on the reduction potential energy and steric hindrance of various alcohols. It is obvious that ethanol has a much lower reduction potential energy than methanol (85.4 kJ mol−1 vs. 130.1 kJ mol−1). Therefore, ethanol has a better hydrogen supply capacity than methanol.8,32,42 Moreover, the fact ethanol showed a better hydrogen supply capacity could also be ascribed to the fact that the transition state between the hydrogen donor and the catalyst was more stable with the extension of the carbon chain of the primary alcohol.43 For the secondary alcohol, 2-propanol revealed a higher GVL yield of up to 64.2%, demonstrating that it was a better hydrogen donor. This may be because the β-hydrogen of sec-alcohol is easier to be removed from the intermediate alcohol oxide than from the primary alcohol via the CTH reaction. With the extension of the alcohol carbon chain, the yield of GVL decreased significantly from 64.2% in 2-propanol, 54.9% in 2-butanol, to 31.0% in 2-pentanol. This may be because secondary alcohols have relatively larger steric hindrance, which makes it difficult to contact with the catalyst active sites to form a stable transition state, and thus is not conducive to the occurrence of the CTH reaction.19 Accordingly, the yield of GVL gradually decreased with the extension of the carbon chain length of the secondary alcohol. Hence, 2-propanol was selected as the optimal hydrogen donor.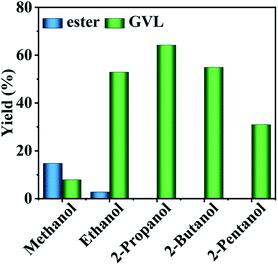 | ||
| Fig. 2 Conversion of FF to GVL with different alcohols. Reaction conditions: 1 mmol FF, 6 mL alcohol, 0.03 mol% HfCl4, 453 K, and 8 h. | ||
3.3 Effect of the catalyst dosage
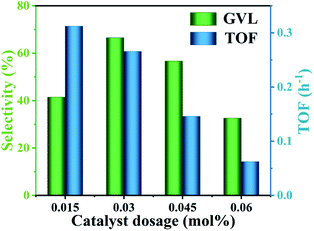
The excellent catalytic activity was mainly attributed to the content of Lewis acid–base sites and Brønsted acid sites available in the reaction system. Since the Lewis acid sites involved in the reaction in the reaction system were completely derived from Hf4+, the content of Lewis acid in the reaction system was consistent with the content of Lewis acid in HfCl4 (3.1 mmol g−1). Therefore, it is particularly important to select a proper amount of HfCl4 to obtain an enhanced GVL yield. As shown in Fig. 3, as the amount of HfCl4 catalyst increased from 0.015 mol% to 0.06 mol%, the yield of GVL increased from 36.5% to 64.2%. However, with further increasing the amount of HfCl4, the yield of GVL was significantly reduced. It is worth noting that the TOF value (from 0.31 to 0.06 h−1) showed a decreasing trend as the amount of HfCl4 increased. This is because when the amount of catalyst was too great, more catalyst was prone to agglomerate, further increasing the particle size of the catalyst and causing mass-transfer resistance. This may extend the residence time of the substrate and product in the catalyst, which will cause side reactions to form by-products (Fig. S2†).22 Therefore, TOF decreased as the amount of catalyst increased. This can explain why excessive HfCl4 cannot achieve higher GVL productivity. In general, when the catalyst dosage was 0.03 mol%, it could obtain a higher GVL yield (64.2%) although the TOF value (0.27 h−1) was slightly lower than 0.015 mol%. Therefore, 0.1 g was selected as the optimal catalyst dosage.3.4 Response surface methodology analysis
To further investigate the effect of various factors for the one-pot conversion of FF to GVL, a three-factor and three-level central composition design of response surface analysis (RSA) was applied. The independent factors included the reaction temperature (A), reaction time (B), and catalyst dosage (C), and the GVL yield was designated as the related response factor. Table S2† shows the research range and corresponding level of each influencing factor based on the previous single-factor optimization. The Box–Behnken experimental design was performed by Design-Expert 8.0.6 software. Table S3† shows the reaction conditions of each group and the yield of GVL under these conditions. In addition, Fig. S3A† is the relative evaluation diagram of the experimental and predicted GVL yields, showing that the actual value was relatively close to the linear distribution. This demonstrates that there was almost no notable difference between experimental and predicted value.12 According to the above design results, the quadratic polynomial model of GVL yield was obtained, as shown in eqn (3):| GVL yield = +64.64 − 2.67A − 0.59B − 0.56C − 7.83AB − 4.58AC − 1.25BC − 7.71 A2 − 4.39B2 − 6.88C2 | (3) |
The standard analysis of variance (ANOVA) was conducted for this model to evaluate its sufficiency and goodness. It can be seen from the variance analysis results in Table 1 that the P-value below 0.05 suggested that this model was significant, and the variable significantly affected the response at the 95% confidence level. It is gratifying that on account of this analysis, the P-value of this model was less than 0.0001, suggesting that the model was highly significant. In addition, the lack of fit was not significant, exhibiting that the model fitted well with the actual process. In consequence, this equation could be effectively used to explore the influence of each factor in the reaction system on the yield of GVL. According to the F value of each influencing factor, the order of the factors important for the yield of GVL was A > B > C, that is, the reaction temperature had the largest influence relative to the other factors. This may be due to the conversion of IPL to GVL requiring a higher temperature during the reaction. Interestingly, AB > AC > BC, indicating that the interaction term of the reaction temperature and time had the greatest effect on the generation of GVL, while the interaction term of the catalyst dosage and reaction time had little effect on the yield of GVL.
| Source | Sum of squares | df | Mean square | F value | P-value prob. > F | Significant |
|---|---|---|---|---|---|---|
| Model | 1006.32 | 9 | 111.81 | 42.43 | <0.0001 | Significance |
| A: reaction temperature | 57.24 | 1 | 57.24 | 21.73 | 0.0023 | |
| B: reaction time | 2.76 | 1 | 2.76 | 1.05 | 0.3401 | |
| C: catalyst dosage | 2.53 | 1 | 2.53 | 0.96 | 0.3597 | |
| AB | 244.92 | 1 | 244.92 | 92.95 | <0.0001 | |
| AC | 83.72 | 1 | 83.72 | 31.77 | 0.0008 | |
| BC | 6.25 | 1 | 6.25 | 2.37 | 0.1674 | |
| A2 | 257.48 | 1 | 257.48 | 97.72 | <0.0001 | |
| B2 | 85.07 | 1 | 85.07 | 32.29 | 0.0007 | |
| C2 | 206.02 | 1 | 206.02 | 78.19 | <0.0001 | |
| Residual | 18.44 | 7 | 2.63 | |||
| Lack of fit | 17.13 | 3 | 5.71 | 17.41 | 0.0093 | Not significant |
| Pure error | 1.31 | 4 | 0.33 | |||
| Cor. total | 1024.76 | 16 |
A perturbation plot can connect all the factors in the response surface. While keeping other factors constant, the response surface is plotted by changing a factor. The slope or curvature indicates the sensitivity of the response value to this factor. The perturbation plot of this study is displayed in Fig. S3B.† It can be noticed that the influences of the three factors on the response value were all positive at a low level, but changed into negative impacts after increasing them up to a certain extent. This variation process was similar to the results of the previous single-factor optimization, which further supported the previous analysis of the impact of a single factor. Among these, the curvature corresponding to the amount of catalyst was the smallest, indicating that this factor had less influence compared with the other factors.
Fig. 4 presents a 3D and contour plot of the interaction of each independent factor on the GVL yield obtained in the experiment. The influence of the interaction effect of the different factors on the target value can be intuitively perceived from the inclination of the corresponding 3D diagram and the trend of the contour. The flatter the 3D graph, the smaller the effect of the corresponding factors on the response value. The ellipticity of the contour represents whether the interaction is significant. The closer the contour is to the circle, the less significant the interaction is ref. 43–46.
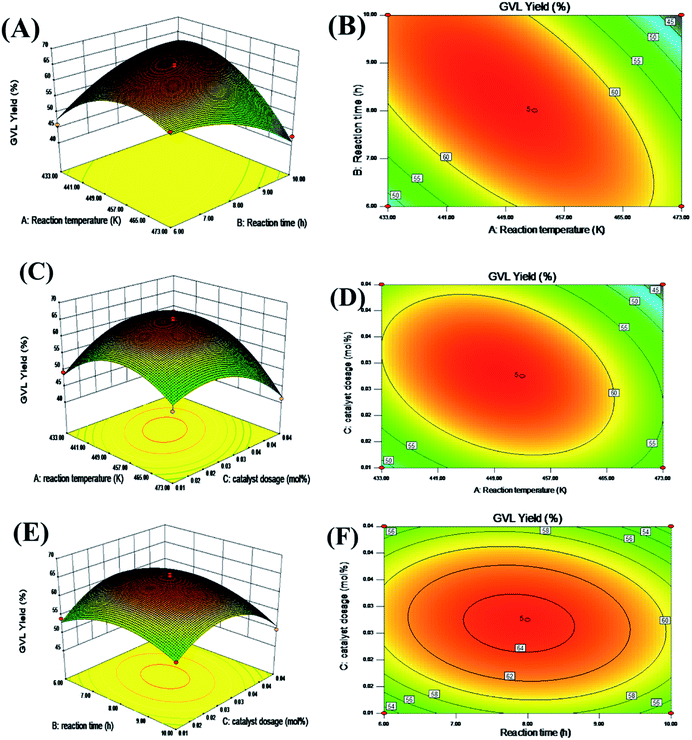 | ||
| Fig. 4 Reaction temperature, reaction time, catalyst dosage interaction 3D response surface (A, C, E), and contour map (B, D, F). | ||
It can be seen from the contour plot that the interaction between the reaction time and temperature was the most obvious, and the slope of the corresponding 3D plot was also larger, which further showed that these two variables had a greater impact on the yield of GVL. In addition, whether it is a contour diagram or a 3D diagram, it can be seen that the yield of GVL was lower when the level of each reaction parameter was lower. This may be because when the amount of catalyst was small, the acid–base sites contained in the reaction system were not enough to catalyze the complete conversion of FF to GVL in a shorter reaction time and lower temperature. With the increase in the level of each reaction parameter, the yield of GVL gradually increased. Nevertheless, when the level of each reaction parameter increased to a certain extent, the yield of GVL began to decrease. This may be because as the catalyst amount increases, excessive HCl in the reaction system will cause a series of side reactions to occur. In addition, too high a reaction temperature will also cause changes in the active sites of the catalyst, so extending the reaction time cannot obtain a higher GVL yield.
The optimal reaction conditions and the highest GVL yield were obtained by RSM. That is, when the amount of catalyst was 0.03 mol%, the GVL yield reached the highest at 64.7% at 447.8 K for 8.34 h. After that, we verified the optimized conditions. When the dosage of FF was 1 mmol and 0.03 mol% catalyst was used, the yield of GVL obtained by reacting at 448 K for 8.3 h was 64.5%. Compared with the predicted value, there was only a 0.3% error, so the established model could reflect the actual situation well. Notably, this result required a shorter reaction time than in many other reports (Table 2), which can greatly improve the production efficiency. Combined with the above analysis, it is considered that this is because the reaction system contained a moderate intensity of Lewis acid–base sites, which made the CTH reaction in the process of FF-to-GVL conversion fully carried out. At the same time, the Brønsted acid (HCl) produced by the hydrolysis of HfCl4 could effectively catalyze the rapid ring-opening reaction of the furan ring. Therefore, an excellent GVL yield could be obtained after only 8.3 h of reaction. More importantly, the commercial catalyst could obtain GVL yields similar to those of lab synthesis catalysts, and did not require complicated and lengthy preparation processes. From a price point of view, the lab preparation of catalysts often requires commercial catalysts as raw materials, so it is more economical than lab synthesis catalysts. Overall, this work provides a feasible reference in principle for industrial scale.
| Entry | Catalyst | H-donor | Temp. (K) | Time (h) | Conv. (%) | Yield (%) | Ref. |
|---|---|---|---|---|---|---|---|
| 1 | HPW/Zr-beta | 2-Propanol | 453 | 24 | 100 | 68 | 26 |
| 2 | Zr/T/zeolite | 2-Propanol | 443 | 10 | 100 | 85 | 27 |
| 3 | Zr-CN/H-β | 2-Propanol | 433 | 18 | 100 | 76.5 | 28 |
| 4 | ZrO2-[Al]MFI-NS-30 | 2-Propanol | 443 | 36 | 100 | 82.8 | 29 |
| 5 | DUT-67(Hf) | 2-Propanol | 453 | 24 | 100 | 87.1 | 30 |
| 6 | HZ-ZrP1-16 | 2-Propanol | 458 | 18 | 100 | 64.2 | 31 |
| 7 | ZPS-1.0 | 2-Propanol | 423 | 18 | 100 | 80.4 | 32 |
| 8 | HfCl4 | 2-Propanol | 448 | 8.3 | 100 | 64.5 | This work |
3.5 Kinetics study
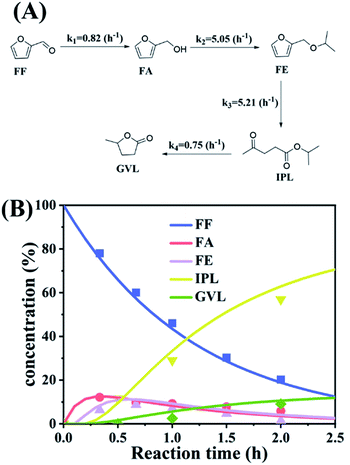
To further understand the conversion of FF to GVL catalyzed by HfCl4 in 2-propanol, we studied the kinetic process of FF conversion to FA, FE, IPL, and GVL based on the one-pot method, and established a simplified kinetic model based on the whole process (Fig. 5A). The kinetic experiment was carried out at 403 K in order to study the reaction rate of each process involved in the conversion of FF to GVL. In the entire reaction system, the amount of 2-propanol in the reaction system was excessive relative to the substrate (78.5 mmol vs. 1 mmol), so it could be assumed that the concentration of 2-propanol was constant in the reaction process. Therefore, a pseudo first-order kinetic model was used to calculate the reaction rate constant of each reaction step. Thus, the relationship between the substrate conversion rate and the reaction time can be expressed as the following reaction rate equations:
 | (4) |
 | (5) |
 | (6) |
 | (7) |
 | (8) |
The experimental results were fitted by the above equations, and the reaction rate constants of each step were obtained (Fig. 5B). It was observed that the reaction rate constant of IPL being converted to GVL was the smallest, indicated that this step was the rate-determining step in this reaction process of FF-to-GVL conversion. In addition, k2 and k3 were much larger than k1 and k4, indicating that FA and FE were rapidly converted during the reaction, which can explain why only the intermediate product of IPL was detected after the reaction was completed and FA and FE were not detected. The main reason for this result may be that the HCl generated by the hydrolysis of HfCl4 is a strong Brønsted acid, which can effectively promote the etherification reaction between FA and 2-propanol and the ring-opening process of FE to generate IPL. The lower reaction rate constant of IPL may be because in the reaction progresses, HfCl4 is gradually converted to HfO(OH)2·xH2O, which has a weaker Lewis acid strength, resulting in a slower progress of the CTH reaction.
3.6 Reaction mechanism
According to the above experimental and corresponding results discussions, a feasible reaction path for the transformation of FF into GVL through a one-pot cascade reaction process is proposed (Scheme 2). In the CTH process, Lewis acid and base sites play a synergistic role.37 HfCl4 provides Lewis acid sites (Hf4+), while HfO(OH)2·xH2O and HCl are gradually in situ generated by HfCl4 hydrolysis in 2-propanol due to the presence of residual water (content: ca. 0.5%) to provide Lewis base sites (O2−) and Brønsted acid sites (HCl), respectively, as illustrated by FT-IR (Fig. S4†). At the beginning of the reaction process, the carbonyl group of FF is adsorbed on the Lewis acid site (Hf4+), and 2-propanol with the oxygen and hydrogen atom of the hydroxyl group are respectively adsorbed onto the Lewis acidic Hf4+ and the Lewis basic oxo-ion site.40 Then, a six-membered ring transition state is formed to complete the transfer hydrogenation process. FF is converted to FA, and at the same time the 2-propanol is transformed to acetone. After that, FA reacts with 2-propanol catalyzed by the Lewis acid sites to form isopropyl furfuryl ether (FE) by an etherification reaction and producing the same amount of water (1 mmol). A part of the formed water will be consumed by HfCl4 hydrolysis to in situ generate more HfO(OH)2·xH2O in moderate basicity and HCl with strong Brønsted acidity. Due to the HCl generated in the reaction system being sufficient, this process proceeds quickly, which is consistent with the large reaction rate constant of FA. Since the subsequent ring-opening reaction of FE also occurs under the action of HCl, this process is also easy to occur. Finally, IPL transformation into GVL requires two steps: transfer hydrogenation and cyclization reactions. The conversion of IPL to isopropyl 4-hydroxyvalerate (4-HPE) via transfer hydrogenation is similar to that of FF to FA, which is also catalyzed by the Lewis acid–base site (Hf4+–O2−). Finally, the cyclization of 1 mmol 4-HPE to produce equivalent GVL is conducted in the presence of acid sites. However, the process of generating GVL from IPL is the most difficult to carry out, showing it is the rate-determining step of the transfer hydrogenation and cyclization.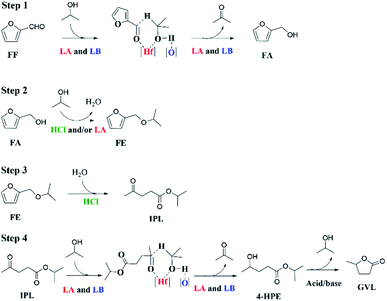 | ||
| Scheme 2 Possible reaction pathways for the cascade conversion of FF to GVL in one pot (LA = Lewis acid, LB = Lewis base). | ||
3.7 Catalyst reusability
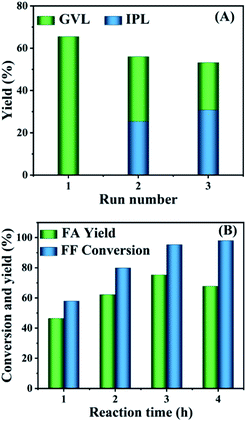
The filtration test was carried out before the catalyst reusability test. As displayed in Fig. S5,† it can be obviously noticed that after the catalyst was filtered, the yield of GVL almost did not change with prolonging the reaction time, indicating that the formation of GVL was performed in a heterogeneous manner. In addition, the ICP results showed that the residual Hf in the mixture could be ignored (0.0002 mg L−1), which strongly demonstrated that the leaching of Hf in the reaction process could be ignored, so the catalyst has the potential to be recycled.After the cascade conversion of FF to GVL catalyzed by HfCl4, the catalyst was collected by centrifugal separation, washed twice with ethyl alcohol, and dried at 353 K in an oven. Since the main component of the recovered catalyst was HfO(OH)2·xH2O, its Lewis acidity was weaker than HfCl4 and it could not effectively catalyze the synthesis of GVL from FF. Therefore, it was necessary to regenerate HfCl4 to increase the Lewis acidity of the catalyst to promote the reaction. The activated catalyst was used for the selective conversion of FF to GVL, and the results are shown in Fig. 6A. FF was completely converted in each cycle, and the yield of GVL was significantly reduced, while the carbon balance of the reaction system was only slightly reduced. The decrease in GVL yield was due to the fact that although the Lewis acidity of the recovered catalyst increased after activation, the humin attached to the catalyst could not be completely removed, resulting in a decrease in the active sites that could be contacted. Therefore, compared with fresh catalyst, the GVL yield obtained by the recovered catalyst was reduced. However, since the content of the main active sites (Hf4+) did not decrease significantly, the carbon balance did not change remarkably compared with the fresh catalyst, but with more IPL.
Because the hydrolysis of HfCl4 to HfO(OH)2·xH2O occurred simultaneously with the formation of humin, it could be considered that the humin generated in situ during the reaction process could be used as a templated surfactant for the generation of HfO(OH)2·xH2O.43 Considering that HfO(OH)2·xH2O can be calcined to obtain HfO2, HfO2 containing Lewis acid–base sites can successfully catalyze the CTH reaction of aldehydes/ketones. Therefore, calcining the collected solid at high temperature can be envisaged to remove the humin in the solid, and the obtained catalyst may then catalyze the transfer hydrogenation of aldehydes/ketones. Therefore, the collected solid was calcined in a tubular muffle furnace at 723 K for 6 h to obtain the target catalyst. For the convenience of the research, we named the catalyst before calcination as HfO2-(b) and the catalyst after calcination as HfO2-(c). Under other identical reaction conditions, HfO2-(c) was used to catalyze the conversion of FF to FA. As shown in Fig. 6B, at 433 K, as the reaction time increased, the conversion rate of FF and the yield of FA increased. When the reaction time was extended to 3 h, the productivity of FA achieved 75.3%. With further extending the reaction time, the yield of FA began to decrease, leading to the formation of ether.
3.8 Catalyst characterization
The structure of the used catalysts before and after calcination was studied. As shown in Fig. 7A, the absorption peak near 3400 cm−1 is the stretching vibration of –OH, which may be attributed to the incomplete removal of –OH part of Hf in HfO(OH)2·xH2O.47 The absorption peak at near 2975 cm−1 can be attributed to C–H stretching vibration, while the absorption peak at 1450 cm−1 is C–H bending vibration, and the absorption peak at 1056 cm−1 may be C–O stretching vibration.48 These absorption peaks in HfO2-(c) were significantly reduced, indicating that most of the humin in HfO2-(b) was removed after the calcination. The absorption peaks at 1600 cm−1 and 530 cm−1 are the bending vibration and stretching vibration of the Hf–O bond, respectively, indicating that HfO2 was indeed generated after the catalyst was calcined.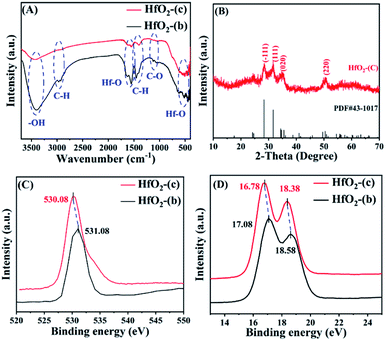 | ||
| Fig. 7 FT-IR spectra (A) of HfO2-(b) and HfO2-(c), XRD patterns (B) of HfO2-(c), and XPS patterns of O 1s (C) and Hf 4f (D). | ||
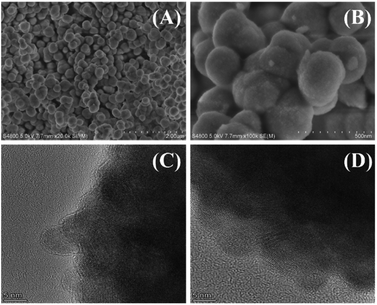
The XRD spectrum of the catalyst after calcination (Fig. 7B) showed an obvious absorption peak, which has high agreement with the standard card PDF # 43-1017 of HfO2 (ref. 48), indicating that the collected catalyst had good crystallinity after calcination. Then, the morphology of HfO2-(c) was studied by SEM and HR-TEM images. The SEM images (Fig. 8A and B) showed that HfO2-(c) comprised spherical particles with good dispersion and a uniform particle size. This is because of the role of humin as a template and as the self-assembly of the catalyst occurred before calcination, whereby the catalyst will exhibit a spherical shape after calcination to remove the humin. The HR-TEM images (Fig. 8C and D) clearly show that HfO2-(c) had different crystal orientations, which is consistent with the crystal diffraction peaks observed in the XRD images of HfO2-(c) materials.
It has been reported that the intensity of the Lewis acid–base sites in a catalyst has a great impact on the MPV reduction reaction.47,49,50 Therefore, XPS diagrams of the collected catalyst and the HfO2-(c) were analyzed to explore the changes in the intensity of the acid–base sites in the catalyst. Fig. S6† presents the XPS survey spectra, and the XPS spectra of C 1s are shown in Fig. S7,† with the binding energy of O 1s and Hf 4f in HfO2-(c) shown in Fig. 7C and D, respectively. No significant change was observed in the binding energy for C 1s of the catalysts before and after being calcination. Obviously, the binding energy of O 1s decreased after the catalyst was calcined, which may be caused by the electron cloud density around O atoms in Hf–OH (HfO2-(b)) being lower than that in Hf–O (HfO2-(c)). Therefore, the negative charge density of O atoms in HfO2-(c) was higher, thus showing a stronger Lewis basicity. Similarly, it can be seen that the Hf 4f binding energies of HfO2-(c) at 16.78 eV and 18.38 eV were slightly lower than the collected catalyst at 17.08 eV and 18.58 eV, respectively, indicating that the density of positive charges around Hf atoms in HfO2-(c) was relatively small, which resulted in the relatively low Lewis acidity.48 In the MPV reduction reaction process, the Lewis acid site is mainly used to complete the transfer hydrogenation process, and the Lewis base site mainly plays the role in activating the hydroxyl group. Therefore, it was demonstrated that HfO2-(c) can effectively catalyze the production of FA from FF.
4. Conclusions
In summary, HfCl4 was developed as an efficient bifunctional catalyst for the selective upgrading of FF to GVL with a good performance in a one-pot process. When 2-propanol was used as a hydrogen donor and solvent, the yield of GVL reached 64.2% at 453 K for 8 h. HfCl4 exhibited excellent catalytic activity due to the Lewis acidity of HfCl4 and moderate basicity of HfO(OH)2·xH2O, as well as the strong Brønsted acid generated by the in situ hydrolysis. RSM was used to optimize the reaction system, and the reaction temperature was found to have the greatest influence on the yield of GVL. This may be because the processes of transfer hydrogenation and IPL-to-GVL conversion are easier to perform at a high temperature. Apart from the hydrogen transfer process, kinetic experiments also showed that the process of IPL-to-GVL conversion was the rate-determining step for the whole course of this reaction because the removal of the isopropyl group was difficult in the cyclization process. In addition, the catalyst after the reaction was activated by HCl and could be reused with good activity. Interestingly, HfO2-(c) obtained by calcination of the recovered catalyst in the air could effectively catalyze the conversion of FF to FA through cascade conversion processes. The in situ bifunctional catalyst is promising for the catalytic hydrogen transfer of biomass-derived aldehydes/ketones in combination with other reaction steps in a single one-pot process.Conflicts of interest
There are no conflicts to declare.Acknowledgements
This work was financially supported by the National Natural Science Foundation of China (21908033, 21666008, 21576059), Fok Ying-Tong Education Foundation (161030), Program of Introducing Talents of Discipline to Universities of China (111 Program, D20023), and Guizhou Frontiers Science Center for Asymmetric Synthesis and Medicinal Molecules ([2020]004).Notes and references
- J. S. Luterbacher, J. M. Rand, D. M. Alonso, J. Han, J. T. Youngquist, C. T. Maravelias, B. F. Pfleger and J. A. Dumesic, Science, 2014, 343, 277–280 CrossRef CAS PubMed.
- W. Wu, Y. Li, H. Li, W. Zhao and S. Yang, Catalysts, 2018, 8, 264 CrossRef.
- Y. Liu, D. Chen, M. Li, H. Zhang and H. Li, Polym., 2021, 13, 2808 CAS.
- Z. Xue, J. Jiang, G. Li, W. Zhao, J. Wang and T. Mu, Catal. Sci. Technol., 2016, 6, 5374–5379 RSC.
- H. Li, W. Zhao and Z. Fang, Appl. Catal., B, 2017, 215, 18–27 CrossRef CAS.
- H. Liu, X. Cao, X. Tang, X. Zeng, Y. Sun, X. Ke and L. Lin, Green Chem., 2021, 23, 1983–1988 RSC.
- L. Peng, M. Wang, H. Li, J. Wang, J. Zhang and L. He, Green Chem., 2020, 22, 5656–5665 RSC.
- X. Tang, H. Chen, L. Hu, W. Hao, Y. Sun, X. Zeng, L. Lin and S. Liu, Appl. Catal., B, 2014, 147, 827–834 CrossRef CAS.
- H. Jin, X. Liu, Y. Ban, Y. Peng, W. Jiao, P. Wang, A. Guo, Y. Li and W. Yang, Chem. Eng. J., 2016, 305, 12–18 CrossRef CAS.
- J. Li, S. Zhao, Z. Li, D. Liu, Y. Chi and C. Hu, Inorg. Chem., 2021, 60, 7785–7793 CrossRef CAS PubMed.
- D. M. Alonso, S. G. Wettstein and J. A. Dumesic, Green Chem., 2013, 15, 584 RSC.
- K. Yan, Y. Yang, J. Chai and Y. Lu, Appl. Catal., B, 2015, 179, 292–304 CrossRef CAS.
- J. Han, ACS Sustainable Chem. Eng., 2017, 5, 1892–1898 CrossRef CAS.
- J. He, H. Li, Y.-M. Lu, Y.-X. Liu, Z.-B. Wu, D.-Y. Hu and S. Yang, Appl. Catal., A, 2016, 510, 11–19 CrossRef CAS.
- J. Ohyama, Y. Hayashi, K. Ueda, Y. Yamamoto, S. Arai and A. Satsuma, J. Phys. Chem. C, 2016, 120, 15129–15136 CrossRef CAS.
- M. Nemanashi, J.-H. Noh and R. Meijboom, Appl. Catal., A, 2018, 550, 77–89 CrossRef CAS.
- C. Xiao, T.-W. Goh, Z. Qi, S. Goes, K. Brashler, C. Perez and W. Huang, ACS Catal., 2016, 6, 593–599 CrossRef CAS.
- C. Ortiz-Cervantes, M. Flores-Alamo and J. J. García, ACS Catal., 2015, 5, 1424–1431 CrossRef CAS.
- S. Wang, H. Huang, V. Dorcet, T. Roisnel, C. Bruneau and C. Fischmeister, Organometallics, 2017, 36, 3152–3162 CrossRef CAS.
- S. Zhu, Y. Xue, J. Guo, Y. Cen, J. Wang and W. Fan, ACS Catal., 2016, 6, 2035–2042 CrossRef CAS.
- H. P. Winoto, Z. A. Fikri, J. Ha, Y. Park, H. Lee, D. J. Suh and J. Jae, Appl. Catal., B, 2019, 241, 588–597 CrossRef CAS.
- B. Srinivasa Rao, P. Krishna Kumari, P. Koley, J. Tardio and N. Lingaiah, Mol. Catal., 2019, 466, 52–59 CrossRef CAS.
- T. Zhang, Y. Lu, W. Li, M. Su, T. Yang, A. Ogunbiyi and Y. Jin, Int. J. Hydrogen Energy, 2019, 44, 14527–14535 CrossRef CAS.
- Y. Shao, Q. Li, X. Dong, J. Wang, K. Sun, L. Zhang, S. Zhang, L. Xu, X. Yuan and X. Hu, Fuel, 2021, 293, 120457 CrossRef CAS.
- L. Zhang, G. Xi, Z. Chen, D. Jiang, H. Yu and X. Wang, Chem. Eng. J., 2017, 307, 868–876 CrossRef CAS.
- H. J. Cho, D. Kim and B. Xu, ACS Catal., 2020, 10, 4770–4779 CrossRef CAS.
- P. Hou, M. Ma, P. Zhang, J. Cao, H. Liu, X. Xu, H. Yue, G. Tian and S. Feng, New J. Chem., 2021, 45, 2715–2722 RSC.
- Y. Shao, K. Sun, Q. Li, Q. Liu, S. Zhang, Q. Liu, G. Hu and X. Hu, Green Chem., 2019, 21, 4499–4511 RSC.
- K. D. Kim, J. Kim, W. Y. Teoh, J.-C. Kim, J. Huang and R. Ryoo, RSC Adv., 2020, 10, 35318–35328 RSC.
- W. Li, Z. Cai, H. Li, Y. Shen, Y. Zhu, H. Li, X. Zhang and F. Wang, Mol. Catal., 2019, 472, 17–26 CrossRef CAS.
- L. Ye, Y. Han, H. Bai and X. Lu, ACS Sustainable Chem. Eng., 2020, 8, 7403–7413 CrossRef CAS.
- W. Li, M. Li, H. Liu, W. Jia, X. Yu, S. Wang, X. Zeng, Y. Sun, J. Wei, X. Tang and L. Lin, Mol. Catal., 2021, 506, 111538 CrossRef CAS.
- J. Iglesias, J. A. Melero, G. Morales, M. Paniagua, B. Hernández, A. Osatiashtiani, A. F. Lee and K. Wilson, Catal. Sci. Technol., 2018, 8, 4485–4493 RSC.
- S. Rojas-Buzo, P. García-García and A. Corma, ChemSusChem, 2018, 11, 432–438 CrossRef CAS PubMed.
- Q. Peng, H. Wang, Y. Xia and X. Liu, Appl. Catal., A, 2021, 621, 118203 CrossRef CAS.
- H. Li, T. Yang and Z. Fang, Appl. Catal., B, 2018, 227, 79–89 CrossRef CAS.
- Y. Fan, C. Zhuang, S. Li, Y. Wang, X. Zou, X. Liu, W. Huang and G. Zhu, J. Mater. Chem. A, 2021, 9, 1110–1118 RSC.
- C. Xie, J. Song, B. Zhou, J. Hu, Z. Zhang, P. Zhang, Z. Jiang and B. Han, ACS Sustainable Chem. Eng., 2016, 4, 6231–6236 CrossRef CAS.
- Z. Wang, X. Wang, C. Zhang, M. Arai, L. Zhou and F. Zhao, Mol. Catal., 2021, 508, 111599 CrossRef CAS.
- S. H. Liu, S. Jaenicke and G. K. Chuah, J. Catal., 2002, 206, 321–330 CrossRef CAS.
- S. Zhou, F. Dai, Z. Xiang, T. Song, D. Liu, F. Lu and H. Qi, Appl. Catal., B, 2019, 248, 31–43 CrossRef CAS.
- H. Y. Luo, D. F. Consoli, W. R. Gunther and Y. Román-Leshkov, J. Catal., 2014, 320, 198–207 CrossRef CAS.
- A. H. Valekar, M. Lee, J. W. Yoon, J. Kwak, D.-Y. Hong, K.-R. Oh, G.-Y. Cha, Y.-U. Kwon, J. Jung, J.-S. Chang and Y. K. Hwang, ACS Catal., 2020, 10, 3720–3732 CrossRef CAS.
- M. Inger, A. Dobrzyńska-Inger, J. Rajewski and M. Wilk, Catalysts, 2019, 9, 249 CrossRef.
- D. N. Awang Chee, F. Aziz, M. A. Mohamed Amin and A. F. Ismail, Arabian J. Sci. Eng., 2021, 46, 6775–6785 CrossRef CAS.
- H. Zhang, H. Li, H. Pan, A. Wang, S. Souzanchi, C. Xu and S. Yang, Appl. Energy, 2018, 223, 416–429 CrossRef CAS.
- H. Li, Y. Li, Z. Fang and R. L. Smith, Catal. Today, 2019, 319, 84–92 CrossRef CAS.
- J. Manikantan, H. B. Ramalingam, B. C. Shekar, B. Murugan, R. R. Kumar and J. S. Santhoshi, Adv. Powder Technol., 2017, 28, 1636–1646 CrossRef CAS.
- J. He, Y. Xu, Z. Yu, H. Li, W. Zhao, H. Wu and S. Yang, Sustainable Energy Fuels, 2020, 4, 3102–3114 RSC.
- J. He, H. Li, Y. Xu and S. Yang, Renew. Energ., 2020, 146, 359–370 CrossRef CAS.
Footnote |
| † Electronic supplementary information (ESI) available. See DOI: 10.1039/d1ra05637a |
| This journal is © The Royal Society of Chemistry 2021 |

