DOI:
10.1039/D1RA05503H
(Paper)
RSC Adv., 2021,
11, 35205-35214
Polypyrrole nanoparticles embedded nitrogen-doped graphene composites as novel cathode for long life cycles and high-power zinc-ion hybrid supercapacitors†
Received
18th July 2021
, Accepted 19th October 2021
First published on 1st November 2021
Abstract
The well-designed network structure of synthetic polypyrrole (PPy) nanoparticles embedded on a nitrogen-doped graphene (N-rGO) surface was utilized as a cathode for aqueous zinc-ion hybrid supercapacitors. Owing to the combination of the redox surface of PPy and the two-dimensional network structure of N-rGO, the PPy/N-rGO cathode affords rapid transport channels for Zn2+ ion adsorption/desorption and a faradaic reaction toward the synergistic composite materials. Subsequently, the constructed zinc-ion hybrid supercapacitors with the optimized PPy/N-rGO cathode composites deliver the highest capacity of 145.32 mA h g−1 at 0.1 A g−1 and the maximum energy density of 232.50 W h kg−1 at a power density of 160 W kg−1. Besides this, excellent cycling stability of 85% retention after 10![[thin space (1/6-em)]](https://www.rsc.org/images/entities/char_2009.gif) 000 charge–discharge cycles at 7.0 A g−1 was achieved. The high-rate capabilities with long life cycle performance of these novel zinc-ion hybrid supercapacitors could find practical use in a wide range of applications, ranging from next-generation electronic devices to large-scale stationary energy storage.
000 charge–discharge cycles at 7.0 A g−1 was achieved. The high-rate capabilities with long life cycle performance of these novel zinc-ion hybrid supercapacitors could find practical use in a wide range of applications, ranging from next-generation electronic devices to large-scale stationary energy storage.
1. Introduction
Recently, the tremendous increase in the demand for energy storage has attracted attention because of the concerns about the environmental impact of fossil fuels, and the need to develop sustainable green energy and highly efficient energy resources, as well as energy conversion and energy storage technologies. Besides this, the continual development of next-generation electrical devices, electric vehicles, and large electrical grids, for intermittent energy resources including wind and solar radiation, have driven the development of energy-efficient storage systems, in terms of their high-performance, safety, long life cycles, fast charge features, and so on.1,2 Electrochemical energy storage (EES) is regarded as a promising technology to store electrical energy obtained from renewable and sustainable energy resources. Among the various EES technologies, lithium-ion batteries (LIBs) have been intensively used in a multitude of applications due to their high energy density and high potential voltage operation.3 Nonetheless, the high increasing demands on increasing lithium are reducing its availability as a resource, limiting its further development for use in large-scale applications.4 It is critical to note that there are issues with lithium-ion batteries in terms of their life-cycle performance, safety, and environmental pollution in the form of their organic electrolytes.
Various aqueous-based rechargeable batteries with other metal-ion charge carriers (i.e., Li+, Na+, K+, Ca+, Zn2+, Mg2+, and Al3+) have emerged as alternatives to Li-ion batteries.5,6 Among them, zinc-ion batteries (ZIBs) exhibit a high theoretical gravimetric capacity (820 mA h g−1) and volumetric capacity (5845 mA h L−1), are low in cost, show intrinsic non-flammability due to their aqueous electrolyte, and are environmentally friendly.7 Over the past decade, many challenges have been set to produce ZIBs through comparisons with LIBs. Several cathode materials, including manganese oxides, vanadium oxides and Prussian blue, have been developed based on conversion and intercalation reactions. Nevertheless, unfavorable issues, from phase transitions, structural changes, and side reactions during the charge/discharge process of these cathode materials, are observed, which decrease the life cycles of the resultant ZIBs.7,8
Zinc-ion hybrid supercapacitors (ZIHSCs) were originally developed from the combination of a battery-type faradaic electrode as an energy density source and a capacitive-type electrode as a power density source. Interestingly, the high ionic conductivity of aqueous electrolytes is favorable for achieving ZIHSCs with a high-power energy output.9 Unlike those of ZIBs, the cathode materials of ZIHSCs mainly store charge based on a SC mechanism, classifying them as electric double-layer capacitors (EDLCs) and pseudocapacitors (PCs). Several cathode materials have been developed for ZIHSCs based on capacitive-type materials, including active carbon materials,10,11 conductive polymers12 and redox materials grafted on carbon.13 However, these materials still have limitations in terms of their low energy density and short voltage operation due to their capacitive-type characteristics.
Graphene, a honeycomb lattice structure consisting of single-layer of sp2-hybridized carbon atoms, has been explicitly proven to be a forefront potential material for energy storage technologies owing to its high electronic conductivity, large specific surface area, and modified architecture structures.14 In fact, carbon-based material cathodes generally store Zn2+ only by electro-absorption, with a capacity limitation of 80–120 mA h g−1.10 Furthermore, the stacking of graphene sheets during their fabrication results in a decrease in surface area, which limits the Zn2+ storage energy of graphene. To enhance its electrochemical storage, many researchers have taken advantage of the use of heteroatom (i.e., boron, nitrogen, sulfur, and phosphorus) doping on carbon to boost the electrochemical properties of graphene, leading to an enhancement in its surface redox reactions and functional conductivity.15–17 Furthermore, to achieve capacitive-type materials with good electrochemical properties, the combination of hybrid SCs (EDLCs and PCs) with optimized features, such as high surface area, electroactive properties and good electrical conductivity, is a key concept for designing synergistic composite materials for SC and ZIHSC cathode applications.18–20 Conducting polymers (such as polypyrrole, polyaniline, etc.) are well known as PCs, which have Zn2+ storage ability for ZIHSCs by participating in redox reactions. However, this class of materials suffers from stability issues due to the irreversible redox reactions that occur during the cycling process.
Methods, including the development of composite nanomaterials by integrating a conductive polymer with a carbon matrix, have been widely studied for electrode materials of SCs18,21 and metal-ion batteries.22 However, to the best of our knowledge, there have been no reports on the use of polypyrrole (PPy) combined with nitrogen-doped graphene (N-rGO) for ZIHSCs. Herein, we firstly demonstrate a zinc-ion hybrid supercapacitor through the direct design of Zn foil as both an anode and current collector, and synthetic PPy nanoparticle-embedded N-rGO as a promising material for a ZIHSC cathode. Subsequently, this hybrid material cathode composed of a PPy/N-rGO composite is viewed as a potentially ideal candidate for high-rate performance long-life cycle ZIHSC applications.
2. Experimental procedures
2.1 Materials
Zinc foil (100 μm thickness) was purchased from Alfa Aesar. Pyrrole (99% purity, Sigma-Aldrich) was distilled under reduced pressure and stored in the dark before use. A glass fiber separator (GF-C) was purchased from Whatman. Other chemicals and reagents were of analytical grade and used as received without any further purification.
2.2 The preparation of nitrogen-doped reduced graphene oxide
Graphene oxide (GO) was synthesized using modified Hummers' method, as described elsewhere.23 Briefly, 3.0 g of graphite and 1.5 g of NaNO3 were mixed with 69 ml of concentrated H2SO4 at 4 °C. KMnO4 (9.0 g) was firstly added at 35 °C for 7 h and added again at 50 °C for 7 h. Subsequently, the mixture was gradually poured into 500 ml of deionized water with 6 ml of H2O2. The filtered products were washed several times with 10% w/v HCl, purified by dialysis and dried at 60 °C for 24 h to obtain graphite oxide powder. In order to obtain N-rGO, graphite oxide was dispersed in deionized water (1 mg ml−1) in an ultrasonic bath at 50 Hz for 6 h to obtain exfoliated GO. The as-prepared GO was further refluxed with an equivalent weight of melamine for 3 h. Then, the obtained N-rGO powder was obtained after filtration and a freeze-drying process.
2.3 The preparation of nitrogen-doped reduced graphene oxide/polypyrrole composites
1.0 mg ml−1 of N-rGO was dispersed in 50 ml of an aqueous solution of 0.1 M sodium dodecyl sulfate with the aid of an ultrasonic bath at 50 Hz for 3 h. Then, equivalent moles of pyrrole monomer and ferric chloride were added to the dispersed N-rGO aqueous solution. Subsequently, in situ polymerization was carried out and stirring was maintained at room temperature for 24 h. Finally, the mixture was washed with water and ethanol several times. The N-rGO/PPy product was obtained after a freeze-drying process. A similar process was performed at different weight ratios of N-rGO to PPy of 1:1, 2:1, 4:1, 6:1 and 8:1, denoted as N-rGO1/PPy1, N-rGO2/PPy1, N-rGO4/PPy1, N-rGO6/PPy1 and N-rGO8/PPy1, respectively.
2.4 Fabrication of the zinc-ion hybrid capacitor Zn//N-rGO/PPy
The zinc-ion hybrid capacitor Zn//N-rGO/PPy was assembled using a typical CR2032 coin cell structure using zinc foil as an anode (100 μm thickness) and N-rGO/PPy as an active material cathode. Cathode materials comprising 80 wt% N-rGO/PPy, 10 wt% conductive carbon, and 10 wt% polytetrafluoroethylene (PTFE) were mixed with ethanol to form a slurry coating. Then, the coating material was pasted onto carbon fiber paper with a specific mass loading of 1.0–1.2 mg cm−2. A zinc anode and N-rGO/PPy cathode were assembled into a CR2032 cell with 2.0 M ZnSO4 aqueous solution as the electrolyte and commercial glass fiber as the separator.
2.5 Characterization
The morphologies of rGO, N-rGO, PPy and PPy/rGO samples were characterized by scanning electron microscopy (SEM: JSM-6480LV) and transmission electron microscopy (TEM: EM, Hitachi H-7650). Nitrogen adsorption–desorption isotherms were measured using the Brunauer–Emmett–Teller (BET: Micromeritics 3 Flex 3500) method employing high purity nitrogen gas at 77 K. The pore size distribution of the pores was evaluated by non-local density functional theory (NLDFT). X-ray photoelectron spectroscopy (XPS: AXIS ultra DLD) was conducted to analyze the chemical binding energies of PPy/rGO. Fourier-transform infrared spectroscopy (FTIR: Nicolet 6700, Thermo Fisher Scientific) was performed in the wavelength range of 4000–400 cm−1 to confirm the chemical structures of the samples using the KBr method.
2.6 Electrochemical measurements
To evaluate the electrochemical performance of the Zn//N-rGO/PPy samples, cyclic voltammetry (CV) was carried out on CR2032 coin samples on an electrochemical measurement system (Metrohm, Autolab PGSTAT204, Netherlands) at a scan rate of 5 mV s−1 in the voltage range of 1.0–1.6 V versus Zn2+/Zn. A coin cell battery tester (BTS-4000, Neware, China) was used to investigate the capacity performance and rate performance of the samples. The evaluated capacity values were calculated based on the mass loading of the cathode material. A CV study to investigate the charge mechanism of the samples was tested at scan rates from 2.0 to 10.0 mV s−1 between 0 and 1.6 V.
3. Results and discussion
3.1 Morphology study
Representative SEM micrographs of the surface morphologies of the N-rGO, PPy and N-rGO/PPy composite samples are shown in Fig. 1. N-rGO exhibits a two-dimensional sheet structure with a wrinkled surface (Fig. 1A). The as-synthesized PPy presents an agglomerated nanoparticle structure with a diameter in the range of 50–200 nm (Fig. 1B). All of the N-rGO/PPy composite samples reveal the corresponding surface morphology of the PPy nanoparticles embedded on the N-rGO surface, depending on the ratios of N-rGO to PPy, as displayed in Fig. 1C–G. At N-rGO to PPy ratios of 1:1 and 2:1, the PPy nanoparticles reveal a densely agglomerated structure embedded on the N-rGO surface, as seen in Fig. 1C and D, respectively. Obviously, the decrease in the PPy content tends to decrease the packing density of the agglomerated PPy nanoparticles embedded on the N-rGO surface (Fig. 1E). At an N-rGO/PPy ratio of 4:1, the PPy nanoparticles are dispersed on interconnected N-rGO sheets, which is beneficial for faradaic reaction and leads to a good synergistic structure. The pseudocapacitive behavior and ion/charge diffusion were enhanced, participating in a charge/discharge process. Upon continuing to decrease the PPy content, a few traces of PPy nanoparticles on the N-rGO surface were observed, as demonstrated in rGO6/PPy1 (Fig. 1F) and N-rGO8/PPy1 (Fig. 1G). Furthermore, energy-dispersive X-ray (EDX) spectroscopy was further performed to analyze the elemental compositions of the PPy/N-rGO samples at various PPy/N-rGO ratios. Fig. 1H presents the elemental mapping results of the N, C and O elements on the surface of the N-rGO4/PPy1 composite sample, confirming the elemental compositions of PPy and N-rGO. Table 1 exhibits the corresponding feed ratio of PPy to N-rGO according to the actual surface elements, revealing the increase in the % N with increasing PPy content. This result suggests the successful incorporation of PPy into N-rGO.
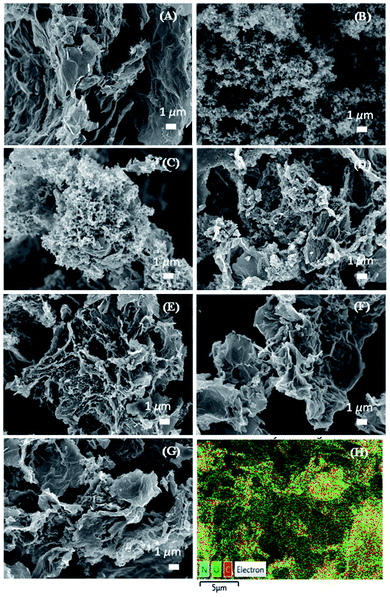 |
| | Fig. 1 Representative SEM micrographs of (A) N-rGO, (B) PPy, (C) N-rGO1/PPy1, (D) N-rGO2/PPy1, (E) N-rGO4/PPy1, (F) N-rGO6/PPy1, (G) N-rGO8/PPy1, and (H) elemental color mapping of N-rGO4/PPy1. | |
Table 1 Element compositions of the N-rGO/PPy samples at different ratios
| Samples |
% element |
| C |
N |
O |
| N-rGO1:PPy1 |
69.91 |
14.66 |
15.43 |
| N-rGO2:PPy1 |
68.59 |
12.90 |
18.51 |
| N-rGO4:PPy1 |
18.62 |
11.70 |
18.62 |
| N-rGO6:PPy1 |
71.08 |
9.41 |
19.51 |
| N-rGO8:PPy1 |
74.55 |
8.03 |
17.42 |
| N-rGO |
71.08 |
9.41 |
19.51 |
| PPy |
72.34 |
16.34 |
11.33 |
TEM observations of PPy and N-rGO/PPy samples were further carried out, as shown in Fig. 2. The as-synthesized PPy reveals individual PPy nanoparticles with a diameter ranging from 50–150 nm (Fig. 2A). For the N-rGO/PPy samples, the growth of nanostructured PPy on the N-rGO surface was observed, corresponding to the ratio of N-rGO to PPy. At an N-rGO:PPy ratio of 4:1, good distribution of the PPy nanostructure embedded on the N-rGO surface is illustrated (Fig. 2B). In contrast, at a high PPy content, N-rGO1/PPy1, as shown in Fig. 2C, reveals an interconnected PPy nanostructure on the N-rGO surface, occurring from the growth of individual PPy particles (Fig. 2D).
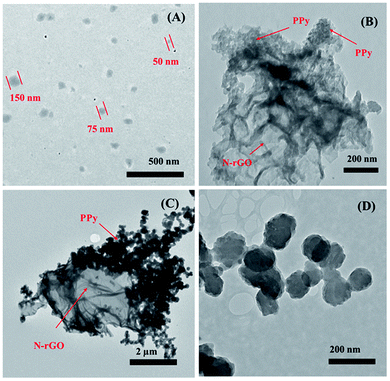 |
| | Fig. 2 Representative TEM images of (A) PPy nanoparticles, (B) N-rGO4/PPy1, (C) N-rGO1/PPy1, and (D) the interconnected PPy nanostructure of the N-rGO1/PPy1 sample. | |
3.2 Characterization
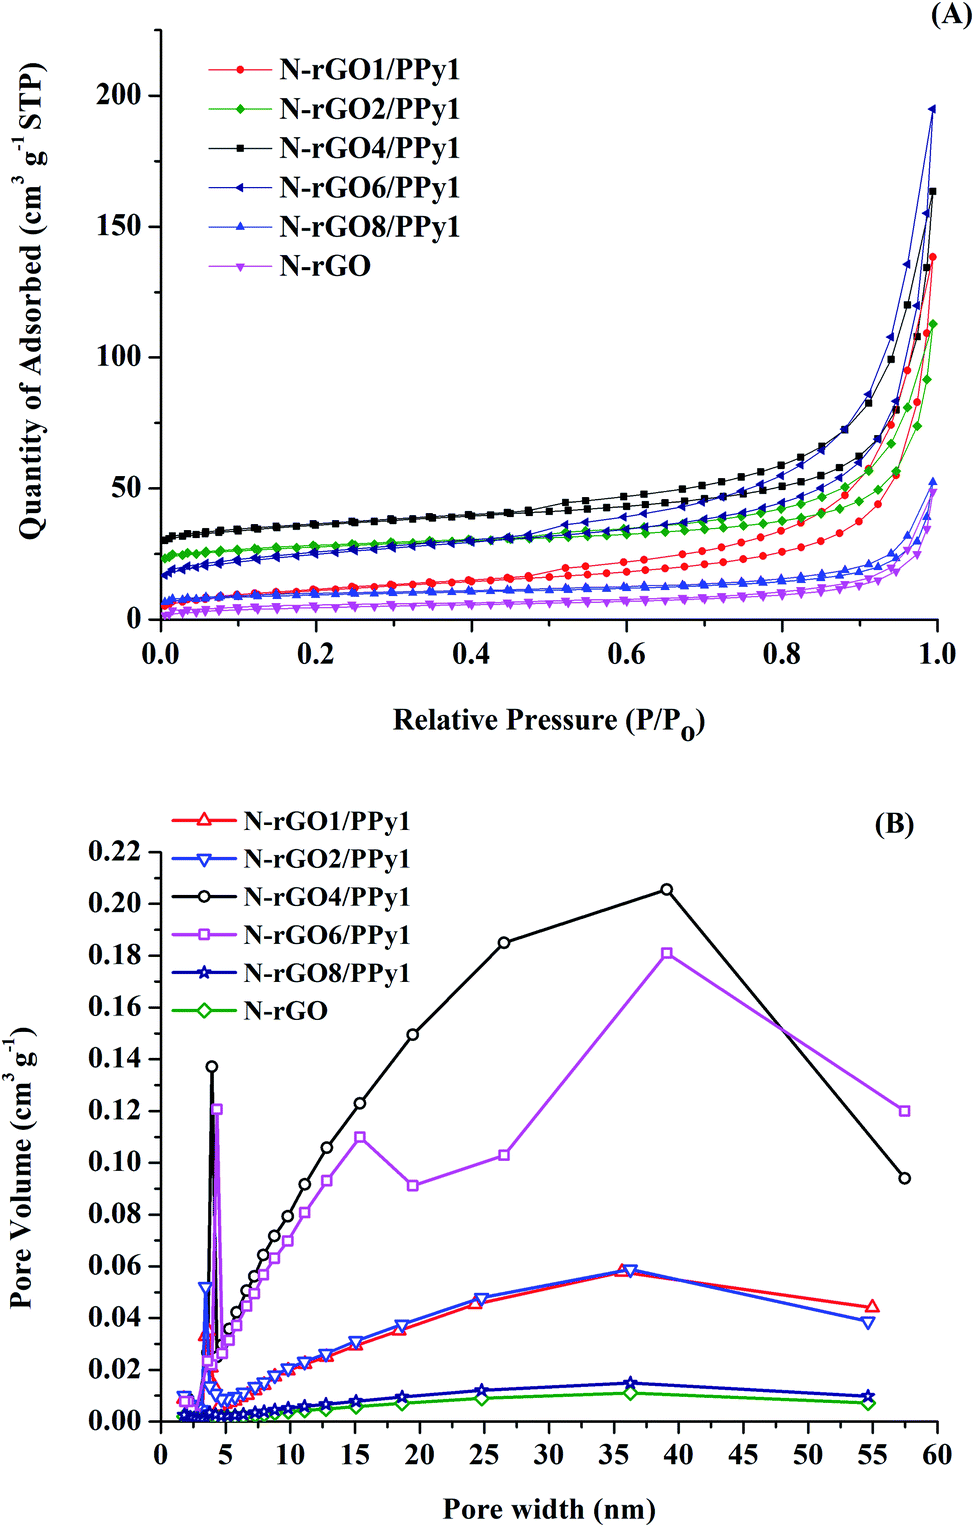
The Brunauer–Emmett–Teller (BET) nitrogen adsorption method was used to determine the surface areas of the N-rGO and N-rGO/PPy samples. According to IUPAC classification, the nitrogen adsorption/desorption isotherm shown in Fig. 3A is a type IV isotherm with a H3 hysteresis loop at P/P0 > 0.5. With increasing PPy content on the N-rGO surface, the hysteresis loop with a H3 shape is obviously enhanced, suggesting the presence of slit-shaped pores or assemblies of graphitic sheet-PPy interlayers with a mesoporous size.20,24 The well-developed PPy embedded on the N-rGO surface greatly improves the specific surface area of the composite materials. The specific surface area of the N-rGO/PPy sample increases from 24.23 to 89.82 m2 g−1 with increasing PPy content from N-rGO8/PPy1 to N-rGO4/PPy1, respectively. The insertion of PPy nanostructures on the N-rGO sheet at the optimized content prevents the stacking of N-rGO at the interface layer, boosting the generation of mesopore-dominated architectures.25 However, at high PPy content, a decrease in the specific surface area is observed for N-rGO2/PPy1 (51.45 m2 g−1) and N-rGO1/PPy1 (41.395 m2 g−1). These results are consistent with the SEM and TEM results, demonstrating the occurrence of aggregated PPy nanostructures on the N-rGO surface at high PPy content. Fig. 3B shows the Barrett–Joyner–Halenda (BJH) desorption pore distribution plots of the N-rGO and N-rGO/PPy samples. It is seen that the increase in the relative amounts of mesopores in the N-rGO/PPy samples is in line with the trend in the specific surface area. With an increase in the PPy content in the composites up to N-rGO4/PPy1, an increase in larger mesopore-dominant architectures can be observed. This phenomenon can be attribute to improving the sites of partial overlapped/stacked N-rGO sheets due to the good distribution of PPy nanostructures on the N-rGO sheets. However, at a high PPy content (N-rGO2/PPy1 and N-rGO1/PPy1), the ordinate values in the desorption pore distribution plots are decreased, arising from the aggregation of PPy nanostructures on the N-rGO sheets.
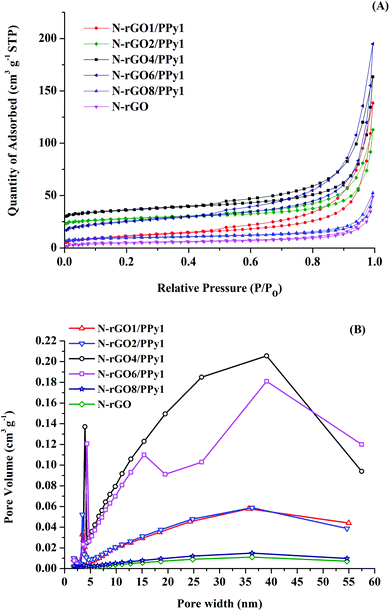 |
| | Fig. 3 (A) N2 sorption isotherms of N-rGO and N-rGO/PPy at various N-rGO/PPy ratios, and (B) BJH desorption pore distribution plots of the samples. | |
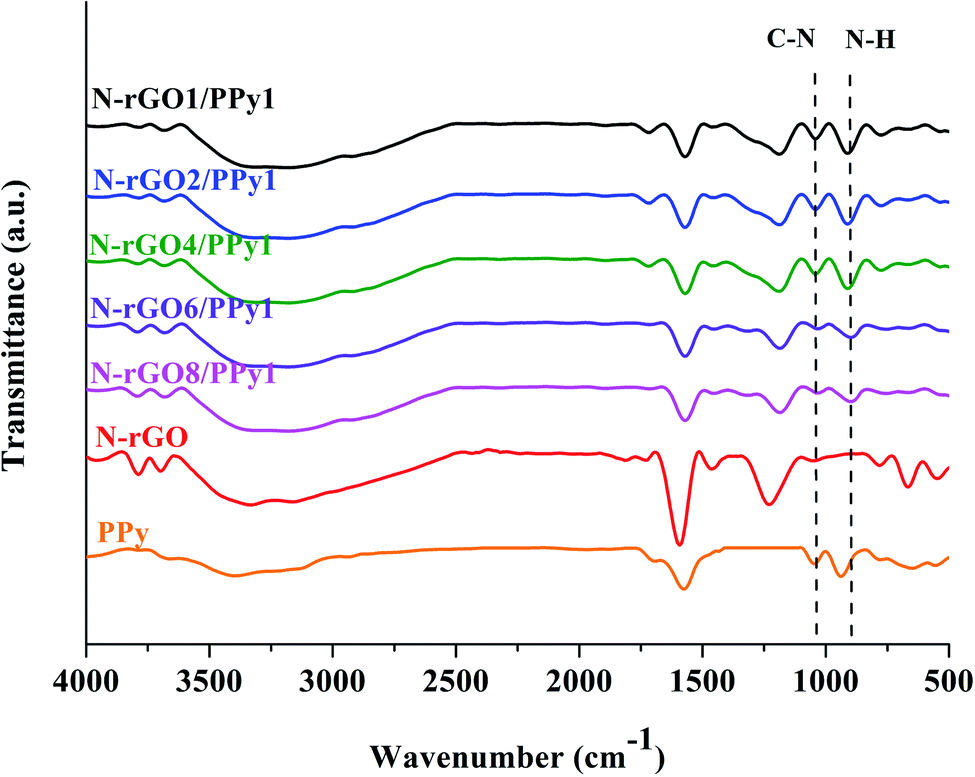
FTIR spectra of the N-rGO, PPy, and N-rGO/PPy composites are shown in Fig. 4. In the N-rGO spectrum, the peaks at 3300, 1595 and 1190 cm−1 can be assigned to OH stretching vibrations, C![[double bond, length as m-dash]](https://www.rsc.org/images/entities/char_e001.gif) C stretching and epoxide (C–O–C) bond stretching, respectively. The peaks at 1043 cm−1 can be assigned to the stretching vibrations of C–N.26 In the PPy spectrum, the peaks at 1637 and 1575 cm−1 can be identified as characteristic peaks of the CC stretching and –C–H bending of the pyrrole ring, respectively. The peaks at 1043 and 903 cm−1 correspond to the C–N stretching of the pyrrole ring and the in-plane deformation vibration of N–H, respectively.18 For the N-rGO/PPy composites, the spectra obviously displays the characteristics of both PPy and N-rGO. It can be clearly seen that the increase in the PPy content of N-rGO appears to increase the intensity of the C–N (1043 cm−1) and N–H (903 cm−1) peaks, confirming the successful increase in the PPy content in the N-rGO matrix. Furthermore, the broad center peak of the CC stretching (1560 cm−1) and the strong intense C–H stretching (1175 cm−1) peak evidently indicate the combination of signals from the pyrrole and benzene rings of N-rGO.
C stretching and epoxide (C–O–C) bond stretching, respectively. The peaks at 1043 cm−1 can be assigned to the stretching vibrations of C–N.26 In the PPy spectrum, the peaks at 1637 and 1575 cm−1 can be identified as characteristic peaks of the CC stretching and –C–H bending of the pyrrole ring, respectively. The peaks at 1043 and 903 cm−1 correspond to the C–N stretching of the pyrrole ring and the in-plane deformation vibration of N–H, respectively.18 For the N-rGO/PPy composites, the spectra obviously displays the characteristics of both PPy and N-rGO. It can be clearly seen that the increase in the PPy content of N-rGO appears to increase the intensity of the C–N (1043 cm−1) and N–H (903 cm−1) peaks, confirming the successful increase in the PPy content in the N-rGO matrix. Furthermore, the broad center peak of the CC stretching (1560 cm−1) and the strong intense C–H stretching (1175 cm−1) peak evidently indicate the combination of signals from the pyrrole and benzene rings of N-rGO.
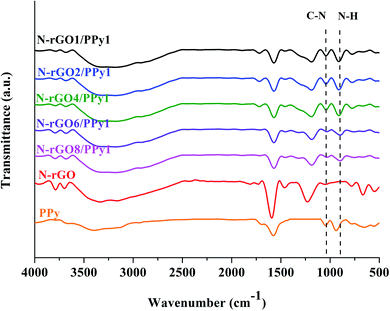 |
| | Fig. 4 FT-IR spectra of PPy, N-rGO, and N-rGO/PPy samples at various N-rGO/PPy ratios. | |
XPS was further adopted to analyze the chemical binding energies of the N-rGO/PPy sample. As seen in Fig. 5A, N-rGO/PPy exhibits a predominant peak in the C 1s region at 284.5 eV, which can be deconvoluted into five different chemical binding energies. The deconvoluted signals at 284.5, 285.4, 286.5, 287.7 and 288.5 eV can be identified as the energy bonding characteristics of C–C, C–N, C–O, CO and O–CO, respectively.27 Besides this, N-rGO/PPy also reveals three Gaussian components of N 1s deconvolution at 400.2, 398.9 and 397.6 eV, assigned to oxidized/protonated amine (–NH+–), neutral N (N–H) and imine-like nitrogen (N–), respectively (Fig. 5B). These results are in good agreement with many reports on N-rGO, PPy and N-rGO/PPy composites.15,18
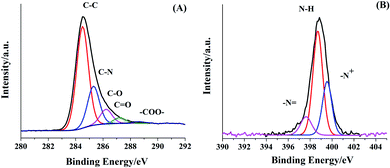 |
| | Fig. 5 XPS spectra of N-rGO/PPy sample for (A) C 1s spectra, and (B) N 1s spectra. | |
3.3 Electrochemical measurements
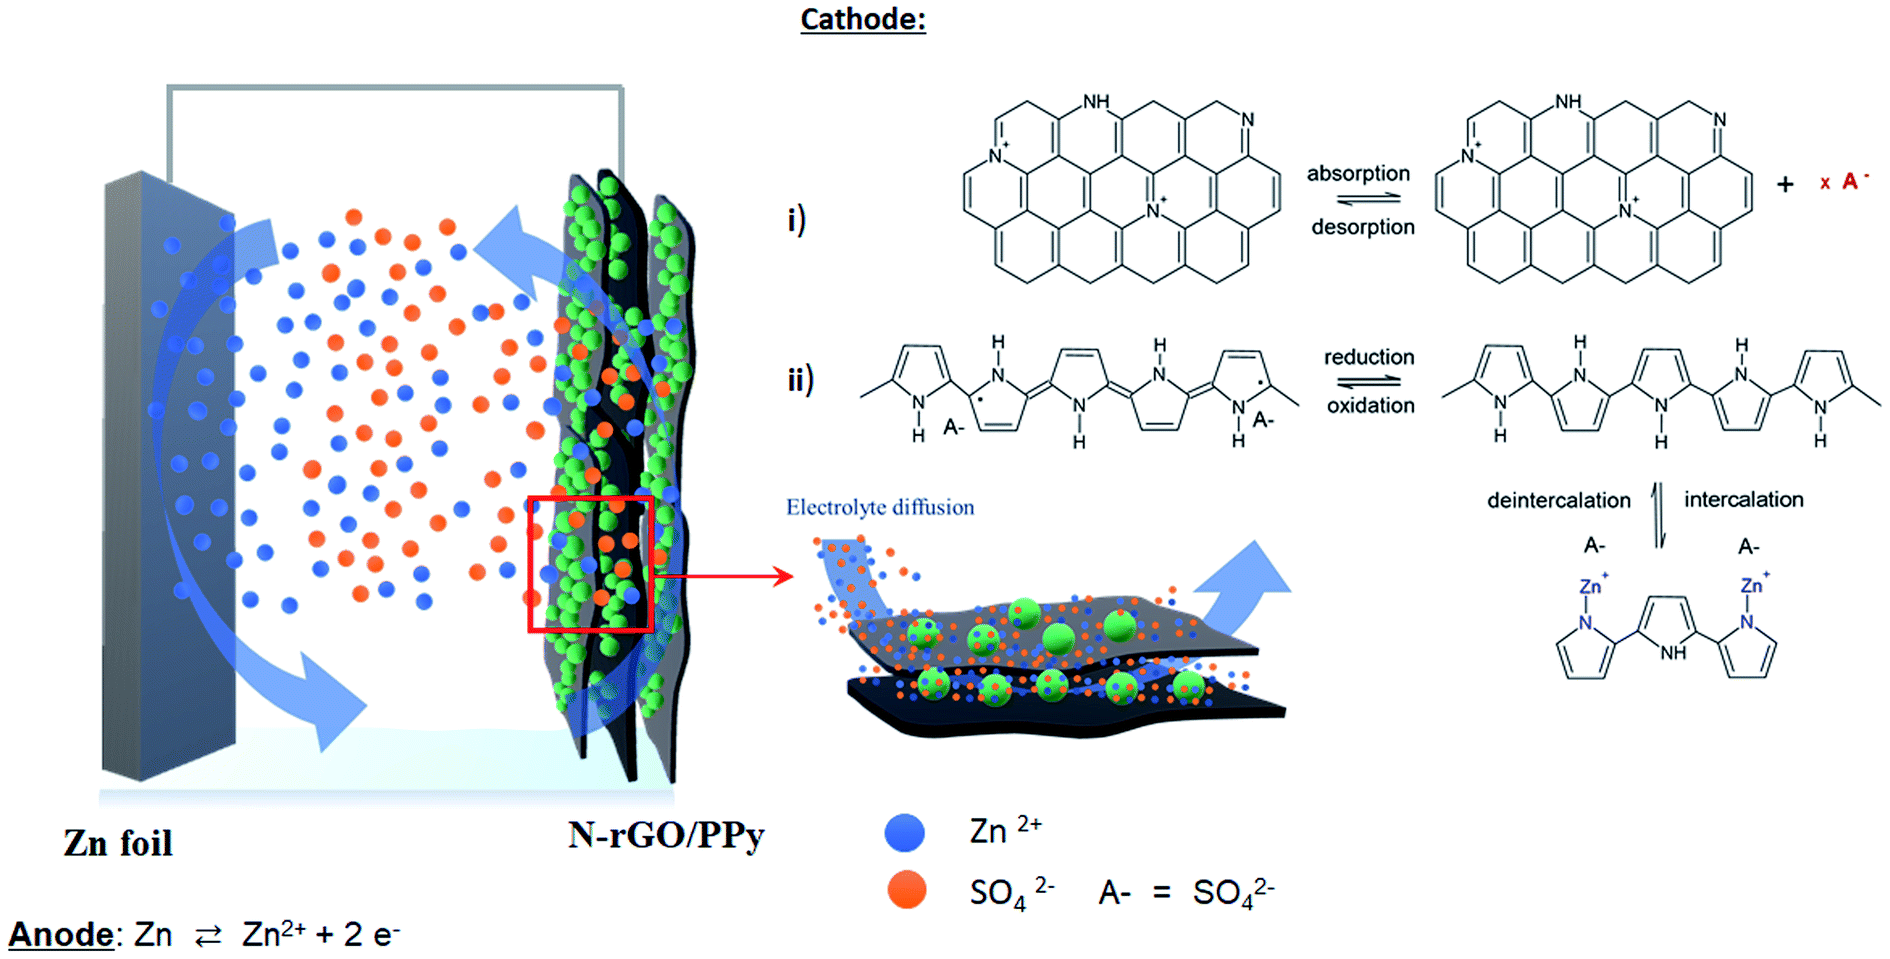
Fig. 6 shows the configuration of the designed electrode samples for the ZIHSCs in this study, comprising zinc foil as an anode and the as-synthesized N-rGO/PPy samples as a cathode in 0.2 M ZnSO4 aqueous electrolyte. It is essential to note that Zn2+ ions dissolve from the zinc anodic electrode, which was pretreated in ZnSO4 aqueous electrolyte and solvated in the form of solvated Zn2+ ions during the discharge process. The N-rGO/PPy cathode undergoes two characteristic mechanisms: (i) electro-adsorption of Zn2+ ions on the N-rGO surface and (ii) the intercalation of Zn2+ ions into the PPy structure via a redox reaction. In contrast, when the charging process begins, the Zn2+ ions are de-intercalated/de-absorbed from the N-rGO/PPy electrode, solvated with counter ions and reduced to Zn on the Zn electrode. The electrochemical reactions can also be expressed as in eqn (1) for the Zn electrode and eqn (2) for the PPy on the N-rGO surface electrode:28,29| | |
[PPy]n + nySO42− ⇄ [PPyy+(SO42−)y]n + nye− ⇄ [PPyy+(Zn2+)y(SO42−)y]n
| (2) |
where y is the degree of doping and n is the repeated unit.
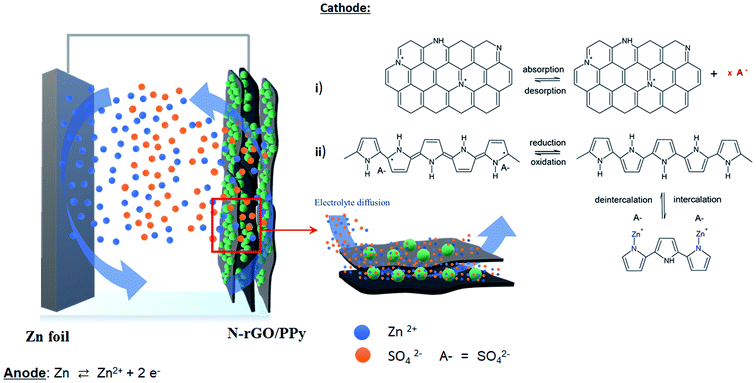 |
| | Fig. 6 Schematic of the possible mechanism of the designed PPy/N-rGO cathode composites for a ZIHSC system. | |
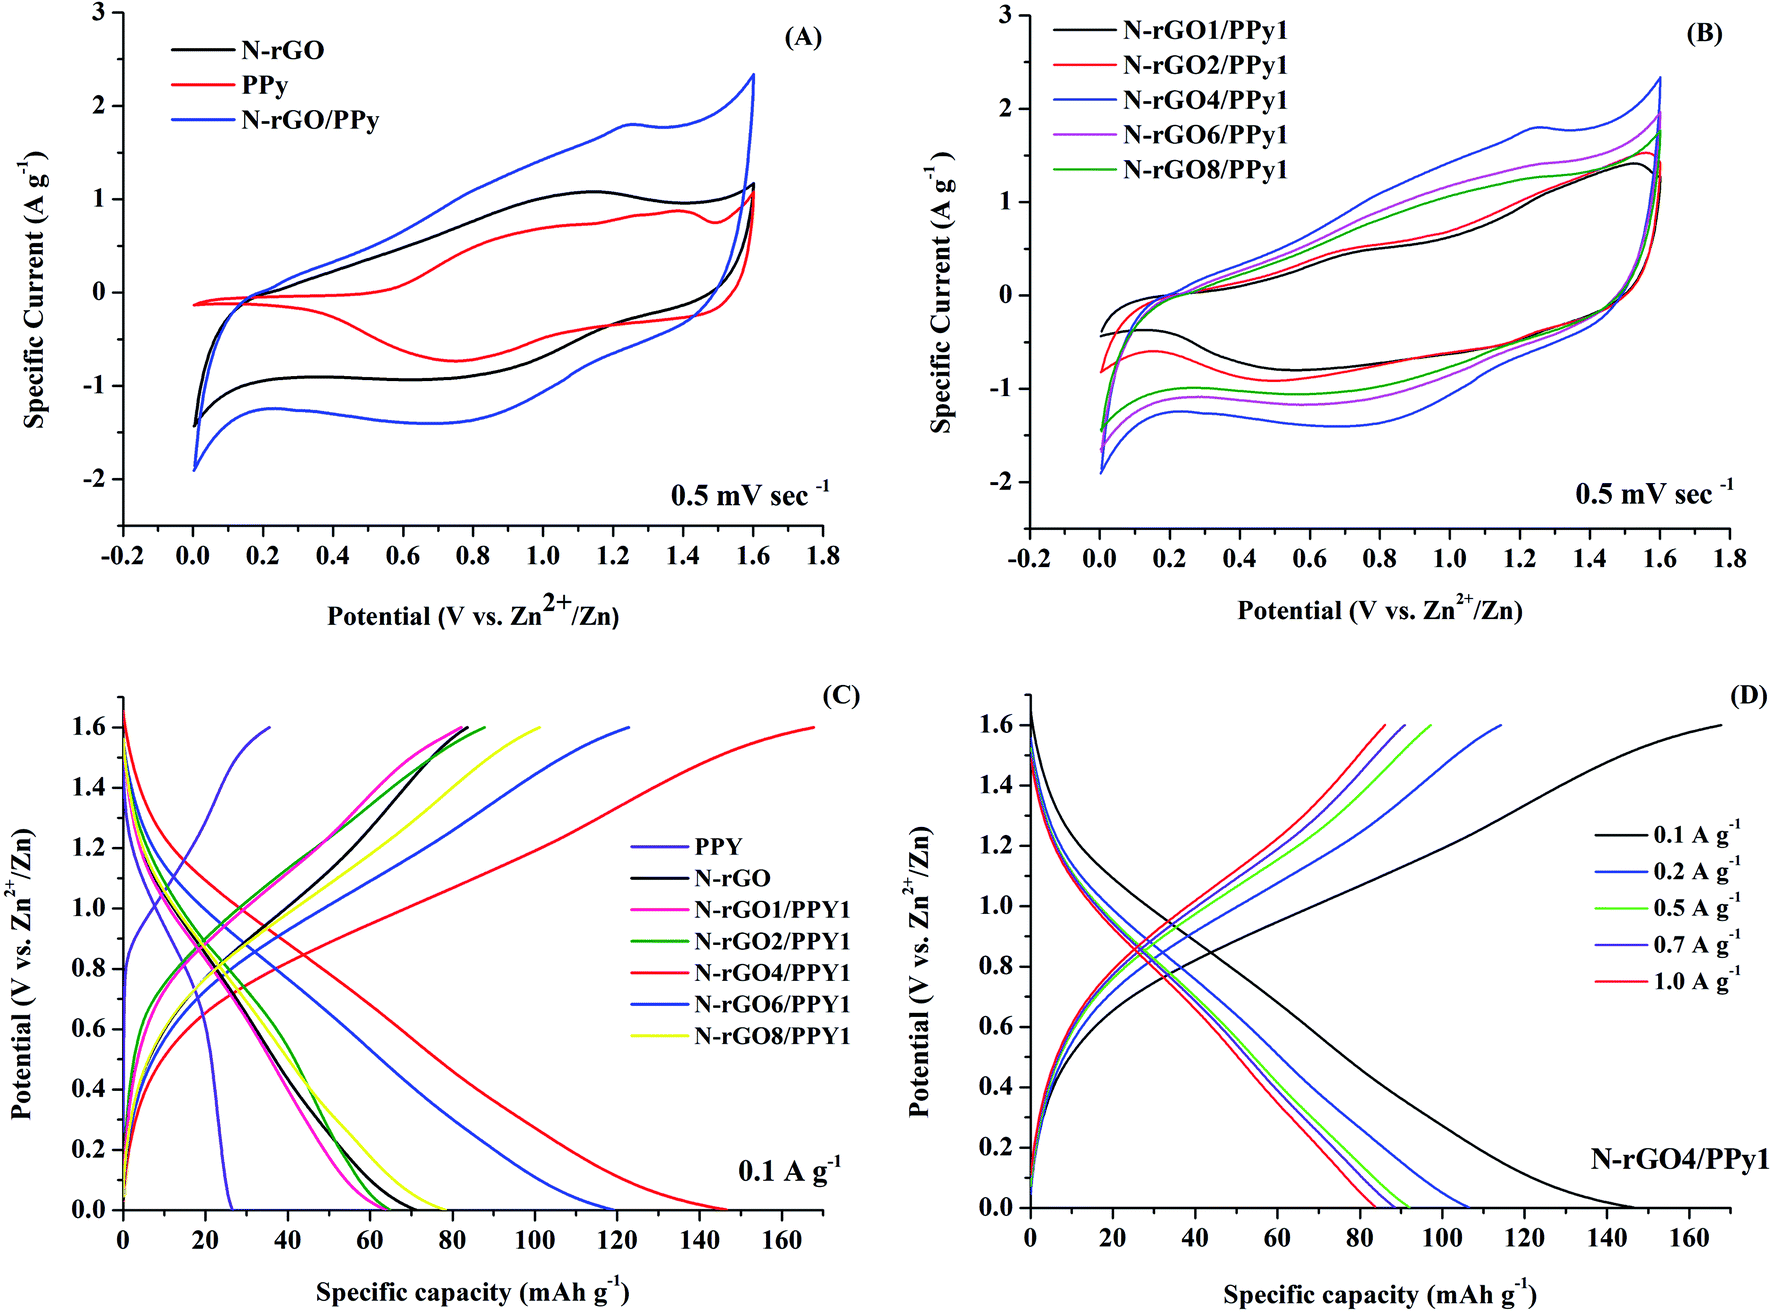
The electrochemical properties of the assembled Zn//N-rGO, Zn//PPy, and Zn//N-rGO/PPy CR2032 cell samples were evaluated by CV within the potential range of 0–1.6 V vs. Zn/Zn2+ at a scan rate of 5 mV s−1. As seen in Fig. 7A, the CV curve of the N-rGO cathode displays a rectangular-like shape with the presence of a small pair of redox peaks at 1.0 and 0.9 V, corresponding to the typical characteristics of electrochemical Zn/Zn2+ depositing/stripping on the Zn anode. Besides the redox reactions, the electrochemical active surface area (ECSA) can also be identified as the areas within the CV curves, indicating the electro-absorption processes of ions in the electrolyte on the N-rGO surface during CV cycling. For the PPy cathode, the CV curve exhibits two distinct redox reactions: an anodic peak at around 0.8 and 1.4 V and a cathodic peak at around 0.7 and 1.5 V. These peaks can basically be attributed to electrochemical Zn/Zn2+ depositing/stripping on the Zn anode, participating with the doping/de-doping process of the PPy cathode. For the CV curve of the N-rGO/PPy cathode, the cathodic and anodic peaks are slightly shifted to lower potentials compared to the PPy cathode, indicating an improvement in the conductive surface of the N-rGO/PPy composites via a synergistic effect. This decrease in the anodic and cathodic peak separation of N-RGO/PPy can be ascribed to fast kinetic reversibility, implying the capacity enhancement of the N-rGO/PPy composites. The largest CV area of the N-rGO/PPy cathode also suggests a better ESCA, arising from the synergistic effect of N-rGO and PPy inducing the electro-absorption/desorption of Zn2+ ions. Fig. 7B shows the CV curves of Zn//N-rGO/PPy samples with different N-rGO/PPy ratios. It can be seen that the different ratios of N-rGO to PPy strongly affect the response current densities and redox peak positions. At a high PPy content (N-rGO1/PPy1 and N-rGO2/PPy1), the two pairs of redox reactions with an anodic peak at 0.7/1.3 V and a cathodic peak at 0.5/1.1 V are observed, implying the coexistence of a doped/dedoped PPy process during the Zn/Zn2+ depositing/stripping. Obviously, the N-rGO4/PPy1 cathode shows the highest CV area with the highest current intensity, indicating that it has the highest ESCA. With decreasing PPy content, a pair of redox peak at 0.7 and 0.5 V disappear with the presence of the shifted anodic peak at 1.1 V and a cathodic peak at 0.8 V, indicating the inefficient redox reaction at low PPy content.
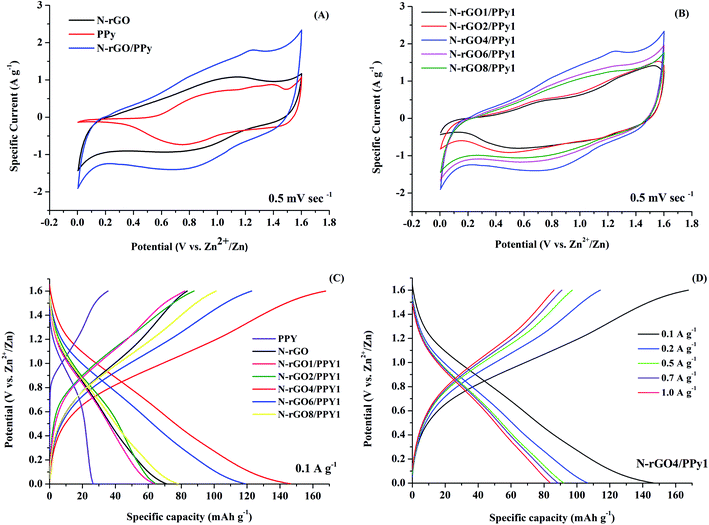 |
| | Fig. 7 Cyclic voltammograms results in 0.2 M ZnSO4 for (A) PPy, N-rGO, and N-rGO1/PPy1 at 0.5 mV s−1, and (B) N-rGO/PPy samples with various N-rGO/PPy ratios at 0.5 mV s−1; galvanostatic charge–discharge profiles for 3rd cycle of (C) N-rGO/PPy samples with various N-rGO/PPy ratios at 0.1 A g−1, and (D) N-rGO4/PPy1 at various current density. | |
The comparative galvanic charging/discharging curves between 0.2–1.6 at 0.1 A g−1 of Zn//N-rGO/PPy battery samples with different ratios of N-rGO and PPy were examined, as shown in Fig. 7C. It can be evidently seen that the N-rGO4/PPy1 cathode reveals a larger discharge plateau than that obtained from the other cathode samples, implying the highest capacity for Zn2+/SO42− ion absorption on N-rGO/PPy. The calculated discharge capacity of the N-rGO4/PPy1 cathode is 145.32 mA h g−1 at 0.1 A g−1, whereas the N-rGO, PPy, N-rGO1/PPy1, N-rGO2/PPy1, N-rGO6/PPy1 and N-rGO8/PPy1 cathodes yield discharge capacities of 73.80, 28.76, 51.11, 52.96, 138.59 and 82.01 mA h g−1, respectively. These results suggest that the redox surface of the N-rGO4/PPy1 cathode shows the highest efficiency, which is in good agreement with the CV curves shown in Fig. 7B and the SEM results in Fig. 1E. As is evident from the SEM and TEM results, the enhanced electrochemical properties of N-rGO4/PPy1 can be attributed to the good uniform distribution of PPy nanoparticles embedded on the N-rGO surface, offering a fast redox reaction and high surface area for facilitating ion/charge transportation. Fig. 7D reveals the specific capacity values of the N-rGO4/PPy1 cathode at various current densities, indicating good capacity performance through the retention of the capacity of approximately 60% from 0.1 A g−1 to 1.0 A g−1.
3.4 Rate capacity performance and cycling stability
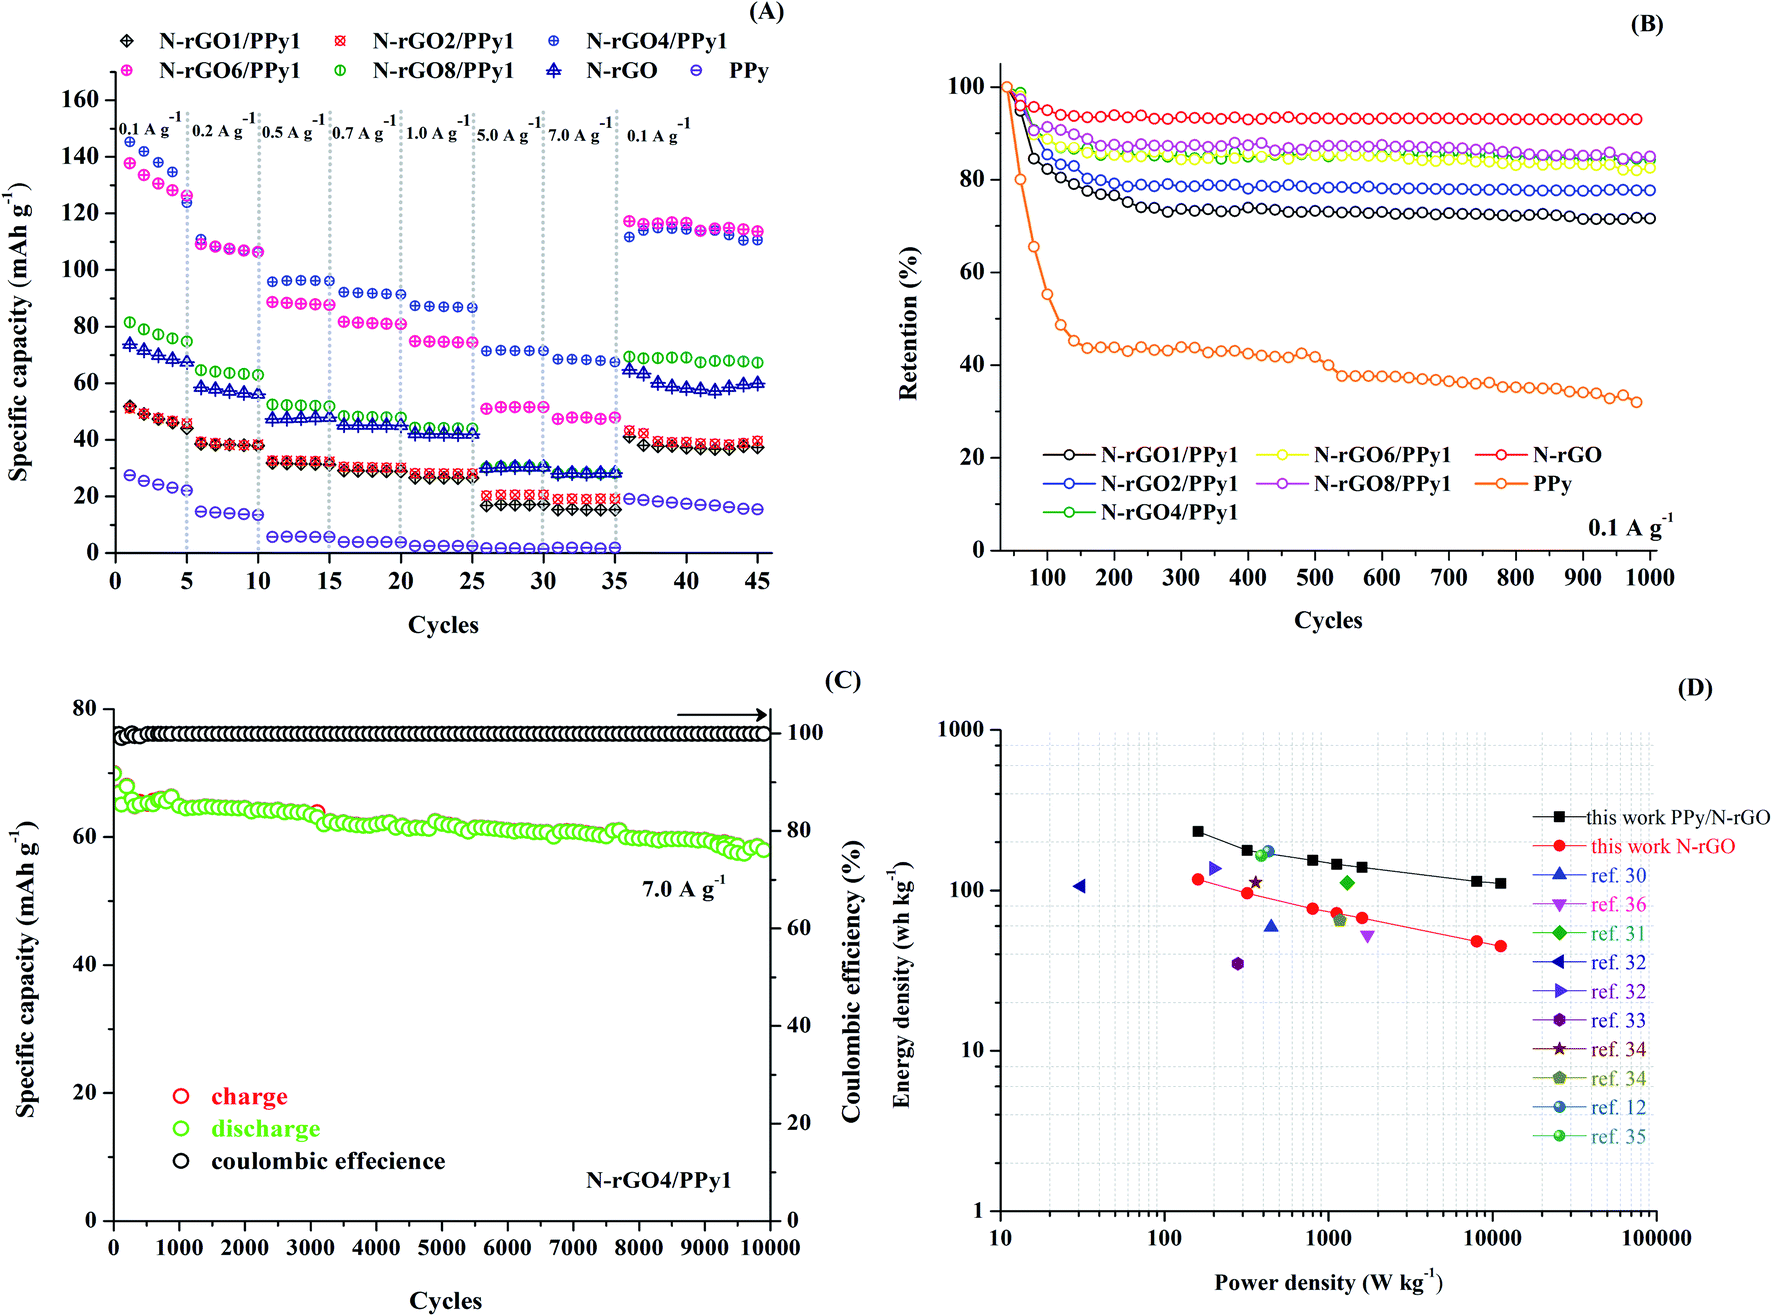
The capacity rate performance at different current densities of the cathode samples was evaluated, as seen in Fig. 8A. The assembled CR2032 cells of the Zn-hybrid supercapacitor samples were evaluated by charge–discharge cycling at various specific current densities of 0.1, 0.2, 0.5, 0.7, 1.0, 5.0 and 7.0 A g−1, with five cycles for each rate. Manifestly, the N-rGO4/PPy1 cathode delivers the highest capacity performance, with the performances in the order of N-rGO6/PPy1 > N-rGO8/PPy1 > N-rGO > N-rGO2/PPy1 > N-rGO1/PPy1 > PPy. It can be clearly seen that the optimized ratio of N-rGO to PPy plays a critical role in improving the rate capacity performance. At a low content of PPy, the prompt decrease in capacity at a very high current (>1.0 A g−1) is observed for N-rGO6/PPy1 and N-rGO8/PPy1. A low content of PPy results in a lower efficiency of the redox surface at a high rate, meaning that fast ion exchange on the redox surface is required. Meanwhile, at a high content of PPy (N-rGO1/PPy1 and N-rGO2/PPy1 cathodes), the aggregated PPy nanostructure covering the N-rGO surface limits the ion diffusion through the inner N-rGO surface and obscures the synergistic effect of N-rGO/PPy, resulting in low capacity values. Interestingly, the N-rGO4/PPy1 cathode reaches the highest discharge and charge capacity of 69.72 and 69.53 mA h g−1 at a high rate of 7.0 A g−1, suggesting that the optimized homogenous PPy nanoparticles embedded on the graphene surface promote a fast ion diffusion rate, even at a high current density. Furthermore, when the current reverts back to 0.1 A g−1, the N-rGO4/PPy1 cathode also retains almost the same initial discharge and charge capacities of 115.69 and 117.83 mA h g−1, respectively. Thus, the optimized ratio of N-rGO4/PPy1 not only improves the capacity rate performance of the ZIHSCs but also preserves the stability during current cycling.
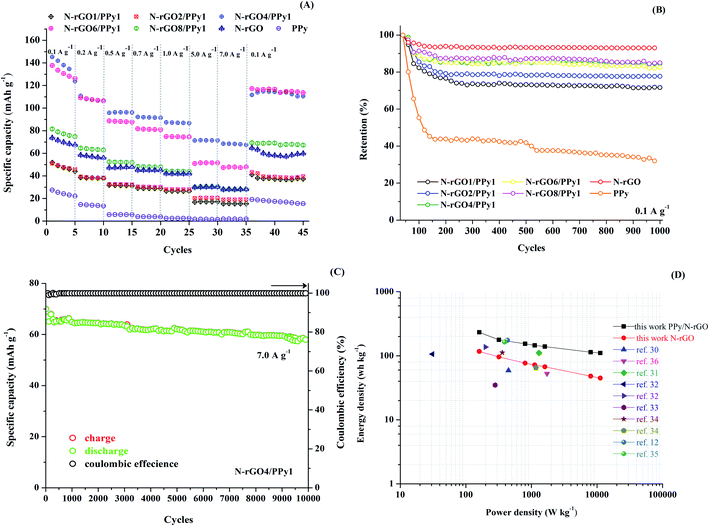 |
| | Fig. 8 (A) Rate capability of ZIHSC samples at different discharge/charge rates. (B) Cycling stability of ZIHSC samples after 1000 cycles, (C) cycling performance of a ZIHSC with the N-rGO4/PPy1 cathode after 10000 cycles at 7.0 A g−1, and (D) a comparison Ragone plot of the ZIHSC samples. | |
In addition, the cycling behaviors of Zn//N-rGO, Zn//PPy and Zn//N-rGO/PPy at different N-rGO/PPy ratios were investigated at a specific current density of 0.1 A g−1 over a potential range of 1.0–1.6 V, as presented in Fig. 8B. As expected, the N-rGO cathode exhibits a gradual capacity fading only over the 10 initial cycles and retains almost 98% capacity after 1000 cycles, which is a typical characteristic of non-faradaic carbon-based materials. In contrast, the pristine PPy cathode reveals abrupt capacity fading during the initial 150 cycles and retains only 43% capacity after 150 cycles. This capacity fading may be attributed to the dissolution of PPy into the electrolyte and irreversible redox reaction of PPy during cycling at the initial state. For the N-rGO/PPy cathode, the addition of PPy embedded on the graphene surface in turn lowers the cycling stability of N-rGO corresponding to the amount of PPy loading. Similar gradual capacity fading was observed for the N-rGO8/PPy1, N-rGO6/PPy1 and N-rGO4/PPy1 cathodes during the initial 100 cycles, with >90% capacity retained after 1000 cycles. Thus, the optimized ratios and structures of the N-rGO/PPy composites promote excellent long-term stability of the ZIHSCs. Nevertheless, at a high PPy content, the N-rGO/PPy cathode samples show an abrupt capacity fading rate during the initial 150 cycles and retain only 79% capacity for N-rGO2/PPy1 and 72% capacity for N-rGO1/PPy1 after 1000 cycles. The decrease in performance can be attributed to the large proportion of irreversible redox/degradation structure of PPy during long term cycling. The charge–discharge cycling performance of the N-rGO4/PPy1 cathode along with the corresponding coulombic efficiency was also observed, as shown in Fig. 8C, confirming its excellent stability with 85% capacity retention after 10000 cycles at 7.0 A g−1 (69 mA h g−1 to 58 mA h g−1).
The performance of the assembled Zn-capacitor CR2032 cell with the N-rGO4/PPy1 cathode was compared with other reported energy storage technologies, as illustrated in the Ragone plot in Fig. 8D. Impressively, this rGO4/PPy1 cathode for ZIHSCs can achieve an energy density in the range of 232.50–110.40 W h kg−1 at power density values in the range of 160–11200 W kg−1, showing much higher values than those of commercial zinc batteries and conventional capacitors. Our report of a ZIHSC with a rGO4/PPy1 cathode is also superior to many previous reports of similar cathode-based materials, such as hollow carbon spheres (59.7 W h kg−1 at 447.8 W kg−1),30 kelp activated carbon (111.5 W h kg−1 at 1300 W kg−1),31 graphene (106.3 W h kg−1 at 31 W kg−1),32 graphene/MWCNTs (137 W h kg−1 at 199 W kg−1),32 graphene/MXene (34.9 W h kg−1 at 279.9 W kg−1),33 PPy (112 W h kg−1 at 360 W kg−1) and nanostructured PPy (64 W h kg−1 at 1170 W kg−1),34 PPy/carbon (164 W h kg−1 at 390 W kg−1),35 PANI/molecular-decorated carbon cloth (185.7 W h kg−1 at 9742 W kg−1)12 and so on10,21,36 (see more details in Table S1†). Thus, our results suggest that the optimized N-rGO4/PPy1 cathode can be well utilized for ZIHSCs.
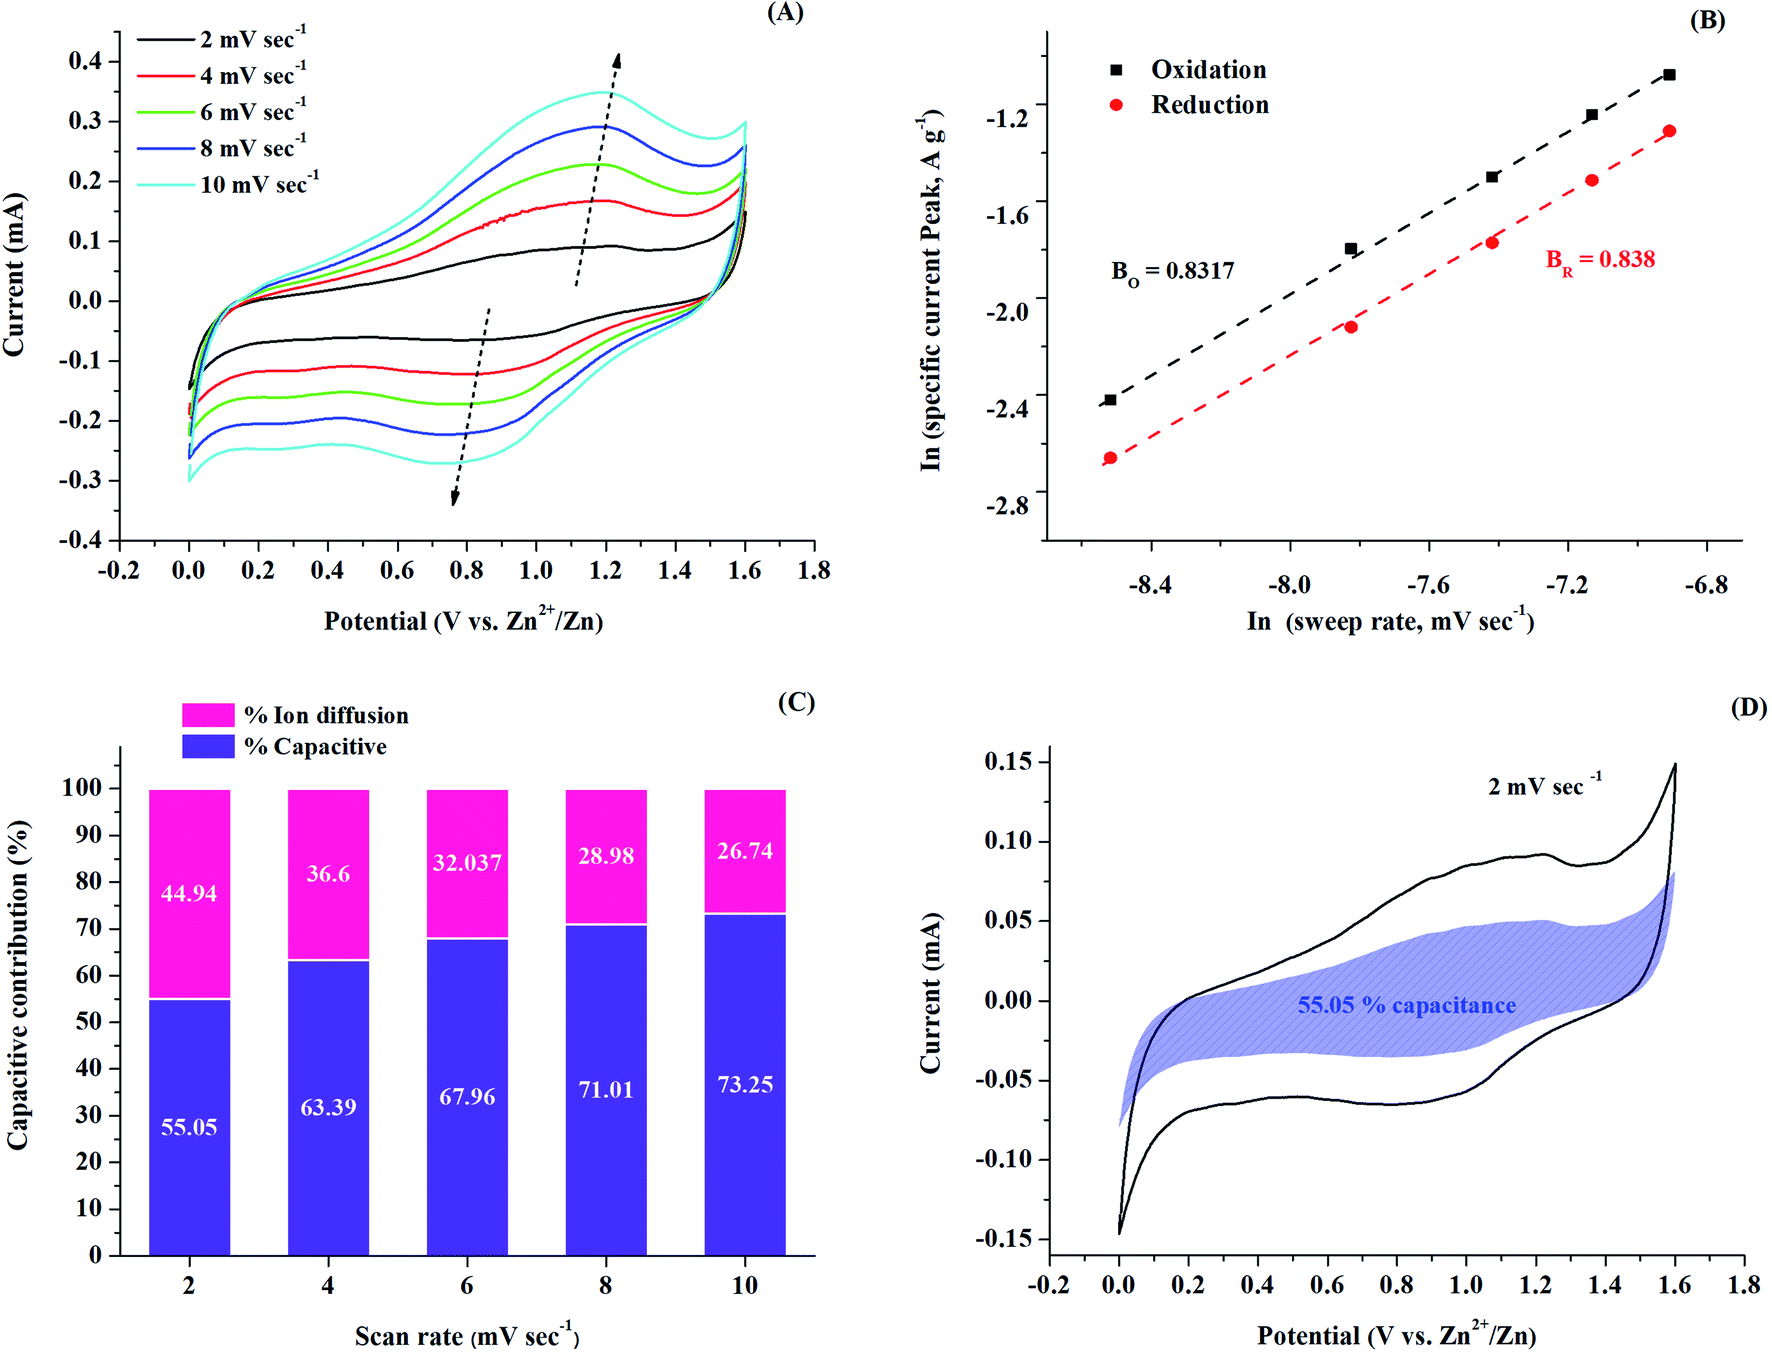
3.5 Pseudocapacitive behavior
To further emphasize the electrochemical storage mechanism of the N-rGO4/PPy1 cathode, CV of the assembled CR2032 cell of the Zn//N-rGO4/PPy1 sample was carried out at different scan rates from 2 to 10 mV s−1 in the voltage range of 0–1.6 V, as shown in Fig. 9A. Obviously, it can be seen that as the scan rate increases, the current response in the CV area along with the maximum currents of the reduction and oxidation peaks is efficiently increased. The logarithm relationship between the peak currents and the scan rate is calculated using a power law to exemplify the charge storage mechanism, as shown in eqn (3) and (4):37where i and ν are the peak specific current and scan rate, respectively, and a and b are adjustable parameters. Principally, the b value is represented by the slope of the plot, corresponding to the electrochemical characteristics of materials. If the b value is close to 0.5, the charge/discharge process is mainly controlled by ionic diffusion, while a b value of 1 indicates that pseudocapacitive behavior dominates the charge/discharge process.37 As shown in Fig. 9B, the specific current plot exhibits a linear increase with the scan rate. The calculated b values for the oxidization (bo) and reduction (br) of N-rGO4/PPy1 are 0.838 and 0.8317, respectively. This result indicates that the charge/discharge mechanism of N-rGO4/PPy1 is mainly controlled by pseudocapacitive behavior combined with ion diffusion kinetics. The contribution mechanism of the assembled CR2032 cell of Zn//N-rGO4/PPy1 can be calculated using eqn (5):37–39
 |
| | Fig. 9 Electrochemical behavior: (A) cyclic voltammograms of a ZIHSC with the N-rGO4/PPy1 cathode at different scan rates, (B) analysis curves of b values of the oxidation and reduction peaks, (C) capacitive contribution ratio of the ZIHSC with N-rGO4/PPy1 cathode at different scan rates, and (D) capacitive contribution at a scan rate of 2 mV s−1. | |
By plotting i/ν1/2 vs. ν1/2, the term k2ν1/2 indicates diffusion-controlled contribution and the term of k1ν refers to capacitive contribution. The charge–discharge mechanism of Zn//N-rGO4/PPy1 at different scan rates is presented in Fig. 9C. The pseudocapacitive contributions of Zn//N-rGO4/PPy1 are 55.05%, 63.39%, 67.96%, 71.01 and 73.25% at 2, 4, 6, 8 and 10 mV s−1, respectively. With an increase in the scan rate, the pseudocapacitive contribution is increased, with a gradual decrease in diffusion contribution. This result evidently confirms the contribution of both diffusion and pseudocapacitive behavior, manifesting in the high-rate capacity of Zn//N-rGO4/PPy1. Fig. 9D reveals the contributing fraction of Zn//N-rGO4/PPy1 at 2 mV s−1, consisting of 55.05% pseudocapacitive contribution in equilibrium with 45.95% ion diffusion, resulting in a high-rate performance and good cycling stability. Therefore, the great improvement in the capacity performance of Zn//N-rGO/PPy can be attributed to: (i) the optimization ratio between PPy and N-rGO and (ii) the homogenous distribution of the PPy nanoparticles embedded on the N-rGO surface facilitates fast charge Zn2+ ion transportation and the effective doping/de-doping process of PPy through interfacial composite layers.
4. Conclusion
In summary, PPy/N-rGO has been successfully synthesized via in situ polymerization, presenting a PPy nanoparticle-embedded N-rGO surface, which enhances the EDLC and PC of capacitive-type materials. Through optimizing the ratios of the N-rGO/PPy composites, the constructed ZIHSC using zinc foil as an anode and 4N-rGO/PPy1 as a cathode with 0.2 M ZnSO4 aqueous electrolyte affords the highest specific capacity of 145.32 mA h g−1 at 0.1 A g−1. Its excellent electrochemical performance manifests in high energy density values in the range of 232.50–110.40 W h kg−1 at power density values in the range of 160–11200 W kg−1, with excellent cycling stability of 85% capacity retention after 10000 charge–discharge cycles at 7.0 A g−1. Such an outcome with the designed PPy nanoparticles embedded on the N-rGO surface thus demonstrate the material's practicality as a cathode material for use in ZIHSCs.
Conflicts of interest
The authors have no conflicts to declare.
Acknowledgements
This research was funded by Chulalongkorn University, grant number GB-A_62_003_23_01, fiscal year 2019, and the National Research Council of Thailand, fiscal year 2020.
References
- H. Chen, T. N. Cong, W. Yang, C. Tan, Y. Li and Y. Ding, Prog. Nat. Sci., 2009, 19, 291–312 CrossRef CAS.
- A. Z. Al Shaqsi, K. Sopian and A. Al-Hinai, Energy Rep., 2020, 6, 288–306 CrossRef.
- D. Di Lecce, R. Verrelli and J. Hassoun, Green Chem., 2017, 19, 3442–3467 RSC.
- P. Christmann, E. Gloaguen, J.-F. Labbé, J. Melleton and P. Piantone, in Lithium Process Chemistry, ed. A. Chagnes and J. Światowska, Elsevier, Amsterdam, 2015, pp. 1–40, DOI:10.1016/B978-0-12-801417-2.00001-3.
- R. R. Kapaev, F. A. Obrezkov, K. J. Stevenson and P. A. Troshin, Chem. Commun., 2019, 55, 11758–11761 RSC.
- M. Walter, M. V. Kovalenko and K. V. Kravchyk, New J. Chem., 2020, 44, 1677–1683 RSC.
- T. Zhang, Y. Tang, S. Guo, X. Cao, A. Pan, G. Fang, J. Zhou and S. Liang, Energy Environ. Sci., 2020, 13, 4625–4665 RSC.
- C. Li, X. Zhang, W. He, G. Xu and R. Sun, J. Power Sources, 2020, 449, 227596 CrossRef CAS.
- J. Yin, W. Zhang, N. A. Alhebshi, N. Salah and H. N. Alshareef, Adv. Energy Mater., 2021, 11, 2100201 CrossRef CAS.
- D. Zhang, L. Li, Y. Gao, Y. Wu and J. Deng, ChemElectroChem, 2021, 8, 1541–1557 CrossRef CAS.
- G. Ping, L. Miao, A. Awati, X. Qian, T. Shi, Y. Lv, Y. Liu, L. Gan, M. Liu and D. Zhu, Chin. Chem. Lett., 2021 DOI:10.1016/j.cclet.2021.04.055.
- F. Guo, S. Gao, C. Ji, H. Mi, H. Li, W. Zhang and H. Pang, Solid State Ionics, 2021, 364, 115612 CrossRef CAS.
- X. Yue, H. Liu and P. Liu, Chem. Commun., 2019, 55, 1647–1650 RSC.
- P. Pattananuwat, A. Khampuanbut and H. Haromae, Electrochim. Acta, 2021, 370, 137741 CrossRef CAS.
- H. M. Jeong, J. W. Lee, W. H. Shin, Y. J. Choi, H. J. Shin, J. K. Kang and J. W. Choi, Nano Lett., 2011, 11, 2472–2477 CrossRef CAS PubMed.
- D. Cui, H. Li, M. Li, C. Li, L. Qian, B. Zhou and B. Yang, ACS Appl. Energy Mater., 2019, 2, 1526–1536 CrossRef CAS.
- Q. Abbas, R. Raza, I. Shabbir and A. G. Olabi, J. Sci.: Adv. Mater. Devices, 2019, 4, 341–352 Search PubMed.
- P. Pattananuwat and D. Aht-ong, Electrochim. Acta, 2017, 224, 149–160 CrossRef CAS.
- C. Long, L. Miao, D. Zhu, H. Duan, Y. Lv, L. Li, M. Liu and L. Gan, ACS Appl. Energy Mater., 2021, 4, 5727–5737 CrossRef CAS.
- Z. Song, L. Miao, L. Li, D. Zhu, L. Gan and M. Liu, Carbon, 2021, 180, 135–145 CrossRef CAS.
- J. Wang, X. Li, X. Du, J. Wang, H. Ma and X. Jing, Chem. Pap., 2017, 71, 293–316 CrossRef CAS.
- V. V. Kondratiev and R. Holze, Chem. Pap., 2021,(75), 4981–5007 CrossRef.
- H. Yu, B. Zhang, C. Bulin, R. Li and R. Xing, Sci. Rep., 2016, 6, 36143 CrossRef CAS PubMed.
- S.-Y. Lee and S.-J. Park, Carbon, 2014, 68, 112–117 CrossRef CAS.
- L.-Q. Fan, G.-J. Liu, J.-H. Wu, L. Liu, J.-M. Lin and Y.-L. Wei, Electrochim. Acta, 2014, 137, 26–33 CrossRef CAS.
- D. Roy, S. Sarkar, K. Bhattacharjee, K. Panigrahi, B. K. Das, K. Sardar, S. Sarkar and K. K. Chattopadhyay, Carbon, 2020, 166, 361–373 CrossRef CAS.
- H. Sun, Y. Wang, S. Liu, L. Ge, L. Wang, Z. Zhu and S. Wang, Chem. Commun., 2013, 49, 9914–9916 RSC.
- B. N. Grgur, M. M. Gvozdenović, J. Stevanović, B. Z. Jugović and V. M. Marinović, Electrochim. Acta, 2008, 53, 4627–4632 CrossRef CAS.
- A. Lahiri, L. Yang, G. Li and F. Endres, ACS Appl. Mater. Interfaces, 2019, 11, 45098–45107 CrossRef CAS PubMed.
- S. Chen, L. Ma, K. Zhang, M. Kamruzzaman, C. Zhi and J. A. Zapien, J. Mater. Chem. A, 2019, 7, 7784–7790 RSC.
- J. Zeng, L. Dong, L. Sun, W. Wang, Y. Zhou, L. Wei and X. Guo, Nano-Micro Lett., 2020, 13, 19 CrossRef PubMed.
- S. Wu, Y. Chen, T. Jiao, J. Zhou, J. Cheng, B. Liu, S. Yang, K. Zhang and W. Zhang, Adv. Energy Mater., 2019, 9, 1902915 CrossRef CAS.
- Q. Wang, S. Wang, X. Guo, L. Ruan, N. Wei, Y. Ma, J. Li, M. Wang, W. Li and W. Zeng, Adv. Electron. Mater., 2019, 5, 1900537 CrossRef CAS.
- X. Li, X. Xie, R. Lv, B. Na, B. Wang and Y. He, Energy Technol., 2019, 7, 1801092 CrossRef.
- B. Y. Pan Zhao, J. Chen, J. Lang, T. Zhang and X. Yan, Acta Phys.-Chim. Sin., 2020, 36, 1904050 Search PubMed.
- H. Wang, M. Wang and Y. Tang, Energy Storage Mater., 2018, 13, 1–7 CrossRef CAS.
- S. Khamsanga, M. T. Nguyen, T. Yonezawa, P. T. R. Pornprasertsuk, P. Pattananuwat, A. Tuantranont, S. Siwamogsatham and S. Kheawhom, Int. J. Mol. Sci., 2020, 21, 4689 CrossRef CAS PubMed.
- J. Wang, J. Polleux, J. Lim and B. Dunn, J. Phys. Chem. C, 2007, 111, 14925–14931 CrossRef CAS.
- X. Pu, D. Zhao, C. Fu, Z. Chen, S. Cao, C. Wang and Y. Cao, Angew. Chem., Int. Ed., 2021, 60, 2–11 CrossRef PubMed.
Footnote |
| † Electronic supplementary information (ESI) available. See DOI: 10.1039/d1ra05503h |
|
| This journal is © The Royal Society of Chemistry 2021 |
Click here to see how this site uses Cookies. View our privacy policy here. 
 Open Access Article
 This Open Access Article is licensed under a Creative Commons Attribution-Non Commercial 3.0 Unported Licence
 *abc,
Rojana Pornprasertsukabcd,
Jiaqian Qinbe and
Suchittra Prasertkaewf
*abc,
Rojana Pornprasertsukabcd,
Jiaqian Qinbe and
Suchittra Prasertkaewf