 Open Access Article
Oligomeric procyanidins inhibit insulin fibrillation by forming unstructured and off-pathway aggregates†
Shaohuang Chen‡
a,
Huiting Yin‡a,
Lei Zhanga,
Rui Liu*b,
Wei Qia,
Zhimin Hea and
Rongxin Su *ac
*ac
aState Key Laboratory of Chemical Engineering, Tianjin Key Laboratory of Membrane Science and Desalination Technology, School of Chemical Engineering and Technology, Tianjin University, Tianjin 300072, China. E-mail: surx@tju.edu.cn
bState Key Laboratory of Food Nutrition and Safety, Tianjin University of Science & Technology, Tianjin 300457, China. E-mail: lr@tust.edu.cn
cSchool of Marine Science and Technology, Tianjin University, Tianjin 300072, China
First published on 18th November 2021
Abstract
β-sheet-rich amyloid fibril or aggregate accumulation has been implicated in a number of human diseases. Numerous studies demonstrate that natural polyphenols decrease the risk of degenerative diseases and inhibit in vitro amyloid formation. However, the molecular mechanism for the anti-amyloidogenesis of polyphenols is still unclear. Thus, this study investigates the effects of oligomeric procyanidins (OPCs), resveratrol, and trehalose on the amyloidogenicity of insulin via thioflavin-T (ThT) fluorescence, dynamic light scattering (DLS), circular dichroism (CD), and transmission electronic microscopy (TEM). The results demonstrate that the order of inhibitory effects on insulin amyloid fibrillation is OPCs > resveratrol > trehalose, suggesting that the polyphenolic structure is important for fibril deposition. OPCs show potent inhibitory effects at all stages of insulin fibrillation and redirect the insulin aggregation pathway via the formation of unstructured, off-pathway aggregates. These findings contribute to the development of novel anti-amyloidogenic products from naturally occurring materials.
Introduction
Amyloids are insoluble fibrous protein aggregates and have been found to be associated with many diseases, including Alzheimer's disease,1,2 Parkinson's disease,1 and type II diabetes.3 These fibrils, despite the unrelated amino acid sequences of their native proteins, display similar ultrastructures and identical tinctorial properties including elongated, unbranched fibrils with enriched highly ordered β-sheet conformation, fluorescence upon binding to thioflavin T, and characteristic gold-green birefringence of congo red.4,5 Increasing evidences have suggested that amyloid fibrils or, more probably, oligomeric pre-amyloid aggregates of specific amyloid proteins are cytotoxic because they can induce membrane damage, endoplasmic reticulum stress, and reactive oxygen species (ROS).6–8 Undoubtedly, preventing the formation of cytotoxic amyloid fibrils, especially the most toxic oligomers, as well as a mechanistic understanding of the inhibition processes are of clinical importance and have therapeutic implications.9Insulin, which has a clear tendency to form amyloid-like fibrils, is considered a desirable model system for studying protein aggregation and fibrillation.10,11 It has been reported that localized amyloidosis is associated with repeated insulin injections.12,13 Patients with Parkinson's disease symptoms have been found to show autoimmune reaction toward insulin oligomers and fibrils, giving evidence to the involvement of insulin aggregates in neurodegenerative disease.14–16 Moreover, insulin fibrils can be formed in vitro under certain destabilizing conditions, including evaluated temperature, low pH, and increased ionic strength, which has been a formidable challenge to long-distance shipping and long-term storage of insulin.17,18
Small-molecule inhibitors have been widely investigated to inhibit protein amyloid, such as β-cyclodextrin,19 phenolic compounds,20,21 and molecular tweezer.22 Several studies have suggested that polyphenolic compounds reduce the risk of several degenerative diseases and exhibit in vitro inhibitory effects on amyloid formation, such as curcuminoids, resveratrol, catechin, (−)-epigallocatechin-3-gallate (EGCG) and soy isoflavones.21,23,24 The structural properties of polyphenols contribute to their anti-amyloidogenic activities, such that aromatic rings bearing at least three OH groups have been proposed as a key feature of efficient polyphenol inhibitors to enable interactions with amyloid proteins.25 The specific structure of polyphenols is critical in modulating protein aggregation pathways, whereas the detailed action mechanism of such compounds and their mode of interaction with their targets are unknown, which is still a subject in need of further research.26
Procyanidins are natural phenolics from grape seeds, fruits, and vegetables, and possess remarkable therapeutic activities, including anti-amyloidogenic and antioxidant/free radical scavenging.27 Bieschke28 indicated that commercially available grape seed procyanidin, MegaNatural-AZ, exerts significant inhibitory effects on the self-assembly of amyloid β protein and cytotoxicity. However, the inhibitory mechanisms of procyanidins against amyloidogenesis and its structure–activity relationship is still obscure. In addition, the physical, chemical, and biological features of procyanidins depend largely on their structure and degree of polymerization. Llópiz et al.29 showed that grape seed procyanidins are more effective than the corresponding individual monomers at preventing Fao cells from oxidative stress. The oxidation-inhibiting power of polymerized oligomers is much stronger than that of monomers.30
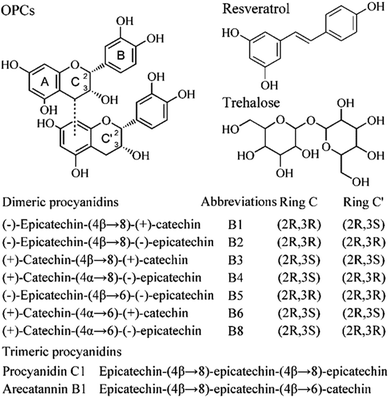
Therefore, in this work, we investigated the mechanism by which antioxidative oligomeric procyanidins (OPCs, Fig. 1) affect the aggregation and fibrillation of bovine insulin upon heating at 60 °C to identify the pathway and complexes involved. Our results showed that OPCs exhibited potent inhibitory effects at all stages of insulin fibrillation compared with resveratrol and trehalose.
Experimental
Materials
Bovine insulin (MW 5800 Da), Thioflavin T (ThT), and trehalose were purchased from Sigma-Aldrich (St. Louis, MO, USA). Grape seed-derived oligomeric procyanidins (OPCs, 95% pure) and polygonum cuspidatum-derived resveratrol (98% pure) were generously provided by Tianjin Jianfeng Natural Product R&D Co., Ltd (Tianjin, China). The molecular weight of epicatechin/epicatechin dimer, 578.14, the most abundant form of oligomer in grapeseed-derived polyphenols, was used to calculate the molarity of OPCs. All other reagents and chemicals were of analytical or HPLC grade. Water was produced using a Milli-Q system (Millipore Corp., Bedford, MA, USA).Heat-induced insulin amyloid formation
Bovine insulin was diluted and dissolved in 20% acetic acid (HAc) in the presence and absence of 100 mM NaCl to a final concentration of 2 mg mL−1. Stocks of OPCs (10 mM) and trehalose (10 mM) were prepared in ultrapure water. A stock of resveratrol (10 mM) was prepared in EtOH. Insulin solution was incubated at 60 °C with different molar amounts of freshly prepared OPCs, resveratrol, and trehalose for amyloid formation. The solutions were aliquoted at designated time intervals for further analysis. Fibrillar insulin aggregates were grown for 105 h and 210 min in the absence and presence of 100 mM NaCl, respectively.Thioflavin T (ThT) fluorescence assay
Approximately 20 μM ThT solution was prepared in 20 mM Tris–HCl buffer (pH 7.2). The solution was stored at 4 °C and protected from light to prevent quenching prior to use. Insulin samples (10 μL aliquots) were immediately mixed with 3 mL ThT solution, shaken vigorously at 3000 rpm for 30 s using a OL-861 vortex shaker (Haimen Kylin-Bell Lab Instruments Co., Ltd, China), and then allowed to bind to ThT for 2 min. The resulting ThT fluorescence was measured to detect amyloid formation. Experiments were performed on a SpectraMax M2 fluorometer at an excitation wavelength of 450 nm and an emission wavelength of 480 nm (475 nm cutoff). The fluorescence intensity of the ThT solution as a control was subtracted from the fluorescence intensity of protein samples. Error bars (±s.d.) of decuple samples are shown for selected data points.Curve-fitting program
Aggregation kinetics in the initial stage of amyloid-like fibril formation was obtained by monitoring changes in ThT fluorescence intensity. The following formula was used to fit the kinetic curves, as described by Nielsen et al.,31| Y = Y0 + mit + (Ymax − Y0 + mft)/[1 + exp − (t − t50) k] | (1) |
| Y = Y0 + (Ymax − Y0)/[1 + exp − (t − t50) k] | (2) |
As a result, lag time is defined as t50 −2/k, and growth rate is determined by line fitting to the pseudo-linear segment of the ascending portion of the fluorescence progress curve.
Dynamic light scattering (DLS)
DLS measurements were performed using a Zetasizer Nano ZS system (Malvern Instruments Ltd, Worcestershire, UK) equipped with a 4 mV He–Ne laser (λ = 633 nm). Light scattering was monitored at a 173° angle and temperature of the sample holder was controlled at 25 °C. Insulin solutions were carefully filtered through a 0.45 μm membrane directly into disposable polystyrene cuvettes. Particle size distribution of species in the insulin sample was obtained within 5 min via DLS measurements.Circular dichroism (CD) spectroscopy
Far-UV CD spectra were recorded at 25 °C under a constant flow of N2 using a JASCO-810 spectropolarimeter. Data were recorded from 250 nm to 200 nm with a 0.2 mm path length. Bovine insulin was dissolved in 20% (w/w) HAc containing 100 mM NaCl to a final concentration of 2 mg mL−1. A background CD spectrum of HAc–NaCl solution was subtracted from the sample spectra for baseline correction. The spectra were recorded at time intervals indicated with a scanning speed of 50 nm min−1, a response time of 1 s, and a bandwidth of 2 nm. Each result is given as the average of three measurements.Transmission electron microscopy (TEM)
TEM was performed as previously described.32 Briefly, 5 μL sample was adsorbed to a 300-mesh carbon-coated copper grid (Beijing, China) and negatively stained with 2% fresh prepared phosphotungstic acid solution for 2 min. The samples were air-dried and observed under a transmission microscope (JEOL Inc., Tokyo, Japan) operating at an acceleration of 100 kV. TEM images were acquired with a scale bar of 0.2 μm.Statistical analysis
Unless specified otherwise, three independent trials were performed, using a new batch of sample preparation. Values are presented as the arithmetic means ± SD. The statistical significance of the difference between two samples was evaluated via a Student's t-test, and differences were considered significant when p < 0.05. Data were processed using the SigmaPlot software.Results and discussion
Kinetics of amyloid formation by ThT fluorescence and DLS
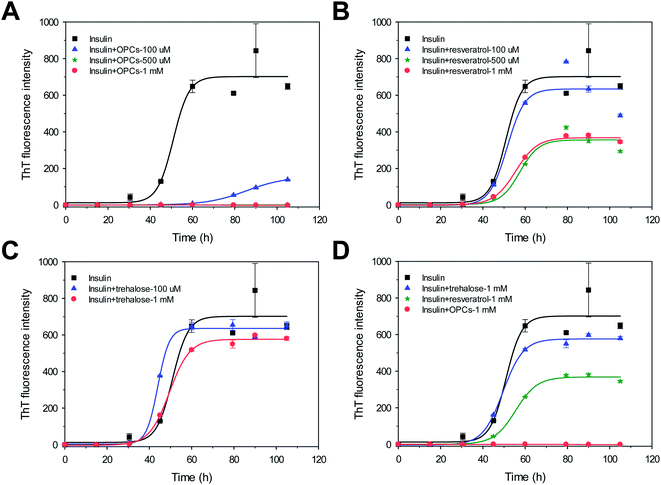
The kinetics of the amyloid formation of bovine insulin in the presence of different molar concentrations of freshly prepared OPCs, resveratrol, and trehalose were monitored via ThT fluorescence assays. Fig. 2 shows the kinetics of bovine insulin aggregation in the absence of 100 mM NaCl. Insulin aggregation increased with increased incubation time. The ThT-binding assay and the following DLS data suggest that insulin readily formed amyloid fibrils for 105 h at a growth rate of 34.8 ± 0.6 h−1 and provided strong ThT emissions with a lag time of 43.2 ± 7.9 h (Fig. 2 and 3; Table S1†).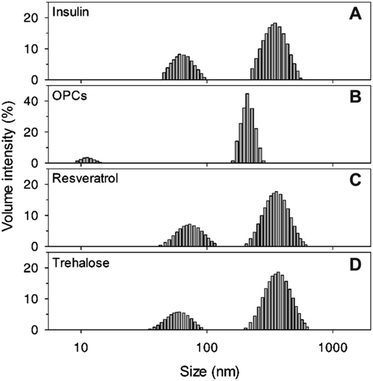 | ||
| Fig. 3 DLS analysis of insulin in the absence of 100 mM NaCl, with different compounds (1 mM): (A) insulin alone, (B) OPCs, (C) resveratrol, and (D) trehalose. | ||
All lag times, growth rate, and maximum fluorescence intensities in the presence of OPCs were significantly altered. Lag time increased from 43.2 ± 7.9 to 67.0 ± 2.0 h (p < 0.05; Table S1†), growth rate decreased from 34.8 ± 0.6 to 3.9 ± 0.1 h−1 (p < 0.05; Table S1†), and the intensity of ThT emission also greatly decreased by >75% when 100 μM OPCs was added. A stronger inhibition on insulin amyloid formation was observed when the ThT intensities decreased to nearly 0 when molar concentration was increased further to 500 μM and 1 mM. Lag times and growth rates cannot be calculated because the small ThT intensity data cannot get a good fit with the kinetic equation. This result indicates that OPCs (500 μM and 1 mM) almost completely suppressed the fibrillation of insulin. Similar dose-dependent results were found when resveratrol was added. Although lag time was not significantly changed, the growth rate and ThT intensity decreased nevertheless with increasing molar concentration. Growth rate and ThT intensity slightly decreased by 14% and 10%, respectively, in the presence of 100 μM of resveratrol. Meanwhile, growth rates and ThT intensities dropped by nearly half of those with insulin alone when 500 μM and 1 mM resveratrol was added. Different from OPCs and resveratrol, no evident inhibitory effect on insulin amyloid fibrillation was observed for trehalose, either at low or at high molar concentrations. Trehalose has been previously reported to stabilize proteins by influencing the protein hydration;33 however, it reduces the conformational fluctuations of proteins. Therefore, OPCs showed potent inhibitory effects at all stages of insulin fibrillation compared with resveratrol and trehalose. The order of inhibitory effect was OPCs > resveratrol > trehalose (Fig. 2D). These observations are in fairly good agreement with the DLS data (Fig. 3).
The particle size distributions of insulin aggregates in the presence of 1 mM OPCs, resveratrol, and trehalose were determined through DLS experiments. Two aggregate peaks with well-separated hydrodynamic diameters (dH) of 65 nm and 350 nm were detected after 105 h of incubation without the addition of any compound (Fig. 3A). By contrast, the presence of OPCs significantly inhibited this process, at which only smaller particles (dH = 15 nm and 200 nm) were found after incubation for 105 h (Fig. 3B). Meanwhile, resveratrol and trehalose failed to show an apparent inhibitory effect on protofibrils, with large particles observed at a similar size to that of insulin alone (Fig. 3C and D). This result indicates that resveratrol may reduce the amount of insulin mature fibrils, which agrees with the TEM results.
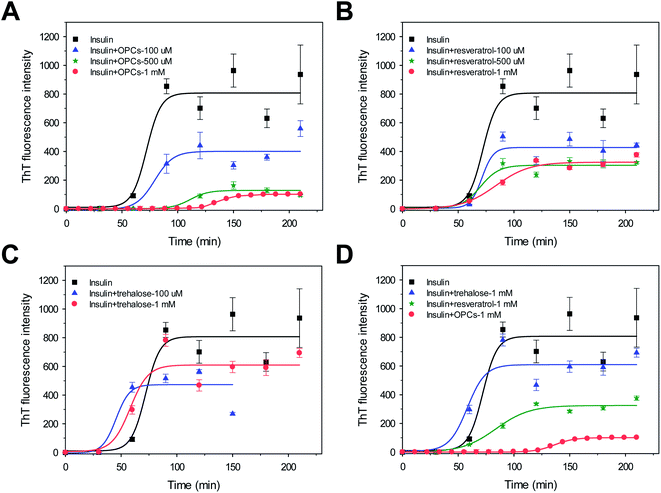
Approximately 100 mM NaCl was added into the incubation solution to further evaluate the effects of OPCs, resveratrol, and trehalose on insulin aggregation. Fig. 4 shows the kinetics of bovine insulin aggregation in the presence of 100 mM NaCl. The ThT-binding assay and the following CD data suggest that insulin readily formed typical β-sheet fibrils and exhibited strong ThT emissions with a lag time of 59.1 ± 5.7 min (Fig. 4 and 5; Table S2†). OPCs, resveratrol, and trehalose in the presence of 100 mM NaCl showed dose-dependent manners similar to those in the absence of 100 mM NaCl; however, lag times were significantly decreased (Fig. 2 and 4; Tables S1 and S2†), indicating that insulin aggregation was greatly promoted by the addition of salts. As a result, the lag time and growth rate in the presence of 1 mM OPCs were calculated as 119.0 ± 1.1 min and 2.7 ± 0.1 min−1, respectively. The order of inhibitory effect was also OPCs > resveratrol > trehalose, in the presence of 100 mM NaCl (Fig. 4D). Both the growth rates and ThT intensities were reduced by more than half, compared with those of insulin alone, via the addition of 500 μM and 1 mM resveratrol. However, lag times remained almost unchanged (p < 0.05). Insulin aggregation was slightly accelerated, with the lag time decreasing from 59.1 ± 5.7 min to 33.3 ± 8.4 (p < 0.05) and 41.9 min ± 8.6 min, when 100 μM and 1 mM trehalose were added.
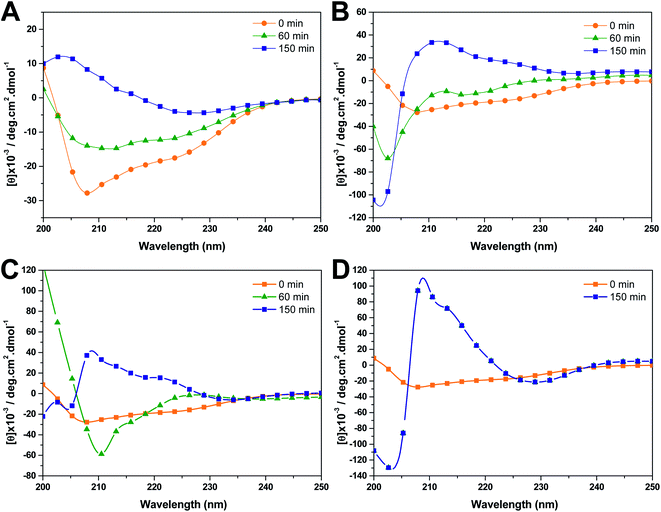 | ||
| Fig. 5 Far-UV CD spectra of insulin in the presence of 100 mM NaCl, with different compounds (1 mM): (A) insulin alone, (B) OPCs, (C) resveratrol, and (D) trehalose. | ||
Secondary structural changes of insulin aggregates by CD
The secondary structural changes of insulin aggregates alone or in the presence of 1 mM OPCs, resveratrol, and trehalose were characterized using far-UV CD spectra, as shown in Fig. 5. Consistent with the results in our previous paper,34 the CD spectrum of insulin was characterized by a predominant α-helical structure at the beginning of incubation. The spectra for insulin aggregates exhibited a significant dip at 223 nm after 150 min incubation, indicating a conformational transition from an α-helical structure to a β-strand-rich structure. Heating for 0 min to 150 min led to remarkable increases in the magnitude of CD signals at approximately 208 and 223 nm, suggesting the formation of more ordered structures.The secondary structure contents of insulin aggregates alone or in the presence of 1 mM OPCs, resveratrol, and trehalose shown in Table S3† are predicted using the BestSel server, which is an online analysis program provided by Micsonai et al.35 The addition of 1 mM OPCs exhibited a good inhibitory effect on insulin aggregation after 60 min of incubation with low β-strand content, whereas resveratrol and trehalose showed a weak ability to prevent the α-helix structure of insulin from transforming to β-strand. This result is consistent with the analysis of ThT fluorescence.
Furthermore, CD spectra of insulin in the absence of NaCl was reported in our previous work.34 We compared the secondary structure of insulin in the absence of NaCl (45 h) with that of insulin with NaCl (60 min). As shown in Table S4,† the insulin sample with NaCl shows slight decrease in α-helix content and increase in other structure contents; the estimated contents of β-strand and turn of insulin with NaCl are similar to those of insulin in the absence of salts. The secondary structure evolution of β-strand and turn contents is consistent with the results of insulin at high (60 °C) and low (4 °C) temperature reported by Hua et al.36 Overall, the addition of NaCl exhibits lower effect on secondary structure of insulin than temperature.
Morphological features of insulin aggregates by TEM
Insulin aggregates formed upon heating in the absence and presence of freshly prepared OPCs, resveratrol, and trehalose were observed via TEM. The morphological features of insulin samples at the lag, growth, and mature phases were clearly different (Fig. 6A–D). Insulin aggregates showed extensive long linear amyloid fibrils with a typical morphology of insulin deposit in the mature phase. By strong contrast, co-incubation with OPCs inhibited the formation of insulin fibrils, with mostly spherical aggregates and amorphous structures observed at the early lag phase (30 h, without 100 mM NaCl), suggesting the inhibitory effect of OPCs on the nucleation stage (Fig. 6E). These unstructured aggregates then resolved into insulin oligomers at the middle lag phase (80 h, without 100 mM NaCl), and grew to larger oligomers or protofibrils at the late lag phase (60 min, 100 mM NaCl). Finally, amyloid fibrils were formed after 180 min of incubation in the presence of 100 mM NaCl. The presence of resveratrol showed no obvious effect on the morphology of insulin amyloids, with only a small amount of lineal amyloid fibrils (Fig. 6I–L). With respect to trehalose, typical fibrils were predominantly found stacked together as lager bundles, compared with those of insulin alone (Fig. 6P).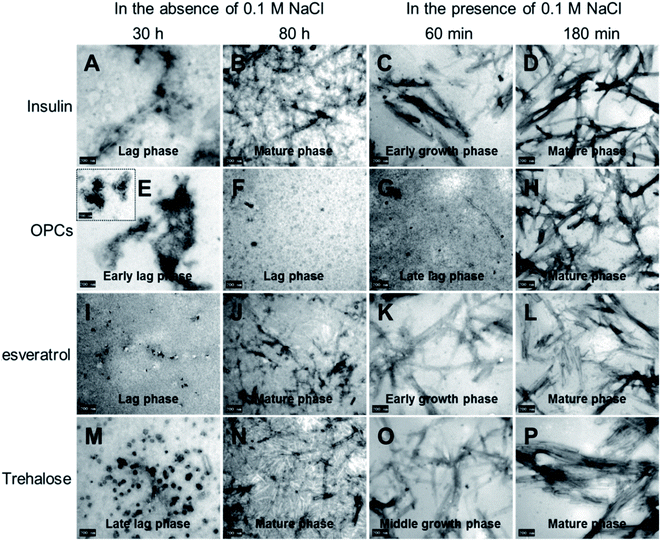 | ||
| Fig. 6 TEM images of insulin co-incubated with different compounds (1 mM) in the absence and presence of 100 mM NaCl: (A–D) insulin alone, (E–H) OPCs, (I–L) resveratrol, and (M–P) trehalose. | ||
The mechanisms of inhibiting insulin amyloid fibrillation
The present study revealed that OPCs from grape seeds is a potent inhibitor of insulin fibrillogenesis in vitro. Compared with resveratrol and trehalose, OPCs interfered early into the amyloid formation pathway and suppressed the conversion of insulin monomers into stable, on-pathway amyloidogenic structures, which are a prerequisite for nucleation-dependent amyloid fibril assembly. The spherical assemblies were observed at the early lag phase of insulin fibrillation (Fig. 6E).The mechanism by which OPCs inhibit insulin amyloid fibrillation is currently unclear. Previous investigations demonstrated that the formation of ordered β-sheet structures is predominantly a consequence of the formation of highly directional interchain hydrogen bonds,37 indicating that the inhibition of insulin amyloidogenic aggregates are caused by steric interference in β-sheet interactions.
From the viewpoint of chemical structure, OPCs are aromatic compounds with many hydroxyl groups, which suggest that it may function as a molecular zipper and induce intermolecular interactions between insulin monomers or oligomers stabilized by hydrogen bonds involving the hydroxyl groups, as well as drive the self-assembly of OPC-containing spherical insulin aggregates. However, the inhibitory effect of compounds on insulin fibrillation (OPCs > resveratrol > trehalose) was not in agreement with the number of hydroxyl groups, as shown in Fig. 1. Trehalose, consisting of more hydroxyl groups, but less aromatic rings, showed a lower inhibitory effect than OPCs and resveratrol. Factors other than hydrogen bond networks, such as aromatic stacking or hydrophobic interactions, may also affect the inhibitory effect on insulin fibril formation.38,39
Recently, Prakasam et al.40 revealed that the topologically non-trivial metal–organic structures inhibited β2-microglobulin amyloidogenesis through the weak polar and hydrophobic interactions, which supports protein hydration and suppresses aggregation and fibril onset. Xu et al.41 reported that the prevention of aggregation of human islet amyloid polypeptide by procyanidine were dependent upon hydrophobic and hydrogen bonding interactions. Additionally, as reported in our previous work, OPCs may directly bind and shield hydrophobic sites in gluten, which reduces the surface hydrophobicity of the proteins and alters their conformation.42 Therefore, the hydrophobic interaction of OPCs with insulin may lead to their effective inhibitory effects in all stages of insulin fibrillation in the absence of salts.
On the other hand, OPCs were merely capable of delaying fibrillogenesis with the addition of 100 mM NaCl. This can probably be ascribed to the more effective hydrophobic drive in the presence of ionic strength, which determines the aggregation of the insulin monomers, leading to fibrillar nucleation and subsequently growth. The stronger hydrophobic interactions among insulin monomers and oligomers compete more efficiently with the insulin-OPCs interaction and eventually lead to fibril nucleation that triggers the typical explosive amyloid growth.
This study showed how the aggregation pathway of bovine insulin can be redirected with OPCs (Fig. 7). The interactions among aggregation-prone domains of bovine insulin were suppressed via the formation of OPC-containing, unstructured off-pathway aggregates. However, the phenomenon is not without precedent. Gonçalves et al.43 suggested that procyanidin B3 had the ability to interact with proteins, leading to the assembly of trypsin/procyanidin aggregates. Recently, EGCG were observed to redirect Aβ-monomers into a new type of SDS-stable, off-pathway oligomers, instead of the expected β-sheet-rich structures.44 Similar to EGCG, experimental evidence showed that resveratrol can selectively redirect soluble oligomers, fibrillar intermediates, and amyloid fibrils of Aβ into non-toxic, high molecular weight, and unstructured aggregates.45 However, the conversion of insulin monomers into unstructured, off-pathway aggregates using resveratrol was not observed in this study. This finding suggested that the properties of proteins, such as hydrophobicity and charge, play a crucial role in regulating the aggregation pathway,46 and that OPCs are more accessible than resveratrol for insulin intermolecular interactions.
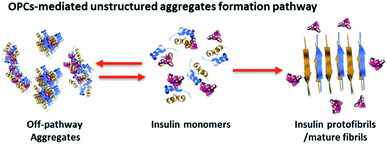 | ||
| Fig. 7 Insulin fibrillogenesis and OPC remodeling pathway leading to the formation of unstructured, off-pathway aggregates. Insulin, blue/yellow ribbon; OPCs, CPK spheres. | ||
Conclusions
In conclusion, the present study demonstrated that OPCs in grape seeds have potent inhibitory and disruptive effects on amyloid fibrillar structures in vitro, inducing the transformation of insulin monomers into unstructured, off-pathway aggregates. The structural properties of compounds, including aromatic structures and the number of hydroxyl groups must be considered in disrupting the aggregation pathway of proteins. These findings contribute to the development of novel anti-amyloidogenic products from naturally occurring materials.Conflicts of interest
The authors declare no competing financial interest.Acknowledgements
This work was supported by the National Key Research and Development Program of China (No. 2019YFE0106900), National Natural Science Foundation of China (No. 21621004).Notes and references
- A. T. Balana, P. M. Levine, T. W. Craven, S. Mukherjee, N. J. Pedowitz, S. P. Moon, T. T. Takahashi, C. F. W. Becker, D. Baker and M. R. Pratt, Nat. Chem., 2021, 13, 441–450 CrossRef CAS PubMed.
- R. E. Uhlmann, C. Rother, J. Rasmussen, J. Schelle, C. Bergmann, E. U. M. Gavilanes, S. K. Fritschi, A. Buehler, F. Baumann, A. Skodras, R. Al-Shaana, N. Beschorner, L. Ye, S. A. Kaeser, U. Obermuller, S. Christensen, F. Kartberg, J. B. Stavenhagen, J. U. Rahfeld, H. Cynis, F. Qian, P. H. Weinreb, T. Bussiere, L. C. Walker, M. Staufenbiel and M. Jucker, Nat. Neurosci., 2020, 23, 1580–U1591 CrossRef CAS PubMed.
- Z. A. Levine, K. Teranishi, A. K. Okada, R. Langen and J. E. Shea, J. Am. Chem. Soc., 2019, 141, 14168–14179 CrossRef CAS.
- M. Biancalana and S. Koide, Biochim. Biophys. Acta, Proteins Proteomics, 2010, 1804, 1405–1412 CrossRef CAS.
- C. Wu, Z. Wang, H. Lei, W. Zhang and Y. Duan, J. Am. Chem. Soc., 2007, 129, 1225–1232 CrossRef CAS.
- A. Laganowsky, C. Liu, M. R. Sawaya, J. P. Whitelegge, J. Park, M. Zhao, A. Pensalfini, A. B. Soriaga, M. Landau, P. K. Teng, D. Cascio, C. Glabe and D. Eisenberg, Science, 2012, 335, 1228–1231 CrossRef CAS.
- S. Dolui, A. Roy, U. Pal, A. Saha and N. C. Maiti, ACS Omega, 2018, 3, 2452–2462 CrossRef CAS PubMed.
- P. C. Ke, E. H. Pilkington, Y. X. Sun, I. Javed, A. Kakinen, G. T. Peng, F. Ding and T. P. Davis, Adv. Mater., 2020, 32, 7 Search PubMed.
- P. C. Ke, R. H. Zhou, L. C. Serpell, R. Riek, T. P. J. Knowles, H. A. Lashuel, E. Gazit, I. W. Hamley, T. P. Davis, M. Fandrich, D. E. Otzen, M. R. Chapman, C. M. Dobson, D. S. Eisenberg and R. Mezzenga, Chem. Soc. Rev., 2020, 49, 5473–5509 RSC.
- P. Alam, A. Z. Beg, M. K. Siddiqi, S. K. Chaturvedi, R. K. Rajpoot, M. R. Ajmal, M. Zaman, A. S. Abdelhameed and R. H. Khan, Arch. Biochem. Biophys., 2017, 621, 54–62 CrossRef CAS PubMed.
- L. Li, Z. Lv, Z. W. Man, Z. Z. Xu, Y. L. Wei, H. Geng and H. B. Fu, Chem. Sci., 2021, 12, 3308–3313 RSC.
- S. Haghighi-Poodeh, L. Navidpour, P. Yaghmaei and A. Ebrahim-Habibi, Biochem. Biophys. Res. Commun., 2019, 518, 362–367 CrossRef CAS.
- K. Yuzu, M. Lindgren, S. Nystrom, J. Zhang, W. Mori, R. Kunitomi, T. Nagase, K. Iwaya, P. Hammarstrom and T. Zako, RSC Adv., 2020, 10, 37721–37727 RSC.
- I. Aviles-Olmos, P. Limousin, A. Lees and T. Foltynie, Brain, 2013, 136, 374–384 CrossRef.
- F. G. De Felice, M. V. Lourenco and S. T. Ferreira, Alzheimers Dement, 2014, 10, S26–S32 Search PubMed.
- S. E. Arnold, Z. Arvanitakis, S. L. Macauley-Rambach, A. M. Koenig, H.-Y. Wang, R. S. Ahima, S. Craft, S. Gandy, C. Buettner, L. E. Stoeckel, D. M. Holtzman and D. M. Nathan, Nat. Rev. Neurol., 2018, 14, 168–181 CrossRef CAS PubMed.
- B. N. Ratha, A. Ghosh, J. R. Brender, N. Gayen, H. Ilyas, C. Neeraja, K. P. Das, A. K. Mandal and A. Bhunia, J. Biol. Chem., 2016, 291, 23545–23556 CrossRef CAS PubMed.
- S. Wang, C. Li, Y. Xia, S. Chen, J. Robert, X. Banquy, R. Huang, W. Qi, Z. He and R. Su, iScience, 2020, 23, 101044 CrossRef CAS PubMed.
- M. N. Shinde, R. Khurana, N. Barooah, A. C. Bhasikuttan and J. Mohanty, J. Phys. Chem. C, 2017, 121, 20057–20065 CrossRef CAS.
- M. Akbarian, E. Rezaie, F. Farjadian, Z. Bazyar, M. Hosseini-Sarvari, E. M. Ara, S. A. Mirhosseini and J. Amani, RSC Adv., 2020, 10, 38260–38274 RSC.
- F. Mohammadi, A. Mahmudian, M. Moeeni and L. Hassani, RSC Adv., 2016, 6, 23148–23160 RSC.
- J. Di, I. Siddique, Z. Z. Li, G. Malki, S. Hornung, S. Dutta, I. Hurst, E. Ishaaya, A. Wang, S. Tu, A. Boghos, I. Ericsson, F. G. Klarner, T. Schrader and G. Bitan, Alzheimers Res. Ther., 2021, 13, 6 CrossRef CAS.
- E. Tellone, A. Galtieri, A. Russo, B. Giardina and S. Ficarra, Oxid. Med. Cell. Longevity, 2015, 2015, 392169 CrossRef.
- J. Lakey-Beitia, R. Berrocal, K. S. Rao and A. A. Durant, Mol. Neurobiol., 2015, 51, 466–479 CrossRef CAS PubMed.
- M. F. M. Engel, C. C. VandenAkker, M. Schleeger, K. P. Velikov, G. H. Koenderink and M. Bonn, J. Am. Chem. Soc., 2012, 134, 14781–14788 CrossRef CAS PubMed.
- S. Sinha, Z. Du, P. Maiti, F.-G. Klaerner, T. Schrader, C. Wang and G. Bitan, ACS Chem. Neurosci., 2012, 3, 451–458 CrossRef CAS PubMed.
- S. Q. Zhao, L. Zhang, C. L. Yang, Z. H. Li and S. Rong, Mol. Neurobiol., 2019, 56, 5556–5567 CrossRef CAS PubMed.
- J. Bieschke, Neurotherapeutics, 2013, 10, 429–439 CrossRef CAS.
- N. Llópiz, F. Puiggros, E. Cespedes, L. Arola, A. Ardevol, C. Blade and M. J. Salvado, J. Agric. Food Chem., 2004, 52, 1083–1087 CrossRef PubMed.
- K. J. Murphy, A. K. Chronopoulos, I. Singh, M. A. Francis, H. Moriarty, M. J. Pike, A. H. Turner, N. J. Mann and A. J. Sinclair, Am. J. Clin. Nutr., 2003, 77, 1466–1473 CrossRef CAS.
- L. Nielsen, R. Khurana, A. Coats, S. Frokjaer, J. Brange, S. Vyas, V. N. Uversky and A. L. Fink, Biochemistry, 2001, 40, 6036–6046 CrossRef CAS PubMed.
- R. Liu, M. He, R. Su, Y. Yu, W. Qi and Z. He, Biochem. Biophys. Res. Commun., 2010, 391, 862–867 CrossRef CAS.
- S. Paul and S. Paul, J. Phys. Chem. B, 2015, 119, 1598–1610 CrossRef CAS.
- R. Liu, R. Su, W. Qi and Z. He, Biochem. Biophys. Res. Commun., 2011, 409, 229–234 CrossRef CAS.
- A. Micsonai, F. Wien, L. Kernya, Y. H. Lee, Y. Goto, M. Refregiers and J. Kardos, Proc. Natl. Acad. Sci. U. S. A., 2015, 112, E3095–E3103 CrossRef CAS.
- Q. X. Hua and M. A. Weiss, J. Biol. Chem., 2004, 279, 21449–21460 CrossRef CAS PubMed.
- P. K. GhattyVenkataKrishna, E. C. Uberbacher and X. Cheng, FEBS Lett., 2013, 587, 2649–2655 CrossRef CAS PubMed.
- A. A. Profit, J. Vedad, M. Saleh and R. Z. B. Desamero, Arch. Biochem. Biophys., 2015, 567, 46–58 CrossRef CAS PubMed.
- K. E. Marshall, K. L. Morris, D. Charlton, N. O'Reilly, L. Lewis, H. Walden and L. C. Serpell, Biochemistry, 2011, 50, 2061–2071 CrossRef CAS PubMed.
- T. Prakasam, Y. Hunashal, C. Cantarutti, S. Giorgetti, G. Faravelli, V. Mondani, S. K. Sharma, R. Jagannathan, G. Palmisano, V. Bellotti, F. Fogolari, J. C. Olsen, A. Trabolsi and G. Esposito, Cell Rep. Phys. Sci., 2021, 2, 100477 CrossRef.
- J. F. Xu, T. Zheng, X. Y. Huang, Y. A. Wang, G. W. Yin and W. H. Du, Int. J. Biol. Macromol., 2021, 183, 1067–1078 CrossRef CAS PubMed.
- R. Liu, C. Y. Shi, Y. S. Song, T. Wu and M. Zhang, Food Chem., 2018, 260, 37–43 CrossRef CAS PubMed.
- R. Gonçalves, N. Mateus and V. De Freitas, J. Agric. Food Chem., 2011, 59, 11794–11802 CrossRef PubMed.
- F. L. Palhano, J. Lee, N. P. Grimster and J. W. Kelly, J. Am. Chem. Soc., 2013, 135, 7503–7510 CrossRef CAS PubMed.
- A. R. A. Ladiwala, J. C. Lin, S. S. Bale, A. M. Marcelino-Cruz, M. Bhattacharya, J. S. Dordick and P. M. Tessier, J. Biol. Chem., 2010, 285, 24228–24237 CrossRef CAS PubMed.
- B. Moores, E. Drolle, S. J. Attwood, J. Simons and Z. Leonenko, Plos One, 2011, 6, e25954 CrossRef CAS.
Footnotes |
| † Electronic supplementary information (ESI) available. See DOI: 10.1039/d1ra05397c |
| ‡ These two authors contributed this paper equally. |
| This journal is © The Royal Society of Chemistry 2021 |

