 Open Access Article
Effects of graphene oxide size on curing kinetics of epoxy resin
Xuebing Chena,
Weijiao Jianga,
Bo Hub,
Zhiming Liangb,
Yue Zhang*b,
Jian Kang *a,
Ya Caoa and
Ming Xianga
aState Key Laboratory of Polymer Materials Engineering, Polymer Research Institute of Sichuan University, Chengdu 610065, China
bDongfang Electric Machinery Co., Ltd., Deyang, 618000 China. E-mail: metaspark@163.com
First published on 1st September 2021
Abstract
To study the effects of graphene oxide (GO) size on the curing kinetics of epoxy resin (EP), two kinds of GO were selected and characterized by Fourier transform infrared spectrometry (FT-IR), FT-Raman spectrometry (FTIR-Raman), thermo gravimetric analysis (TGA), dynamic light scattering (DLS), transmission electron microscopy (TEM), X-ray diffractometry (XRD) and X-ray photoelectron spectroscopy (XPS). The results showed that the two kinds of GO had similar chemical structures but different sizes—the average particle size of GO-A was 190.1 nm and that of GO-B was 1510 nm, and GO-A has more oxidizing groups on its surface. The two kinds of GO were separately added to EP, and the curing kinetics of GO/EP composites and neat EP were investigated through differential scanning calorimetry (DSC). It can be seen that the addition of GO promoted the curing process of the EP system, and GO-A had a more significant catalytic effect. Furthermore, the curing activation energy (Ea) was calculated by Kissinger model, and the change of Ea in the whole curing reaction process was studied by Ozawa method to further understand the curing mechanism. It showed that the apparent Ea of EP system increases with the increase of the conversion rate, and Ea of EP-A is obviously lower in the early curing stage. However, as the curing reaction proceeds, Ea of EP-B is a little lower than that of EP-A in the later curing stage. But EP-A has the lowest Ea combined with the whole process from Kissinger method. To sum up, it can be concluded that the curing process of EP can be promoted by adding GO and the smaller size (190.1 nm) of GO had a greater effect and lower Ea than the GO with particle size of 1510 nm. And the related mechanisms were discussed and analyzed.
1 Introduction
Epoxy Resin (EP) is one of the most frequently used matrix resins because of its low price, high adhesion, outstanding chemical and heat resistance, and excellent mechanical and electrical insulation properties.1–3 It has been widely used in many fields of industry, such as engineering adhesives, coatings, semiconductor encapsulation, hardware components, electronic circuit board materials, and components of automotive, marine, and aerospace composite materials.4–7However, EP also has the undesirable property of brittleness with low fracture resistance and poor electrical conductivity because of their structure, which limits their applications in some fields.8 In recent years, the enhancement of EP by adding nanofillers has been widely reported, such as nano-silica, nano clay, carbon nanotubes, carbon black, and fullerene.2,9 Compared with traditional fillers, nanofillers can effectively improve the properties of EP.10–12 As anatomically thick, two-dimensional substance with a high aspect ratio (width to thickness), superior mechanical, thermal, and electrical properties, graphene oxide (GO) becomes an excellent nanofiller for the production of high strength, high thermal and electrically conductive polymer nanocomposites.12–15
There has been much research about the GO/EP composites. Research results demonstrated that the properties of EP depend a lot on the influence of nanofillers on the curing behavior of EP. And by using non-isothermal crystallization kinetics, the effect of GO on the non-isothermal curing behavior of the EP system was investigated. Hu et al. studied the effect of imidazole-modified GO on curing kinetics of an EP system containing 1.5% phosphorus. Li et al.16 prepared surface amine-rich functionalized GO by amination reaction and studied its effect on curing kinetics of EP. Ryu et al.17 studied and compared the curing kinetics of hexamethylenediamine functionalized GO/EP system and the original GO/EP system, and determined the relevant curing kinetics parameters by the Kissinger method and the Friedman method. Kuilla et al.18 studied the influence of GO on the cure behavior with four different heating rates. From the references above, it can be concluded that the filler of GO can affect the curing rate, the formation of crosslinking structure, glass transition temperature and curing temperature, and curing activation energy (Ea) of the EP system. Furthermore, the curing kinetics can be changed after the addition of nanofiller into EP system, thus affecting the material properties of EP. Some studies also investigated the effect of GO content on curing kinetics, but some of the conclusions are inconsistent, indicating that the research on this system is not full-fledged.
The studies above mainly focus on the effect of the modification and content of GO on the EP system. However, the shape and particle size also influence the curing kinetics. J. Abenojar et al.19 studied the curing process, wear behavior, and mechanical properties of an epoxy adhesive filled with two different particle sizes of boron carbide (B4C), respectively. The result showed that the B4C particle size affects the curing rate. Zhao et al.20 discussed the influence of glass beads content and size on the kinetic parameters and found smaller filler size had lower Ea and a faster curing speed at the beginning of the curing reaction. Such studies about the effect of nanofiller particle size on the curing kinetic are not full-fledged enough, and few people have studied the effect of GO particle size on curing reaction kinetics of EP system. Also, the theoretical study of curing mechanism is also not clear. To better understand the impact of GO on EP system and choose the most appropriate GO size, it is essential to study effects of GO size on curing kinetics of EP, which is also con tributes to determining the processing technology, reaction condition and formulation production of composites.21,22
In our study, different curing kinetics models such as Kissinger and Ozawa method were used to study the non-isothermal curing kinetics of GO/EP, and the effect of GO size on the curing process of EP was discussed. All of these studies above provided a theoretical basis for the determination of the curing process of GO/EP composites.
2 Experimental
2.1 Materials
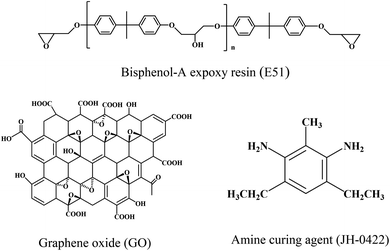
The bisphenol-A epoxy resin (industrial pure, grade E51, epoxy equivalent 184–195 g mol−1) was purchased from Deyuan Chemical Co., Ltd., China. Two kinds of GO (GO-A, GO-B) were kindly provided by Deyangene Carbon Technology Co., Ltd., China. The amine curing agent (JH-0422, amine value 750–850 mg KOH g−1) was purchased from Changshu Jiafa Chemical Co., Ltd., China.The chemical structures of E51, GO and JH-0422 are shown in Fig. 1.
2.2 Preparation of GO/EP composites
0.02 g of GO (GO-A and GO-B) and 400 mL of ethanol were added to a beaker, and ultrasound for 2 hours. Then 4 g of EP was added and ultrasound for 2 hours. After that, the solution was stirred at 90 °C for 12 hours to evaporate the ethanol, and vacuumed in a 90 °C vacuum oven for 2 hours to remove the remaining ethanol. Then, the amine curing agent of JH-0422 with a mass fraction of 20% was added to the system and stirred until a homogeneous mixing system was obtained, and the samples (EP-A and EP-B) required for the test were obtained.2.3 Characterization and measurement
The spectra of GO-A and GO-B were recorded by Fourier transform infrared spectrometer (FT-IR, PerkinElmer Frontier, PerkinElmer Corp., USA) under transmission mode. The scanning range was 4000–400 cm−1, the accuracy was 4 cm−1, and the scanning times were 16 times; the chemical structure and composition of GO sample surface were analyzed by X-ray Photoelectron Spectroscopy (XPS, Thermo Scientific K-Alpha, Thermofisher, USA). The test conditions were vacuum degree of 5 × 10⁻⁹ mbar, monochromatic Alka source (Mono Alka), the energy of 1486.6 eV, the voltage of 15 kV, beam current of 15 mA, scanning mode of the analyzer of CAE, and the instrument work function of 4.2.23–26The X-ray Diffractometry (XRD) patterns of GO-A and GO-B were obtained through a diffractor (Ultima IV, Rigaku Corp., Japan). The wavelength of Cu Kα radiation was λ = 0.154 nm and the scanning rate was 10° min−1. For GO-A and GO-B, powder samples were used and spectra were recorded in the range of 2θ = 0–90°.27–30
The molecular structure of GO can be further analyzed by FT-Raman Spectrometer (FTIR-Raman, Renishaw inVia, Bruker Corp., England). The wavelength of the laser is 514 nanometers; Thermo Gravimetric Analysis (TGA, FG 209 F1, Netzsch Corp., Germany) test was conducted to analyze the oxygen-containing functional group content of GO-A and GO-B. About 2 mg of GO powder was weighed and placed in a crucible under a nitrogen atmosphere at a heating rate of 10 °C min−1. And the temperature range was from 30 °C to 800 °C; GO particle sizes dissolved in DI H2O were measured by Dynamic Light-Scattering (DLS) using a Malvern instrument particle size analyzer (Zetasizer Nano-ZS, Malvern Corp., UK). Scattering was measured at an angle of 173°. The GO samples were diluted with DI H2O to a concentration of 1 mg mL; to further analyze the structure and observe the size of GO-A and GO-B, Transmission Electron Microscopy (TEM, Tecnai G2 F20 S-TWIN, FEI, USA) was performed under an accelerating voltage of 200 kV. The TEM sample was dispersed in ethanol and deposited on a copper grid for observation; Scanning Electron Microscope (SEM, ZEISS Gemini 300, Carl Zeiss AG, Germany) was performed for GO/EP composites to observe distribution of the GO particles in the EP. Before measurements, impact fracture surfaces of the samples were coated with gold.31,32
All non-isothermal curing reaction experiments were performed with Differential Scanning Calorimeter (DSC, DSC1, Mettler Toledo, Switzerland) under continuous nitrogen flow of 50 mL min−1. The standard procedure for each experiment was the following: 5–8 mg of sample was weighted, heated to 300 °C at different heating rates, i.e. 5 °C min−1, 10 °C min−1, 15 °C min−1, and 20 °C min−1, to analyze the cure behavior.33–36
3 Results and discussion
3.1 Characterization
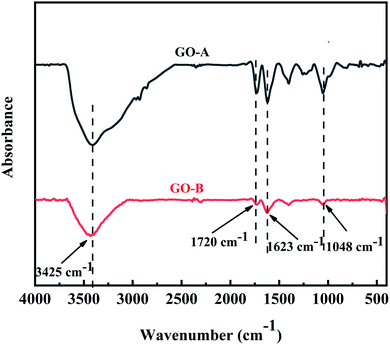
The FT-IR spectra result of two kinds of GO is shown in Fig. 2, and the absorption peaks are clearly observed. Besides, the peaks at 1048 cm−1, 1623 cm−1, 1720 cm−1, and 3425 cm−1 are relevant with C–O–C stretching, C![[double bond, length as m-dash]](https://www.rsc.org/images/entities/char_e001.gif) C stretching, C
C stretching, C![[double bond, length as m-dash]](https://www.rsc.org/images/entities/char_e001.gif) O stretching and –OH stretching, respectively, which correspond to the characteristic groups of GO. It can be seen that GO-A and GO-B have the same peak emergence location, indicating that they have the same chemical structure.
O stretching and –OH stretching, respectively, which correspond to the characteristic groups of GO. It can be seen that GO-A and GO-B have the same peak emergence location, indicating that they have the same chemical structure.
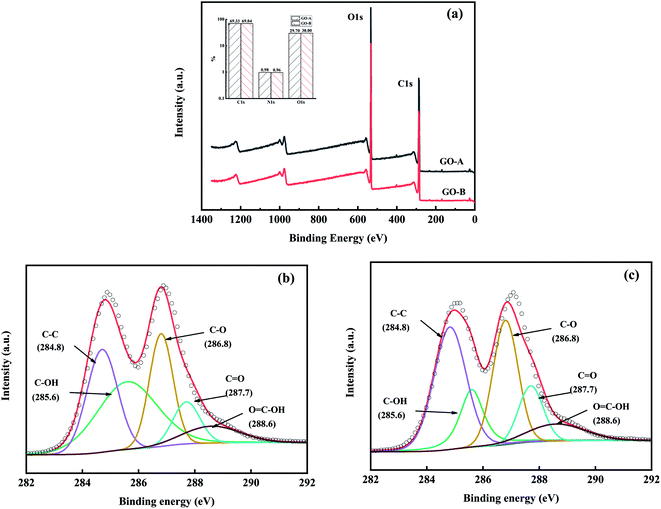
The chemical structure and composition of GO-A and GO-B surfaces were analyzed by XPS. According to Fig. 3(a), O1s, C1s, and N1s are the main element signal peaks and the amount of the elements are similar. Also, Fig. 3(b) and (c) are curve fitting of C1s spectra of the GO-A and GO-B, and the proportions of various carbon bonds are shown in Table 1. It can be seen that the C1s spectrum can be fitted by five Gaussian–Lorentzian peaks including C–C (284.8 eV), C–OH (285.6 eV), C–O (286.8 eV), C![[double bond, length as m-dash]](https://www.rsc.org/images/entities/char_e001.gif) O (287.7 eV), and C
O (287.7 eV), and C![[double bond, length as m-dash]](https://www.rsc.org/images/entities/char_e001.gif) C–OH (288.6 eV). It can be found that GO-A and GO-B contain a large number of oxygen-containing groups such as hydroxyl and carboxyl groups, and the content of hydroxyl and carboxyl groups in GO-A is obviously higher than that in GO-B.37,38
C–OH (288.6 eV). It can be found that GO-A and GO-B contain a large number of oxygen-containing groups such as hydroxyl and carboxyl groups, and the content of hydroxyl and carboxyl groups in GO-A is obviously higher than that in GO-B.37,38
| Sample | C–OH (%) | C–C (%) | C–O (%) | C![[double bond, length as m-dash]](https://www.rsc.org/images/entities/char_e001.gif) O (%) O (%) |
O![[double bond, length as m-dash]](https://www.rsc.org/images/entities/char_e001.gif) C–OH (%) C–OH (%) |
|---|---|---|---|---|---|
| GO-A | 18.9 | 34.9 | 29.6 | 7.2 | 9.3 |
| GO-B | 16.0 | 36.2 | 26.8 | 15.0 | 5.9 |
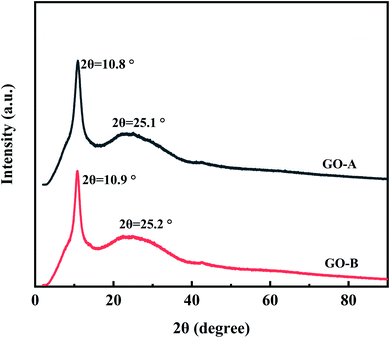
Fig. 4 is the XRD pattern of the two kinds of GO. In the spectrum, the intensive sharp peak for the (001) plane of GO is shown at about 2θ = 10° and the broad peak for the (002) plane of graphene is observed at about 2θ = 25°. Based on the Bragg's law, the layer spacing of GO-A and GO-B can be calculated as 0.82 nm and 0.81 nm, respectively. And it indicates that the size difference of GO does not change its composition and structure.39
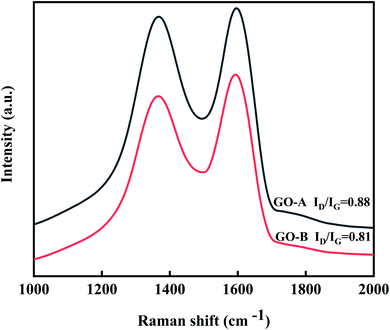
Fig. 5 is the Raman spectra of GO-A and GO-B. For GO, the D-band (1360 cm−1), which represents an atomic lattice defect caused by the disordered vibrations of C–C, results from the sp3 hybridized part. And the G-band (1600 cm−1), which is caused by the C![[double bond, length as m-dash]](https://www.rsc.org/images/entities/char_e001.gif) C stretching vibration in the plane, is the sp2 hybrid part. Therefore, the ratio of ID/IG indicates the extent of surface defects in GO. By calculating, the ID/IG of GO-A is greater than that of GO-B, which indicates that the GO-A surface has more defects and oxygen-containing groups.
C stretching vibration in the plane, is the sp2 hybrid part. Therefore, the ratio of ID/IG indicates the extent of surface defects in GO. By calculating, the ID/IG of GO-A is greater than that of GO-B, which indicates that the GO-A surface has more defects and oxygen-containing groups.
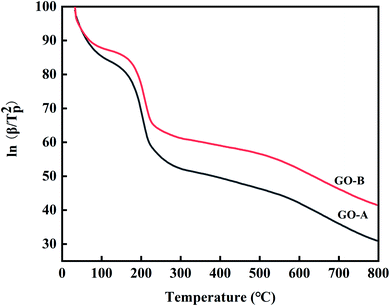
Fig. 6 is TGA curves of the GO-A and GO-B. The first phase of losing weight is below 100 °C. This results from a large number of oxygen-containing functional groups in GO. They absorb water molecules in the air, and the free water and bound water evaporate when the temperature is raised. The second stage of weightlessness at about 200 °C is caused by the decomposition and gasification of a large number of oxygen-containing functional groups on the GO surface and the gasification of some of the water combined with the oxygen-containing functional groups. Then, due to numerous defects on the GO surface, the third stage begins to lose weight at around 500 °C. It can be calculated that the weightlessness of GO-A in the first and second paragraphs is approximately 14.9% and 35.1%, and that of GO-B is about 11.5% and 28.5%. The result shows GO-A absorbs more water and has more oxygen-containing functional groups.
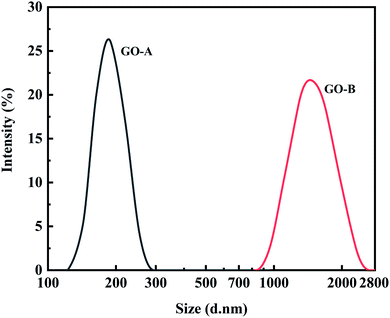
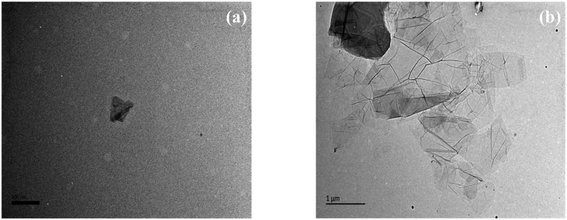
The particle sizes of GO-A and GO-B were determined by DLS and TEM. For both samples, the particle size distributions were observed by DLS with the average particle sizes of 191.10 nm and 1510 nm, which is shown in Fig. 7. Besides, TEM images may give a more realistic insight into the particle sizes. Although the bending, overlapping, and shape differences may affect the observation of particle size distribution, it can be seen clearly from TEM images presented in Fig. 8 that the particle size of GO-B is much larger than that of GO-A. Meanwhile, both of them have a certain degree of irregular stacking and aggregation, and there are many small folds as well as fragments randomly arranged together at the edge of GO lamellae.
3.2 Curing kinetics analysis
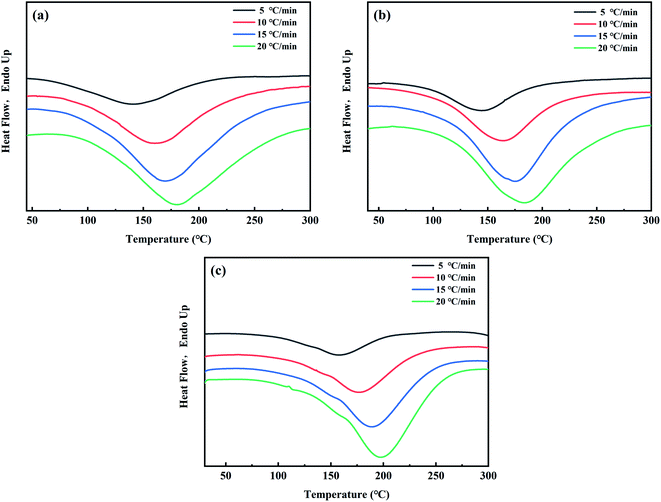
The curing process of GO/EP is complex and affects the material properties, so the curing kinetics analysis is contributed to studying the properties and curing conditions of the EP system, and provides theoretical guidance and basis for the molding and manufacturing of the GO/EP composite materials. Therefore, non-isothermal DSC was used to test the key curing kinetic parameters.Fig. 10 shows the non-isothermal DSC curves of enthalpy versus temperature of EP-A, EP-B, and neat EP at the heating rates of 5 °C min−1, 10 °C min−1, 15 °C min−1, and 20 °C min−1, respectively. And Table 2 shows the curing peak temperatures (Tp) of the epoxy curing reactions at different heating rates obtained from Fig. 10.
| Sample | β (°C min−1) | Tp (°C) |
|---|---|---|
| EP-A | 5 | 141.2 |
| 10 | 160.8 | |
| 15 | 172.8 | |
| 20 | 180.0 | |
| EP-B | 5 | 144.0 |
| 10 | 163.5 | |
| 15 | 175.4 | |
| 20 | 183.0 | |
| Neat EP | 5 | 158.0 |
| 10 | 177.3 | |
| 15 | 189.0 | |
| 20 | 197.7 |
It can be seen from Fig. 10 that the rate of total enthalpy change gradually increases to the maximum as the curing reaction proceeds at the beginning, and then decreases after the peak temperature. It reveals that at the beginning of the curing process, the chain lengths are increasing, and the rate of total enthalpy change is increasing. However, as the reaction goes on and the crosslinking begins, the rate of total enthalpy change gradually decreases until the end of curing process. In addition, it can be seen from Fig. 10 and Table 2 that compared with neat EP, Tp of EP-A and EP-B all decrease by about 15 °C. The addition of GO significantly promotes the curing process of EP, and Tp of EP-B is about 3 °C higher than that of EP-A, indicating that GO-A has a more significant catalytic effect on the curing process.
Studies have demonstrated that compounds containing hydroxyl groups can promote the reaction between EP and amines or other nucleophiles.43 Therefore, epoxy groups become more vulnerable to nucleophiles. Due to the constant generation of hydroxyl groups in the reaction process, the curing reaction between EP and amines has autocatalytic characteristics in the initial reaction stage.44 The different types of oxidizing groups on the GO surface have similar catalytic properties to the hydroxyl groups generated in the curing process of epoxy, facilitating the curing reaction of EP with amine curing agents.
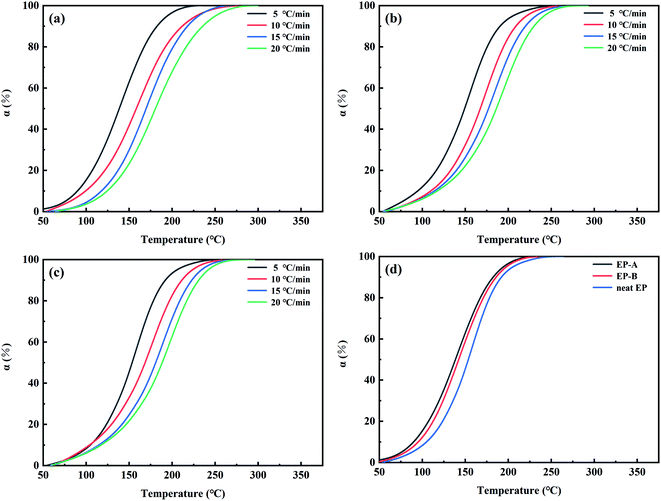
Fig. 11 shows the curve of conversion rate (α) versus the temperature of EP-A, EP-B and neat EP at the different heating rates of 5 °C min−1, 10 °C min−1, 15 °C min−1, and 20 °C min−1, respectively. α represents the degree of reaction at the particular temperature
 | (1) |
It can be concluded that GO-A with an average particle size of 190.1 nm promoted the curing process of the EP system more obviously than GO-B with average particle size of 1510 nm. This is because the surface of GO-A contains more oxidizing groups, which has a catalytic effect and accelerates the ring-opening reaction of EP.
In order to further understand the relationship between the curing rate of GO/EP system and temperature, mathematical differential treatment is performed on the curves in Fig. 11. And the T–dα/dT curves of EP-A, EP-B, and neat EP are obtained, as shown in Fig. 12. It can be seen from Fig. 12 that in the early curing stage, the curing rate increases with the increase of temperature. However, in the later stage, the curing rate gradually slows down, which is because the cross-linking occurs at the time and the system viscosity increases, making the reaction more difficult. As can be seen from Fig. 12(d), in the early curing stage, at the same temperature, EP-A has a higher curing rate, and the fastest to reach the peak curing rate. In the later stage, the curing rate is lower than EP-B and neat EP. This is because the early stage of reaction is mainly controlled by chemical reaction, and more active groups and reaction sites promote the curing reaction. However, in the later stage of reaction, the concentration of active group is greatly reduced, and the crosslinking network generated by curing limits the movement of molecules, and curing is gradually controlled by diffusion reaction. And GO blocks the molecules from moving. The larger particle size of GO, the bigger the hindering effect, but GO-A has more hindering sites at the same mass content, and a large number of sites will cooperate to restrict the movement of the reaction chain at a deeper level and larger range.46
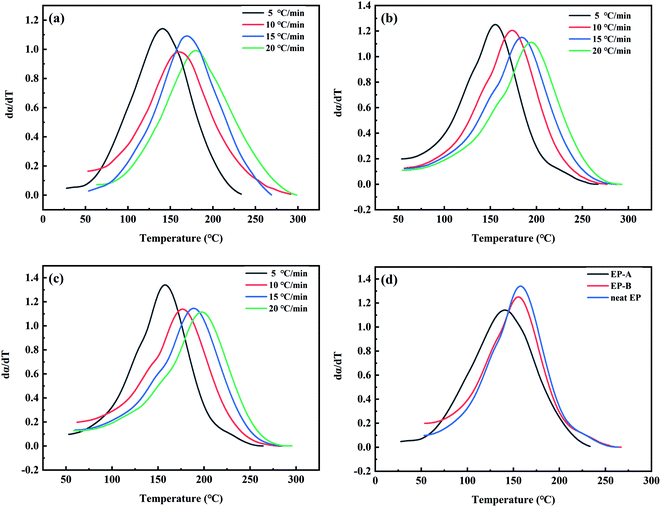 | ||
| Fig. 12 The dα/dT versus temperature of EP-A (a), EP-B (b) and neat EP (c) at different heating rates and (d) T–dα/dT diagram of EP-A, EP-B and neat EP at heating rate of 5 °C min−1. | ||
3.3 Calculation of curing activation energy
 | (2) |
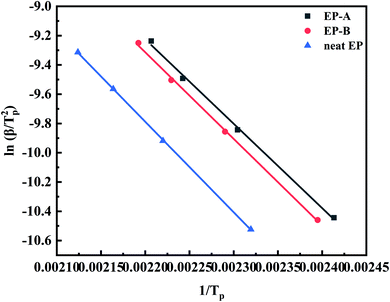
Ea can be obtained from the slope of the line of ln(β/Tp2)–1/Tp.49 Fig. 13 shows Ea calculated by the Kissinger method. Ea reflects the initial state of the non-isothermal curing reaction, and the methods are all based on the maximum reaction rate corresponding to the lowest point of the curve, i.e. Tp. According to Fig. 13 and eqn (2), Ea of EP-A, EP-B, and neat EP are 47![[thin space (1/6-em)]](https://www.rsc.org/images/entities/char_2009.gif) 395.61 J mol−1, 49
395.61 J mol−1, 49![[thin space (1/6-em)]](https://www.rsc.org/images/entities/char_2009.gif) 117.73 J mol−1, and 51
117.73 J mol−1, and 51![[thin space (1/6-em)]](https://www.rsc.org/images/entities/char_2009.gif) 445.95 J mol−1 respectively. It can be concluded that Ea of the EP system decreases after the addition of GO. Among them, Ea of EP-A decreases by about 7%, and that of EP-B goes down by about 4%.
445.95 J mol−1 respectively. It can be concluded that Ea of the EP system decreases after the addition of GO. Among them, Ea of EP-A decreases by about 7%, and that of EP-B goes down by about 4%.
 | (3) |
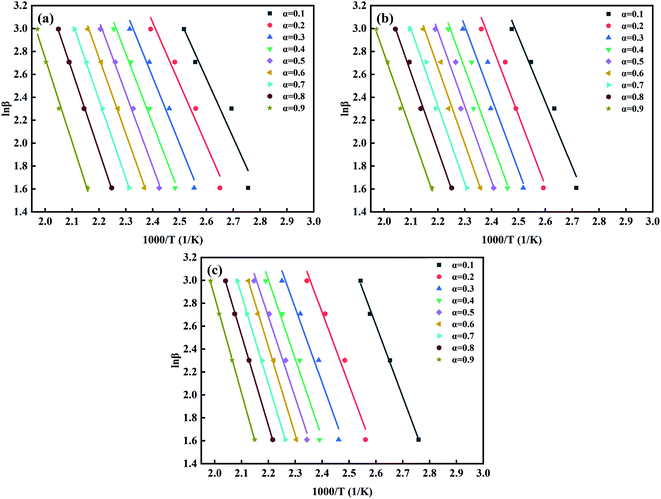
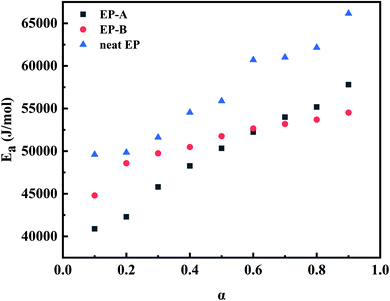
At different heating rates, when the conversion rates are 90%, 80%, 70%, 60%, 50%, 40%, 30%, 20%, and 10%, the curves of ln![[thin space (1/6-em)]](https://www.rsc.org/images/entities/char_2009.gif) β–1/T of the three kinds of composites are shown in Fig. 14. According to the slope in Fig. 14, the apparent Ea at the same conversion rate can be calculated, as shown in Fig. 15. It can be seen from Fig. 15 that the apparent Ea of EP increases with the increase of conversion rate. Possible mechanis has been proposed here: the polymerization of the EP system is complex and involves multiple reactions. In the early stage, when temperature is low, reaction mainly occurs between EP and primary amines and this reaction is most easy to occur. Also, a large number of –OH, –COOH, and other oxidizing groups on the GO surface further accelerates the curing reaction. The above factors give a low apparent Ea, and Ea of EP-A which has larger amount of oxidizing groups is lower than that of EP-B. In the later stage, when temperature is high, most primary amine is converted to secondary amine, making the reaction between secondary amine and EP becomes dominant.2,54–57 And side reactions such as etherification or homopolymerization may occur.58 So, the apparent Ea becomes higher. In addition, at the later stage, as the reactions go on, the viscosity increases and the active groups are consumed, the curing reaction is more diffusion-controlled. The larger the size of GO, the greater the hindrance effect on the diffusion movement of molecules. However, under the same mass content, GO-A has more hindrance sites, and a large number of sites will cooperate to restrict the movement of the reaction chain in a deeper and wider range.16,46,58
β–1/T of the three kinds of composites are shown in Fig. 14. According to the slope in Fig. 14, the apparent Ea at the same conversion rate can be calculated, as shown in Fig. 15. It can be seen from Fig. 15 that the apparent Ea of EP increases with the increase of conversion rate. Possible mechanis has been proposed here: the polymerization of the EP system is complex and involves multiple reactions. In the early stage, when temperature is low, reaction mainly occurs between EP and primary amines and this reaction is most easy to occur. Also, a large number of –OH, –COOH, and other oxidizing groups on the GO surface further accelerates the curing reaction. The above factors give a low apparent Ea, and Ea of EP-A which has larger amount of oxidizing groups is lower than that of EP-B. In the later stage, when temperature is high, most primary amine is converted to secondary amine, making the reaction between secondary amine and EP becomes dominant.2,54–57 And side reactions such as etherification or homopolymerization may occur.58 So, the apparent Ea becomes higher. In addition, at the later stage, as the reactions go on, the viscosity increases and the active groups are consumed, the curing reaction is more diffusion-controlled. The larger the size of GO, the greater the hindrance effect on the diffusion movement of molecules. However, under the same mass content, GO-A has more hindrance sites, and a large number of sites will cooperate to restrict the movement of the reaction chain in a deeper and wider range.16,46,58
4 Conclusions
In this study, two kinds of GO whose average particle sizes are 190.1 nm (GO-A) and 1510 nm (GO-B) were separately added to EP for researching the effect of GO size on the curing kinetics of GO/EP composites by DSC test. Curing reactions including four different heating rates were investigated, and the curing kinetic parameters of the EP-A, EP-B and neat EP were obtained by Kissinger and Ozawa method. The results revealed that the addition of GO significantly promoted the curing process of EP. Both the half curing time and the curing temperature reduced, and Tp of EP-A was lower than that of EP-B. From the calculations of Kissinger and Ozawa method, the apparent Ea of EP system increases with the increase of conversion rate, and Ea of GO/EP is lower than neat EP in the overall curing process. And Ea of EP-A is much lower in the early curing stage. However, as the curing reaction proceeds, Ea of EP-B is a little lower in the later curing stage. But EP-A has the lowest Ea combined with the whole process from Kissinger method. From all the results above, it can be concluded that the addition of GO significantly promoted the curing process of EP, and on the whole, GO-A had a better catalytic effect on the curing process.Conflicts of interest
There are no conflicts to declare.Acknowledgements
We are grateful for financial support by National Natural Science Foundation of China (NSFC, Grant No. 51503134, 51702282) and State Key Laboratory of Polymer Materials Engineering (Grant No. SKLPME 2017-3-02), and the Analytical and Testing Center of Sichuan University for providing XPS, XRD and TEM measurement.References
- Z. Hao, L. Li, X. Liao, X. Sheng and Y. Zhang, Preparation and toughening performance investigation of epoxy resins containing carbon nanotubes modified with hyperbranched polyester, Polym. Bull., 2018, 75(3), 1013–1026 CrossRef CAS.
- L. Lu, L. Xia, H. Zengheng, S. Xingyue, Z. Yi and L. Pan, Investigation on cure kinetics of epoxy resin containing carbon nanotubes modified with hyper-branched polyester, RSC Adv., 2018, 8(52), 29830–29839 RSC.
- T. Na, H. Jiang, L. Zhao and C. Zhao, Preparation and characterization of novel naphthyl epoxy resin containing 4-fluorobenzoyl side chains for low-k dielectrics application, RSC Adv., 2017, 7(85), 53970–53976 RSC.
- S. Liu, H. Yan, Z. Fang, Z. Guo and H. Wang, Effect of graphene nanosheets and layered double hydroxides on the flame retardancy and thermal degradation of epoxy resin, RSC Adv., 2014, 4(36), 18652–18659 RSC.
- I. Zaman, T. T. Phan, H.-C. Kuan, Q. Meng, L. T. B. La, L. Luong, O. Youssf and J. Ma, Epoxy/graphene platelets nanocomposites with two levels of interface strength, Polymer, 2011, 52(7), 1603–1611 CrossRef CAS.
- C. Bao, Y. Guo, L. Song, Y. Kan, X. Qian and Y. Hu, In situ preparation of functionalized graphene oxide/epoxy nanocomposites with effective reinforcements, J. Mater. Chem., 2011, 21(35), 13290–13298 RSC.
- S. Liu, V. S. Chevali, Z. Xu, D. Hui and H. Wang, A review of extending performance of epoxy resins using carbon nanomaterials, Composites, Part B, 2018, 136, 197–214 CrossRef CAS.
- A. Reghunadhan, J. Datta, N. Kalarikkal, J. T. Haponiuk and S. Thomas, Toughness augmentation by fibrillation and yielding in nanostructured blends with recycled polyurethane as a modifier, Appl. Surf. Sci., 2018, 442, 403–411 CrossRef CAS.
- L. Vertuccio, S. Russo, M. Raimondo, K. Lafdi and L. Guadagno, Influence of carbon nanofillers on the curing kinetics of epoxy-amine resin, RSC Adv., 2015, 5(110), 90437–90450 RSC.
- B. Zhou, Y. Li, G. Zheng, K. Dai, C. Liu, Y. Ma, J. Zhang, N. Wang, C. Shen and Z. Guo, Continuously fabricated transparent conductive polycarbonate/carbon nanotube nanocomposite films for switchable thermochromic applications, J. Mater. Chem. C, 2018, 6(31), 8360–8371 RSC.
- F. Zhang, W. Jiang, X. Song, J. Kang, Y. Cao and M. Xiang, Effects of Hyperbranched Polyester-Modified Carbon Nanotubes on the Crystallization Kinetics of Polylactic Acid, ACS Omega, 2021, 6(15), 10362–10370 CrossRef CAS PubMed.
- Y. Yu, F. Zeng, J. Chen, J. Kang, F. Yang, Y. Cao and M. Xiang, Effects of ordered structure on non-isothermal crystallization kinetics and subsequent melting behavior of β-nucleated isotactic polypropylene/graphene oxide composites, J. Therm. Anal. Calorim., 2019, 136, 1667–1678 CrossRef CAS.
- Y. Yu, R. Xu, J. Chen, J. Kang, M. Xiang, Y. Li, L. Li and X. Sheng, Ordered structure effects on β-nucleated isotactic polypropylene/graphene oxide composites with different thermal histories, RSC Adv., 2019, 9(34), 19630–19640 RSC.
- Y. Yu, F. Zeng, J. Chen, J. Kang, F. Yang, Y. Cao and M. Xiang, Regulating polycrystalline behavior of the β-nucleated isotactic polypropylene/graphene oxide composites by melt memory effect, Polym. Compos., 2018, 40(S1), E440–E448 Search PubMed.
- Y. Yu, F. Zeng, J. Chen, J. Kang, F. Yang, Y. Cao and M. Xiang, Isothermal Crystallization Kinetics and Subsequent Melting Behavior of β-Nucleated Isotactic Polypropylene/Graphene Oxide Composites with Different Ordered Structure, Polym. Int., 2018, 67(9), 1212–1220 CrossRef CAS.
- L. Li, Z. Zeng, H. Zou and M. Liang, Curing characteristics of an epoxy resin in the presence of functional graphite oxide with amine-rich surface, Thermochim. Acta, 2015, 614, 76–84 CrossRef CAS.
- S. H. Ryu, J. H. Sin and A. M. Shanmugharaj, Study on the effect of hexamethylene diamine functionalized graphene oxide on the curing kinetics of epoxy nanocomposites, Eur. Polym. J., 2014, 52, 88–97 CrossRef CAS.
- T. Kuilla, S. Bhadra, D. Yao, N. Kim, S. Bose and J. Lee, Recent advances in graphene based polymer composites, Prog. Polym. Sci., 2010, 35(11), 1350–1375 CrossRef CAS.
- J. Abenojar, M. Martínez, F. Velasco, V. Pascual-Sánchez and J. Martín-Martínez, Effect of boron carbide filler on the curing and mechanical properties of an epoxy resin, J. Adhes., 2009, 85(4–5), 216–238 CrossRef CAS.
- Y. Zhao and D. Drummer, Influence of filler content and filler size on the curing kinetics of an epoxy resin, Polymers, 2019, 11(11), 1797 CrossRef CAS PubMed.
- J. Bae, J. Jang and S. H. Yoon, Cure Behavior of the Liquid-Crystalline Epoxy/Carbon Nanotube System and the Effect of Surface Treatment of Carbon Fillers on Cure Reaction, Macromol. Chem. Phys., 2002, 203(15), 2196–2204 CrossRef CAS.
- H. Xie, B. Liu, Q. Sun, Z. Yuan, J. Shen and R. Cheng, The influence of vapor-grown carbon fibers on the cure reaction of epoxy and the curing kinetics of the composites, Acta Polym. Sin., 2005,(6), 891–895 CAS.
- T. Liu, D. Chen, Y. Cao, F. Yang, J. Chen, J. Kang, R. Xu and M. Xiang, Construction of a composite microporous polyethylene membrane with enhanced fouling resistance for water treatment, J. Membr. Sci., 2021, 618, 118679 CrossRef CAS.
- R. Xu, J. Wang, D. Chen, T. Liu, Z. Zheng, F. Yang, J. Chen, J. Kang, Y. Cao and M. Xiang, Preparation and performance of a charge-mosaic nanofiltration membrane with novel salt concentration sensitivity for the separation of salts and dyes, J. Membr. Sci., 2020, 595, 117472 CrossRef.
- B. Xiong, R. Chen, F. Zeng, J. Kang and Y. Men, Thermal shrinkage and microscopic shutdown mechanism of polypropylene separator for lithium-ion battery: in situ ultra-small angle X-ray scattering study, J. Membr. Sci., 2018, 545, 213–220 CrossRef CAS.
- J. Wang, R. Xu, F. Yang, J. Kang, Y. Cao and M. Xiang, Probing influences of support layer on the morphology of polyamide selective layer of thin film composite membrane, J. Membr. Sci., 2018, 556, 374–383 CrossRef CAS.
- J. Kang, D. Chen, B. Xiong, N. Zheng, F. Yang, M. Xiang and Z. Zheng, A facile route for the fabrication of polypropylene separators for lithium ion batteries with high elongation and strong puncture resistance, Ind. Eng. Chem. Res., 2019, 58(51), 23135–23142 CrossRef CAS.
- Y. Yu, B. Xiong, F. Zeng, R. Xu, F. Yang, J. Kang, M. Xiang, L. Li, X. Sheng and Z. Hao, Influences of Compression on the Mechanical Behavior and Electrochemical Performances of Separators for Lithium Ion Batteries, Ind. Eng. Chem. Res., 2018, 57(50), 17142–17151 CrossRef CAS.
- Q. Zhang, H. Peng, J. Kang, Y. Cao and M. Xiang, Effects of melt structure on non-isothermal crystallization behavior of isotactic polypropylene nucleated with α/β compounded nucleating agents, Polym. Eng. Sci., 2017, 57(9), 989–997 CrossRef CAS.
- J. Kang, F. Yang, J. Chen, Y. Cao and M. Xiang, Influences of molecular weight on the non-isothermal crystallization and melting behavior of β-nucleated isotactic polypropylene with different melt structures, Polym. Bull., 2017, 74(5), 1461–1482 CrossRef CAS.
- J. Wang, S. Zhang, Q. Liu, S. Du, Y. C. Guo, N. Zheng and F. Y. Wang, Conditional Uncorrelation and Efficient Subset Selection in Sparse Regression, IEEE Trans. Cybern., 2021, 1–10 Search PubMed.
- J. Wang, N. Zheng, B. Chen, P. Chen, S. Chen, Z. Liu, F. Wang and B. Xi, Multivariate Correlation Entropy and Law Discovery in Large Data Sets, IEEE Intell. Syst., 2018, 33(5), 47–54 CAS.
- R. Xu, G. Xu, J. Wang, J. Chen, F. Yang, J. Kang and M. Xiang, Influence of l-lysine on the permeation and antifouling performance of polyamide thin film composite reverse osmosis membranes, RSC Adv., 2018, 8(44), 25236–25247 RSC.
- R. Xu, J. Wang, D. Chen, F. Yang, J. Kang, M. Xiang, L. Li and X. Sheng, Preparation of pH-responsive asymmetric polysulfone ultrafiltration membranes with enhanced anti-fouling properties and performance by incorporating poly(2-ethyl-2-oxazoline) additive, RSC Adv., 2018, 8(72), 41270–41279 RSC.
- J. Kang, G. Weng, Z. Chen, J. Chen, Y. Cao, F. Yang and M. Xiang, New understanding in the influence of melt structure and β-nucleating agents on the polymorphic behavior of isotactic polypropylene, RSC Adv., 2014, 56(4), 29514–29526 RSC.
- J. Kang, J. Chen, Y. Cao and H. Li, Effects of ultrasound on the conformation and crystallization behavior of isotactic polypropylene and [beta]-isotactic polypropylene, Polymer, 2010, 51(1), 249–256 CrossRef CAS.
- C. Ma, L. Peng, Y. Feng, J. Shen, Z. Xiao, K. Cai, Y. Yu, Y. Min and A. J. Epstein, Polyfurfuryl alcohol spheres template synthesis of 3D porous graphene for high-performance supercapacitor application, Synth. Met., 2016, 220, 227–235 CrossRef CAS.
- S. Stankovich, D. A. Dikin, R. D. Piner, K. A. Kohlhaas, A. Kleinhammes, Y. Jia, Y. Wu, S. T. Nguyen and R. S. Ruoff, Synthesis of graphene-based nanosheets via chemical reduction of exfoliated graphite oxide, Carbon, 2007, 45(7), 1558–1565 CrossRef CAS.
- D. A. Nguyen, Y. R. Lee, A. V. Raghu, H. M. Jeong, C. M. Shin and B. K. Kim, Morphological and physical properties of a thermoplastic polyurethane reinforced with functionalized graphene sheet, Polym. Int., 2009, 58(4), 412–417 CrossRef CAS.
- S.-Y. Yang, W.-N. Lin, Y.-L. Huang, H.-W. Tien, J.-Y. Wang, C.-C. M. Ma, S.-M. Li and Y.-S. Wang, Synergetic effects of graphene platelets and carbon nanotubes on the mechanical and thermal properties of epoxy composites, Carbon, 2011, 49(3), 793–803 CrossRef CAS.
- X. Wang, J. Jin and M. Song, Cyanate ester resin/graphene nanocomposite: curing dynamics and network formation, Eur. Polym. J., 2012, 48(6), 1034–1041 CrossRef CAS.
- M. Huskić, S. Bolka, A. Vesel, M. Mozetič, A. Anžlovar, A. Vizintin and E. Žagar, One-step surface modification of graphene oxide and influence of its particle size on the properties of graphene oxide/epoxy resin nanocomposites, Eur. Polym. J., 2018, 101, 211–217 CrossRef.
- B. A. Rozenberg, Kinetics, thermodynamics and mechanism of reactions of epoxy oligomers with amines, Epoxy resins and composites II, 1986, pp. 113–165 Search PubMed.
- H. Xie, B. Liu, Z. Yuan, J. Shen and R. Cheng, Cure kinetics of carbon nanotube/tetrafunctional epoxy nanocomposites by isothermal differential scanning calorimetry, J. Polym. Sci. Pol. Phys., 2004, 42(20), 3701–3712 CrossRef CAS.
- H. Xie, B. Liu, Q. Sun, Z. Yuan, J. Shen and R. Cheng, Cure kinetic study of carbon nanofibers/epoxy composites by isothermal DSC, J. Appl. Polym. Sci., 2005, 96(2), 329–335 CrossRef CAS.
- X. Wang, J. Jin, M. Song and Y. Lin, Effect of graphene oxide sheet size on the curing kinetics and thermal stability of epoxy resins, Mater. Res. Express, 2016, 3(10), 105303 CrossRef.
- X. He, J. Wang, N. Ramdani, W. Liu, L. Liu and L. Yang, Investigation of synthesis, thermal properties and curing kinetics of fluorene diamine-based benzoxazine by using two curing kinetic methods, Thermochim. Acta, 2013, 564, 51–58 CrossRef CAS.
- X. He, J. Wang, Y. Wang, C. Liu, W. Liu and L. Yang, Synthesis, thermal properties and curing kinetics of fluorene diamine-based benzoxazine containing ester groups, Eur. Polym. J., 2013, 49(9), 2759–2768 CrossRef CAS.
- H. E. Kissinger, Reaction kinetics in differential thermal analysis, Anal. Chem., 1957, 29(11), 1702–1706 CrossRef CAS.
- S. Vyazovkin, A. K. Burnham, J. M. Criado, L. A. Pérez-Maqueda, C. Popescu and N. Sbirrazzuoli, ICTAC Kinetics Committee recommendations for performing kinetic computations on thermal analysis data, Thermochim. Acta, 2011, 520(1–2), 1–19 CrossRef CAS.
- R. L. Blaine and H. E. Kissinger, Homer Kissinger and the Kissinger equation, Thermochim. Acta, 2012, 540, 1–6 CrossRef CAS.
- C. S. Wang and C. H. Lin, Novel phosphorus-containing epoxy resins. Part II: curing kinetics, Polymer, 2000, 41(24), 8579–8586 CrossRef CAS.
- H.-W. Cui, K. Suganuma and H. Uchida, Using the Ozawa method to study the thermally initiated curing kinetics of vinyl ester resin, RSC Adv., 2015, 5(4), 2677–2683 RSC.
- J. Wu, J. Guo, Q. Zhang, L. Gao, H. Li, H. Deng, W. Jiang, G. Sui and X. Yang, Effect of different amino functionalized carbon nanotubes on curing behavior and mechanical properties of carbon fiber/epoxy composites, Polym. Compos., 2018, 39(S2), E733–E744 CrossRef CAS.
- T. Tsafack, J. M. Alred, K. E. Wise, B. Jensen, E. Siochi and B. I. Yakobson, Exploring the interface between single-walled carbon nanotubes and epoxy resin, Carbon, 2016, 105, 600–606 CrossRef CAS.
- K. Yang, M. Gu and Y. Jin, Cure behavior and thermal stability analysis of multiwalled carbon nanotube/epoxy resin nanocomposites, J. Appl. Polym. Sci., 2008, 110(5), 2980–2988 CrossRef CAS.
- A. Moroni, J. Mijovic, E. M. Pearce and C. C. Foun, Cure kinetics of epoxy resins and aromatic diamines, J. Appl. Polym. Sci., 1986, 32(2), 3761–3773 CrossRef CAS.
- N. Sbirrazzuoli, A. Mititelu-Mija, L. Vincent and C. Alzina, Isoconversional kinetic analysis of stoichiometric and off-stoichiometric epoxy-amine cures, Thermochim. Acta, 2006, 447(2), 167–177 CrossRef CAS.
| This journal is © The Royal Society of Chemistry 2021 |

