 Open Access Article
Synthesis, characterizations and electrochemical performances of anhydrous CoC2O4 nanorods for pseudocapacitive energy storage applications
Neeraj Kumar Mishra,
Rakesh Mondal and
Preetam Singh *
*
Department of Ceramic Engineering, Indian Institute of Technology (Banaras Hindu University) Varanasi, Uttar Pradesh 221005, India. E-mail: preetamsingh.cer@itbhu.ac.in; preetamchem@gmail.com; Tel: +91-9473720659
First published on 20th October 2021
Abstract
To overcome the environmental challenges caused by utilization of fossil fuel based energy technologies and to utilize the full potential of renewable energy sources such as solar, wind and tidal, high power and high energy density containing large scale electrochemical energy storage devices are a matter of concern and a need of the hour. Pseudocapacitors with accessibility to multiple oxidation states for redox charge transfer can achieve a higher degree of energy storage density compared to electric double layer capacitors (EDLC) and the hybrid supercapacitor is one of the prominent electrochemical capacitors that can resolve the low energy density issues associated with EDLCs. Due to its open pore framework structure with superior structural stability and accessibility of Co2+/3+/4 redox states, porous anhydrous CoC2O4 nanorods are envisaged here as a potential energy storage electrode in a pseudo-capacitive mode. Superior specific capacitance equivalent to 2116 F g−1 at 1 A g−1 in the potential window of 0.3 V was observed for anhydrous CoC2O4 nanorods in aqueous 2 M KOH electrolyte. A predominant pseudo-capacitive mechanism seems to be operative behind the high charge storage at electrodes as intercalative (Inner) and surface (outer) charge storage contributions were found to be 75% and 25% respectively. Further, in full cell asymmetric supercapacitor (ASC) mode in which porous anhydrous CoC2O4 nanorods were used as positive electrodes and activated carbon (AC) was utilised as negative electrodes within an operating potential window of 1.3 V, a highest specific energy of W h kg−1 and specific power of ∼647 W kg−1 at 0.5 A g−1 current density were obtained with superior cycling stability. High cycling stability coupled with superior electrochemical storage properties make anhydrous CoC2O4 nanorods potential pseudo-capacitive electrodes for large scale energy storage applications.
Introduction
Large scale energy extraction from fossil fuel to overcome the ever increasing energy demand of mankind is resulting in a continuous increase in CO2 and other toxic greenhouse exhaust in the atmosphere. Renewable green energy is an alternating pathway for supplementary energy supply to tackle the growing energy demand and depletion of fossil fuels. Energy harnessed by renewable energy sources such as solar and wind can also be stored in electrochemical energy conversion and storage devices for a continuous and stable power supply due to its superior conversion efficiency from chemical energy to electrical energy.1 Energy storage processes at electrode surfaces occur differently depending on the interaction occurring at the electrode surface between the electrode and electrolyte such as EDLC, surface redox reaction and intercalation of ions.2,3 Faradaic charge transfer due to a very fast sequence of reversible redox reactions, electrosorption or intercalation processes on the surface of suitable electrodes (called pseudocapacitance) results in a higher degree of electrochemical charge storage than EDLC.4–6 Psuedocapacitive electrodes in the form of asymmetric supercapapacitors can provide simultaneous solutions for high power delivery and superior energy storage.7–10 To increase higher energy density, asymmetric cells can provide better performance where capacitor components store electrochemical energy by electrostatic force and battery components enhance the electron transfer in the hybrid electrode system and perform better charge transfer reaction at high rates.11 RuO2 was first reported material to show pseudo-capacitive charge storage behaviour.7 MnO2·xH2O also performed as a capacitor in neutral electrolyte.8 However most oxide materials suffer from structural instability and performance degradation issues.8–10 Metal–organic frameworks (MOFs) are open framework structures where materials are constructed by joining metal-containing units with organic linkers creating permanent porosity.12 Porous metal oxalate materials were studied to have faradaic pseudocapacitive characteristics, a reversible redox reaction mechanism seems to operate on the surface of metal oxalates.13In this work, we present the synthesis of anhydrous CoC2O4 Nanorods in twos step process and electrochemical study of the electrode in aqueous electrolyte that show superior performance of the electrode for pseudocapacitor applications. Superior specific capacitive charge storage close to 2116 F g−1 at 1 A g−1 was observed for porous anhydrous CoC2O4 Nano rods compared to capacitance equivalent to 840 F g−1 at 1 A g−1 for hydrated CoC2O4·2H2O in aqueous 2 M KOH electrolyte. Further, electrode performances was studied in Asymmetric supercapacitors (ASCs) mode in which porous anhydrous CoC2O4 nanorods were made as positive electrode and Activated Carbon (AC) as negative electrode and a highest specific energy equivalent to W h kg−1 and specific power ∼647 W kg−1 was obtained at 0.5 A g−1. Synthesis, characterizations of porous anhydrous CoC2O4 nanorod and the detailed electrochemistry developed electrodes is presented in this manuscript.
Experimental
Synthesis
Synthesis of porous anhydrous CoC2O4 nanorod was carried out by two step process. 2.91 g (10 mM) of Co(NO3)2·6H2O was dissolved in 200 ml of deionised water with continuous stirring in a beaker placed at a hot plate magnetic stirrer and 1.27 g (10 mM) H2C2O4·2H2O) were added in the solution. The entire mixture was stirred vigorously at 80 °C for 3 h. After 3 h of stirring green colour powder CoC2O4·2H2O was precipitated. The obtained product is then washed several times with deionized water. Finally, the washed product CoC2O4·2H2O was dried in hot air oven at 90 °C for overnight. Anhydrous CoC2O4 was produced after heating the materials at 220 °C for 3 h. Formation of Anhydrous CoC2O4 can be represented by following equations given below;| Co(NO3)2·6H2O + H2C2O4·2H2O → CoC2O4·2H2O↓ + 2HNO3 + 2H2O at 80 °C | (1) |
| CoC2O4·2H2O → CoC2O4 + 2H2O↑ at 210 °C | (2) |
Characterizations
The crystal structure and phase purity of synthesised products were characterized through RigakuMiniflex desktop X-ray diffractometer (XRD) with Cu-Ka radiation (λ = 0.154 nm) in the 2θ range of 10–90° with a step size of 0.02°. Xpert High Score (PANanylytical) software was used to identify the required phase. FE-SEM (FP 5022/22) was used to determine the surface morphology and particle size distribution of the samples. Infrared spectra of the samples were recorded using Nicolet iS5 FTIR spectrometer in the range of 400 to 4000 cm−1. Pore size distribution and specific surface area of the sample were measured by BET (MicrotracBEL). All electrochemical performances of the sample including cyclic voltammetry (CV), galvanistic charge discharge (GCD) and electrochemical impedance spectroscopy (EIS) measurements were conducted in a conventional three-electrode arrangement and measured by Metrohm Autolab (PGSTAT204) equipped with FRA32 M module. Electrochemical measurements were analysed using NOVA1.1 software.Preparation of electrodes
Hydrated CoC2O4·2H2O and anhydrous porous CoC2O4 working electrodes were prepared by taking of active material, activated carbon (AC) and binder polyvinylidene difluoride (PVDF) in the ratio of 7![[thin space (1/6-em)]](https://www.rsc.org/images/entities/char_2009.gif) :
:![[thin space (1/6-em)]](https://www.rsc.org/images/entities/char_2009.gif) 2
2![[thin space (1/6-em)]](https://www.rsc.org/images/entities/char_2009.gif) :
:![[thin space (1/6-em)]](https://www.rsc.org/images/entities/char_2009.gif) 1 in N-methyl-2-pyrrolidone (NMP) solvent. Homogenous slurry was prepared in mortar and slurry was casted over Toray carbon paper. The materials (paste) loading was 1 mg over 1 cm2 area of. Coated electrode was dried at 80 °C for 12 h.
1 in N-methyl-2-pyrrolidone (NMP) solvent. Homogenous slurry was prepared in mortar and slurry was casted over Toray carbon paper. The materials (paste) loading was 1 mg over 1 cm2 area of. Coated electrode was dried at 80 °C for 12 h.
Results and discussions
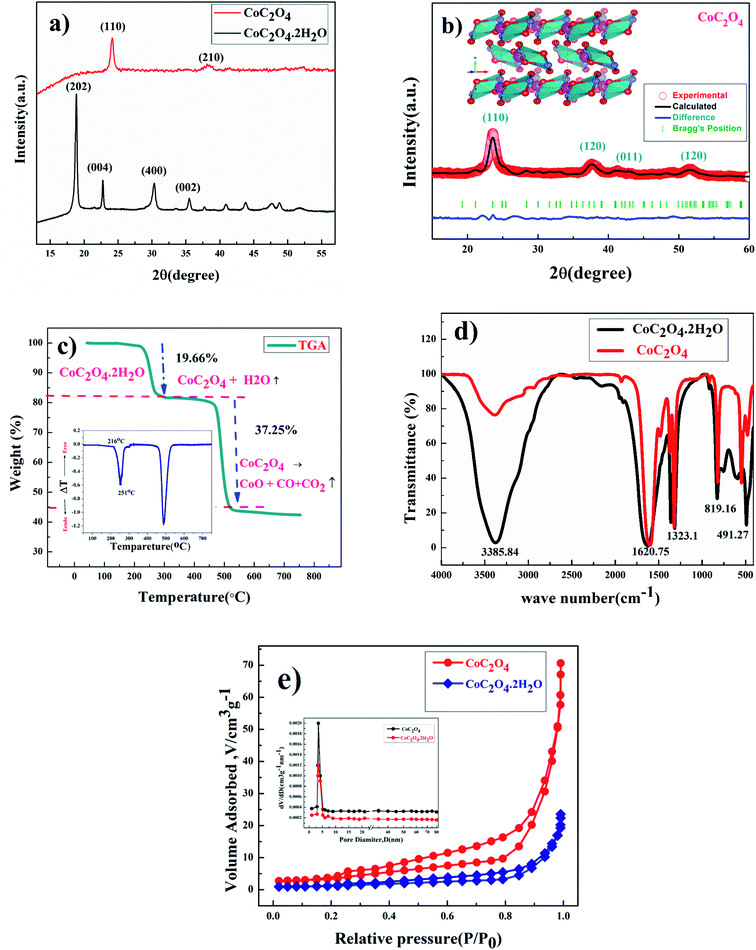
Fig. 1(a) shows the powder XRD pattern of prepared CoC2O4·2H2O and anhydrous CoC2O4 sample in the 2θ range of 10–60° with step size 0.02°. Phase identification was done by philips x'pert highscore. The prominent sharp diffraction peak of CoC2O4·2H2O matches well with β-orthorhombic phase (space group: Cccm, JCPDS no. 25-0250) with lattice parameter a = 11.877 Å, b = 5.419 Å, and c = 15.624 Å.14 As confirmed by the XRD study, After annealing at 220 °C for 5 h, CoC2O4·2H2O was transformed to anhydrous CoC2O4 in α-monoclinic structure (space group P21/n, JCPDS no. 37-0719), Fig. 1(b) shows Rietveld Refinement powder XRD pattern of CoC2O4 and inset show the VESTA image of the crystal. Lattice parameter of anhydrous CoC2O4 was found to be a = 5.26400 Å, b = 5.66000 Å, c = 7.17900 Å with cell angle equivalent to α – 90°, β – 118.88°, γ – 90°.15Thermo-gravimetric analysis (TGA) curve shown in Fig. 1(c) was carried out to quantitatively analyze the weight loss assisted phase transformation. First weight loss occurred from 100–300 °C, which corresponds to the removal of structural water from the sample between this temperature range resulting phase formation of anhydrous CoC2O4 in monoclinic structure. TGA curve determine the weight loss equivalent to 19.66% or 2 mole of water per molecule between this temperatures. Similarly, second weight loss step equivalent to 37.25% occurs in the temperature range of 350–500 °C due to decomposition of CoC2O4.16 The weight losses can be represented as:
| CoC2O4·2H2O → CoC2O4 + 2H2O (above T ∼200 °C) | (3) |
| CoC2O4 → CoO + CO + CO2 (above T ∼ 450 °C) | (4) |
The inset of Fig. 1(C) present the Differential Thermal Analysis (DTA) curve. The rate of weight loss reaching to peak at 250 °C with peak starts at 216 °C. That is why we did calcinations or water removal step at 220 °C to get controlled or slow water release to preserve the high surface area of the material to stop or avoid the particle segregation.
FTIR spectrums of CoC2O4·2H2O and anhydrous CoC2O4 powder samples are shown in Fig. 1(d) reveals the presence of different functional groups at different wavenumber (cm−1). The broad peak at 3385.84 cm−1 ascribed to the stretching vibration of hydroxyl group (–OH) which signifies the presence of water in the compound. The observed peak at 1620.75 cm−1 was assigned for anti-symmetric carbonyl stretching band (C![[double bond, length as m-dash]](https://www.rsc.org/images/entities/char_e001.gif) O) specific to the oxalate group.20 Two weak peaks at 1365.52 cm−1 and 1323.1 cm−1 was attributed to vibrations of C2O42− (C–O) + (C–C) and (C–O) + (O–C
O) specific to the oxalate group.20 Two weak peaks at 1365.52 cm−1 and 1323.1 cm−1 was attributed to vibrations of C2O42− (C–O) + (C–C) and (C–O) + (O–C![[double bond, length as m-dash]](https://www.rsc.org/images/entities/char_e001.gif) O), respectively. Peak at 819.16 cm−1 was assigned to the vibration mode of C2O42−, O–C
O), respectively. Peak at 819.16 cm−1 was assigned to the vibration mode of C2O42−, O–C![[double bond, length as m-dash]](https://www.rsc.org/images/entities/char_e001.gif) O bending vibrations (O–C
O bending vibrations (O–C![[double bond, length as m-dash]](https://www.rsc.org/images/entities/char_e001.gif) O). The absorption peak at 491.27 cm−1 can be attributed to Co–O bonding present in prepared sample of CoC2O4·2H2O. Compared to CoC2O4·2H2O, almost negligible peak strength for stretching vibration of hydroxyl group (–OH) near 3385.84 cm−1 was observed in anhydrous CoC2O4 sample prepared by heating at 220 °C for 3 h as shown in Fig. 1(c).17 Rest vibration frequencies are observed almost at same position as of CoC2O4·2H2O. Fig. 1(e) represents the BET surface area measurement results for CoC2O4·2H2O and anhydrous CoC2O4 samples. Large nitrogen absorption/desorption isotherm was observed for anhydrous CoC2O4 compared to CoC2O4·2H2O. The nitrogen adsorption and desorption isotherm shows characteristics which is corresponding to mesoporous structure for the anhydrous cobalt oxalate (CoC2O4) sample. The calculated BET specific surface area and average pore diameter was found 60.9 m2 g−1 and 3.72 nm, respectively. Mesopores structures can contribute to excellent electrochemical performance due to high porosity. The calculated the mesopores diameter of CoC2O4 sample is much bigger than the ions of present in aqueous electrolytes.18,19
O). The absorption peak at 491.27 cm−1 can be attributed to Co–O bonding present in prepared sample of CoC2O4·2H2O. Compared to CoC2O4·2H2O, almost negligible peak strength for stretching vibration of hydroxyl group (–OH) near 3385.84 cm−1 was observed in anhydrous CoC2O4 sample prepared by heating at 220 °C for 3 h as shown in Fig. 1(c).17 Rest vibration frequencies are observed almost at same position as of CoC2O4·2H2O. Fig. 1(e) represents the BET surface area measurement results for CoC2O4·2H2O and anhydrous CoC2O4 samples. Large nitrogen absorption/desorption isotherm was observed for anhydrous CoC2O4 compared to CoC2O4·2H2O. The nitrogen adsorption and desorption isotherm shows characteristics which is corresponding to mesoporous structure for the anhydrous cobalt oxalate (CoC2O4) sample. The calculated BET specific surface area and average pore diameter was found 60.9 m2 g−1 and 3.72 nm, respectively. Mesopores structures can contribute to excellent electrochemical performance due to high porosity. The calculated the mesopores diameter of CoC2O4 sample is much bigger than the ions of present in aqueous electrolytes.18,19
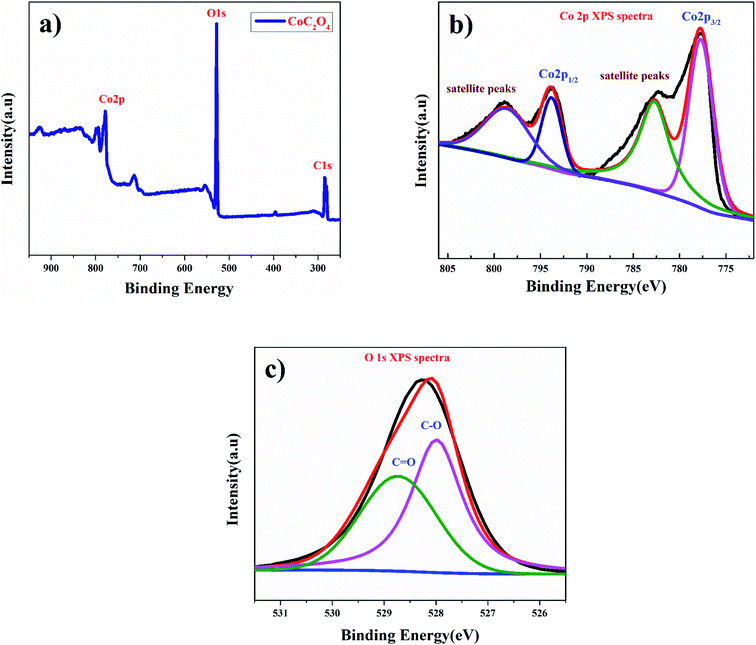
Fig. 2(a) shows the X-ray photoelectron spectroscopy (XPS) survey of anhydrous CoC2O4 sample confirming the presence of Co. The Co (2p) spectrum shown in Fig. 2(b) are assigned to 2p3/2 at 778.84 eV and 2p1/2 at 797.87 eV along with corresponding satellite peaks at 782.3 and 798.87 eV for Co2+ ions.20 Fig. 2(c) show the O 1s spectra consist with merger of two peaks for corresponding binding energy at 527.98 eV for C–O bonding and at 528.78 eV for C![[double bond, length as m-dash]](https://www.rsc.org/images/entities/char_e001.gif) O bonding.
O bonding.
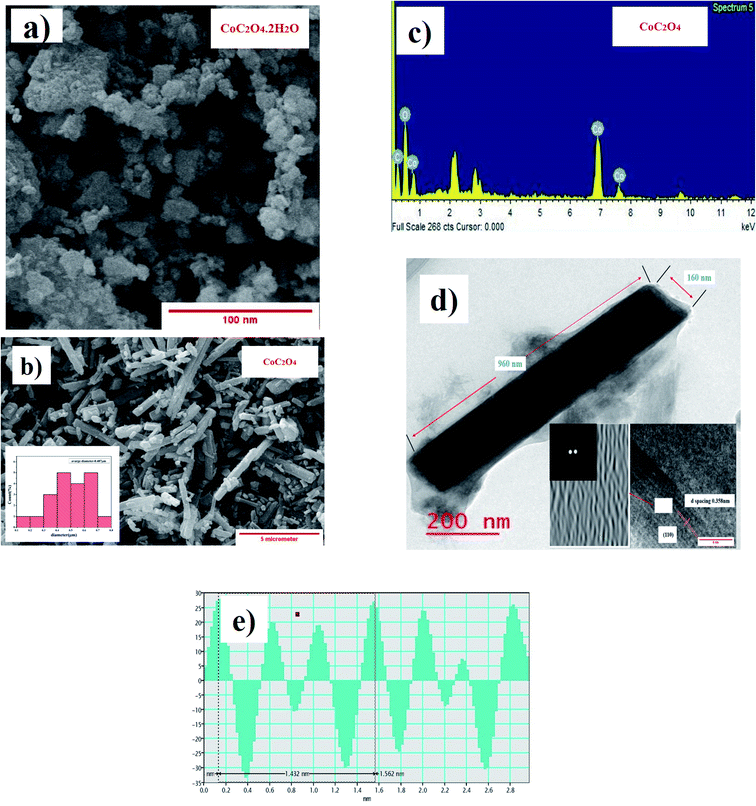
SEM image shown in Fig. 3(a) show particle size distribution and flakes type morphology of CoC2O4·2H2O power sample. Fig. 3(b) show particle size distribution and morphology of anhydrous CoC2O4 power sample. Nanorods type particle morphology was visible in the range of 300–700 nanometer size with average particle size approaching to 487 nm as analyzed by ImageJ software. The slow release of water molecule in control dehydration step (calcinations at 220 °C) resulted the formation nanorods of anhydrous CoC2O4. Fig. 3(b) shows the (energy dispersive X-ray analysis) result and elemental analysis confirm the composition of anhydrous CoC2O4. TEM image shown in Fig. 3(d) represent single particle and atomistic arrangements at localized regions of the powder materials grown as a single rod with diameter 160 nm and length 960 nm. The insert images represent FFT (Fast Furrier Transformation) and inverse FFT of the sample particle. Fig. 3(e) represent of calculated d spacing 0.358 nm of (110) plane for anhydrous CoC2O4 phase.
Electrochemical studies
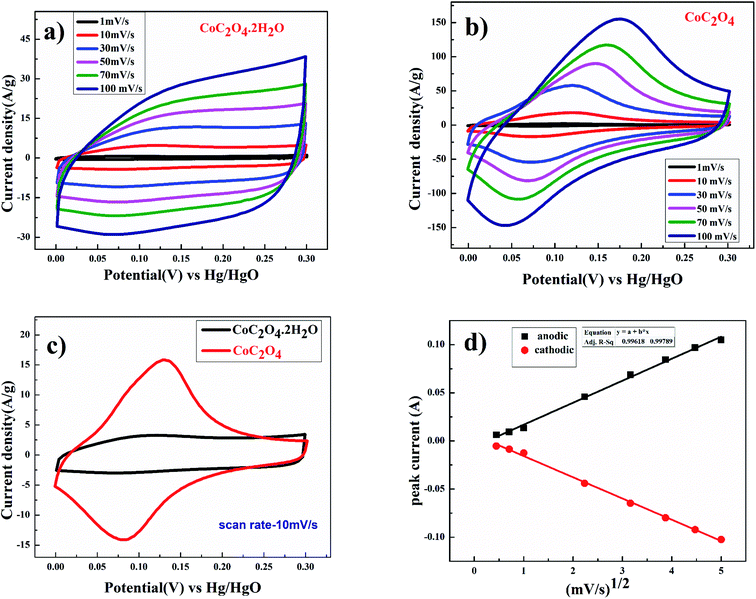
Electrochemical performance of CoC2O4·2H2O and porous anhydrous CoC2O4 as a working electrode were characterized using a three-electrode system where CoC2O4·2H2O and porous anhydrous CoC2O4 act as a working electrodes, Hg/HgO (1 M KOH) as a reference electrode, and Platinum as counter electrode in 2 M KOH as an electrolyte. The charge storing capacity of CoC2O4·2H2O and porous anhydrous CoC2O4 electrodes were mainly calculated using cyclic voltammetry (CV) curve between the potential range of 0 V to 0.30 V. Fig. 4(a) represent the CV curve of CoC2O4·2H2O. The nature of curve represents pseudo capacitive charge storage behaviour coupled with surface redox (electrosorption). Fig. 4(b) present the CV curve of porous anhydrous CoC2O4 nanorods represent pseudo-capacitive storage couple with surface redox and anion intercalations.21a Redox peaks are originated due to the reversible transformation between Co2+ to Co3+ during electrosorption (redox) of OH− ion. Co2+/3+ redox peak appears around 0.17 V vs. Hg/HgO reference electrode. The nanostructuring seems to play important role in lowering down the redox peak (Co2+/3+) on anhydrous CoC2O4 nanorods compared to the redox peak reported in the literature.21b| Co(II)C2O4·2H2O + OHsol− ↔ Co(III)(OH−)C2O4·2H2O + e− | (5) |
| Co(II)C2O4 + OHsol− ↔ Co(III) (OH−)C2O4 + e− | (6) |
From the CV curve, specific capacitance C (F g−1) can also be calculated as one of the significant parameters to understand the electrochemical performance of working electrode.22
 | (7) |
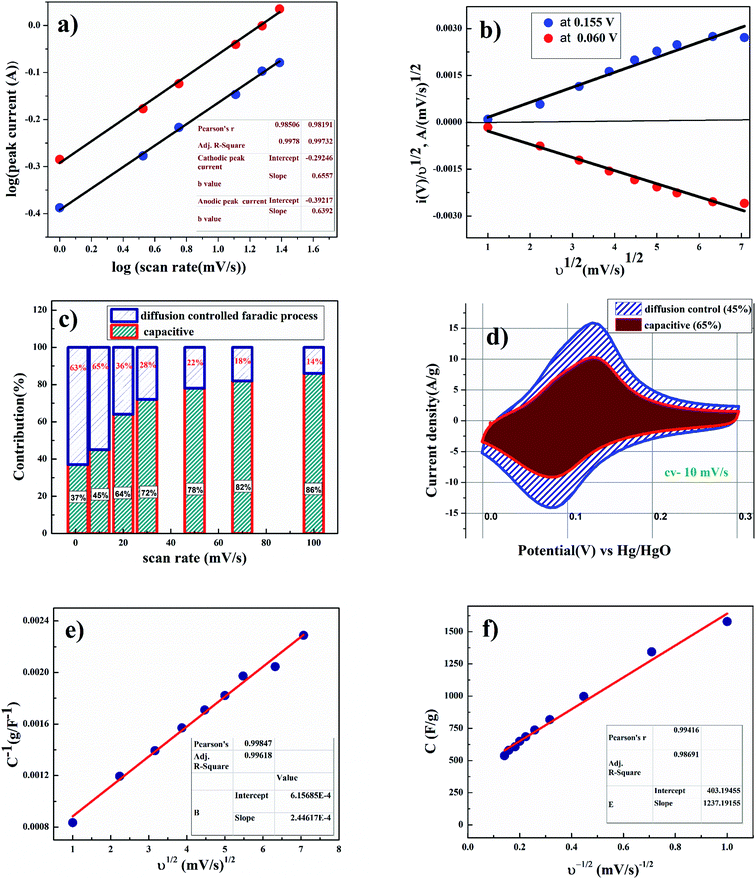
Fig. 4(d) shows the linear relation between anodic and cathodic peak current with respect to square root of scan rate. This indicates that porous CoC2O4 nanorods exhibit semi-infinite diffusion controlled process. Furthermore, kinetics of electrode can be understood by determining diffusion coefficient. The diffusion coefficient for the electrode was determined using Randles–Sevick eqn.23
| ip = 2.686 × 10⁵ × n3/2AD1/2Cov1/2 | (8) |
To further understand the diffusion mechanism qualitatively to differentiate the charge storage kinetics of different range of charge storage from battery type to supercapacitors mode, power-law equation given below was used.
| i = aνb | (9) |
As shown in Fig. 5(b), voltammetry sweep rate dependence can distinguish quantitatively the capacitive contribution to the current response. The current response at a fixed potential is the combination of two separate mechanisms, surface capacitive effects and diffusion-controlled insertion.
 | (10) |
For more understanding eqn (4) was modified
 | (11) |
From eqn (9) k1 υ and k2 υ1/2 defines the current contributions from the surface capacitive effects and the diffusion-controlled intercalation process respectively. Thus after determination k1 and k2, at specific potentials, the fraction of the current due to each of these contributions can be quantified.26 Values for k1 and k2 are determined from slop and intercept of y axis from linear fitting of the curve. The representative curve of i(V)/υ1/2 vs. υ1/2 is shown in Fig. 5(b). Contribution of surface capacitance and diffusion controlled interaction at different scan rates are shown in Fig. 5(c). After determination of k1 and k2 values, The Fig. 5(d) represent contribution of surface capacitance (69%) and diffusion controlled interaction (31%) at peak potential (0.155 V) at scan rate of 10 mV s−1.
According to Trassati, the total specific capacitance is the sum of inner and outer surface capacitance of the electrode and it can be expressed as.
| Ctotal = Cin + Cout (F g−1) | (12) |
The specific capacitance contributions from inner and outer surface of the electrode also depend upon the scan rate.27 As shown in Fig. 5(e), the y-intercept of the linear fit (1/q vs. υ1/2 plot at υ = 0) shows the amount of total charge stored at the electrode. As shown in Fig. 5(f), the y-intercept of the linear q vs. υ−1/2 plot at υ = ∞ represents corresponds to the amount of charge stored at the outer surface of the electrode. After applying Trassati plot outcomes, it can be concluded that the total capacitance value Ctotal was found to be 1636 F g−1, Cin was found to be 1233 F g−1 (75% of total capacitance value) and Cout was found to be 403 F g−1 (25% of total capacitance value).
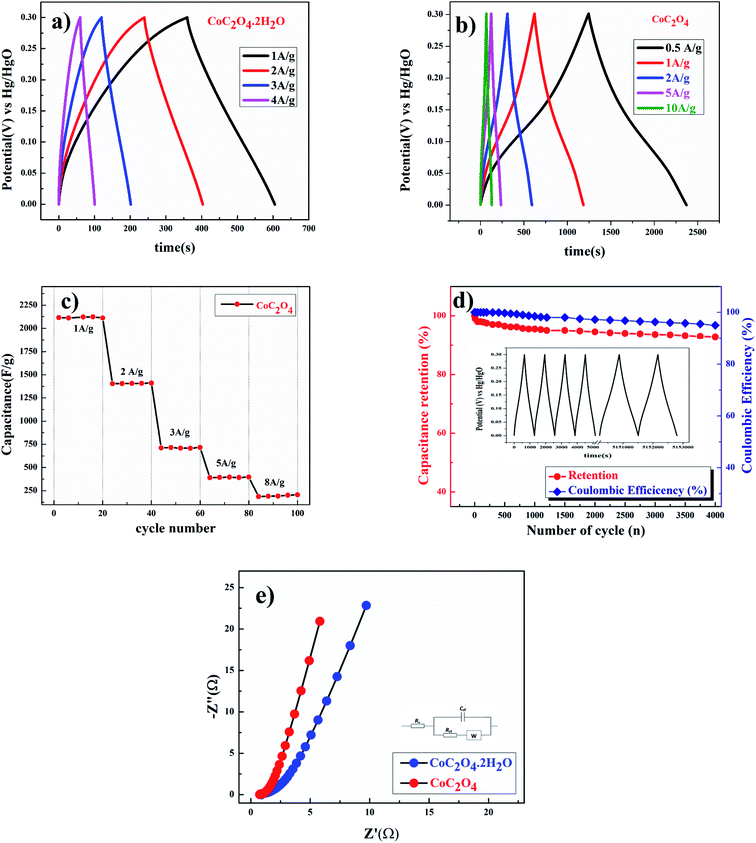
Galvanostatic charge discharge experiments were performed for more accurate capacitance measurements of CoC2O4·2H2O and porous CoC2O4 nanorod electrodes. From the charge–discharge curve the specific capacitance of electrode can be calculated as:22
 | (13) |
 of electrode was found ∼97% after 2200 cycle of charge/discharge that reveals the superior stability of the porous CoC2O4 nanorod electrodes. In addition to electrochemical stability test, we also performed AC EIS measurements as shown in Nyquist plot at OCP in Fig. 6(e) in frequency range (1 MHz to 0.1 Hz). The specific impedance contribution is mainly attributed to the impedance distributions over electric series resistance (Rs), charge transfer resistance (Rct) and Warburg impedance (Rw). At higher frequency, for CoC2O4·2H2O and porous CoC2O4 nanorod electrodes, the intercept in the EIS spectra on the real axis was found at 1 Ω and 0.5 Ω respectively indicating very small internal resistance. The small semicircle in the high frequency region also shows the fast charge transport between electrode and electrolyte. Lower frequency data represent the Warburg diffusion resistance and for porous CoC2O4 electrode samples, the straight line in the low frequency region is close to 90° angle (very close to −Z′′(Ω) axis) from horizontal line represents the characteristic of pseudo capacitance behaviour. This also represents fast OH– ion diffusion in the porous structure.28
Further studies were conducted to understand the effects of anions present in the electrolyte. Fig. 7(a) show the completely non-rectangular shape CV curve for porous CoC2O4 nanorods as an electrode in KOH and Na2SO4 electrolyte. The redox peak was dominant in KOH compared to Na2SO4, which was due to the size difference of hydration radii of sulphate ions (3.79 Å) compared to hydroxyl ions (3 Å). Larger hydration sphere of SO42− causes decrement of ions entering into the pores, causing thiner electric double layer formation. In addition, KOH exhibits higher the current response in CV curve also due to its higher molar conductivity OH− ion (198 cm2 Ω mol−1) compared to SO42− (79.8 cm2 Ω mol−1) in Na2SO4.29 As specific capacitance function of scan rate has been estimated using eqn (1), where in 2 M KOH exhibits higher specific capacitance of 1236 F g−1 observed compare to 366 F g−1 specific capacitance at 10 mV s−1 in 0.5 M Na2SO4 electrolyte. GCD experiment were performed for determining the quantitative aspect of capacitance assessment in KOH and Na2SO4 using eqn (2). Fig. 7(b) GCD curve in different electrolyte, in 2 M KOH electrolyte. Specific capacitance was found to be 2116 F g−1 and in to 0.5 M Na2SO4 electrolyte, it was found to be 973 F g−1 at 1 A g−1. This study confirm the suitability of aqueous KOH electrolyte for the high performance of the electrode as smaller size of OH− ion result easily diffusion to result superior performances.
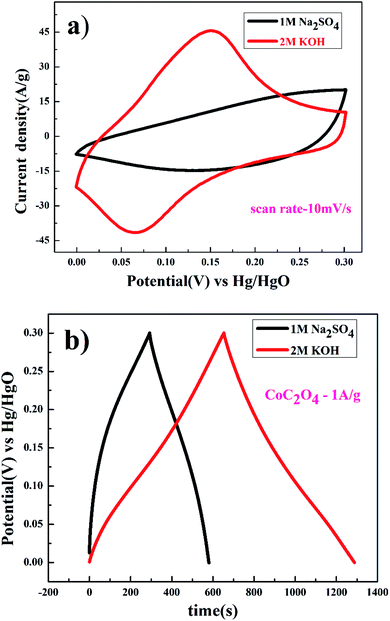 | ||
| Fig. 7 (a) CV and (b) charge discharge of porous anhydrous CoC2O4 nanorods at 10 mV s−1 in 2 M KOH and 0.5 M Na2SO4. | ||
Two electrode test
To understand the real charge storage behaviour of porous anhydrous CoC2O4, two electrode measurements has been conducted in 2 M KOH electrolyte using AC (activated carbon) as counter electrode. To determine the maximum specific capacitance during full test, storage capacity of positive and negative electrode need to be balanced as per the following equation:
 | (14) |
For balancing the charge storage capacity of the cell, mass ratio (m+/m−) of positive and negative electrode materials were measured using following equation:
 | (15) |
m+, m−, C+, C−, ΔE+, ΔE− are mass, specific capacitance and potential window of positive and negative electrode estimated by three electrode measurement.30,31
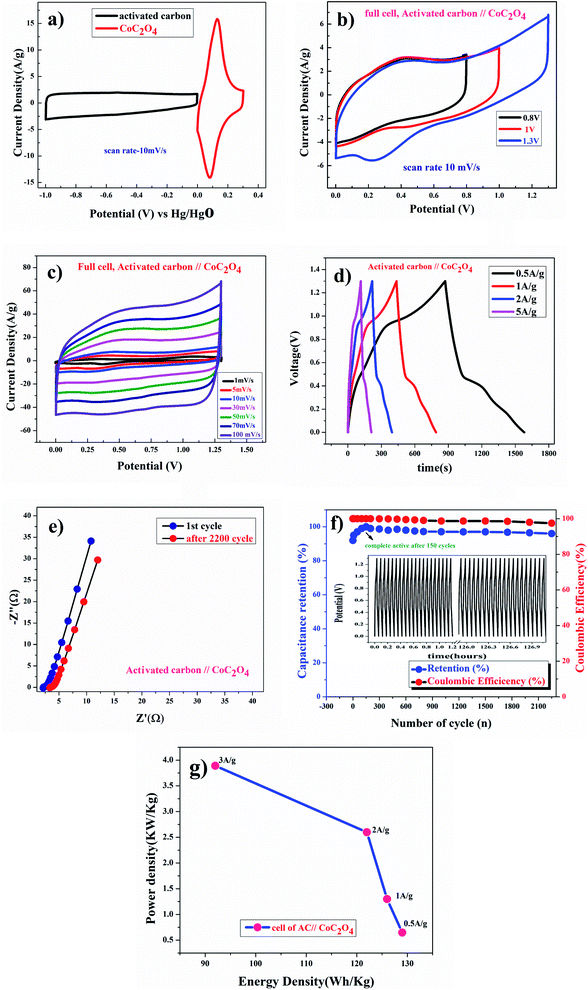
Fig. 8(a) shows CV curve at 10 mV s−1 scan rate using AC (activated carbon) as negative electrode and porous anhydrous CoC2O4 positive electrode. Calculated mass ratio  was kept 1
![[thin space (1/6-em)]](https://www.rsc.org/images/entities/char_2009.gif) :
:![[thin space (1/6-em)]](https://www.rsc.org/images/entities/char_2009.gif) 3.54 for the asymmetric cell, weight of the active material was 4.54 mg (excluding the weight of Activated Carbon and PVDF). Fig. 8(b)) demonstrate the CV curve of porous CoC2O4//AC in two electrode ASCs (Asymmetry Supercapacitors) mode at 10 mV s−1 in different potential windows. Fig. 8c demonstrate the CV curve with different scan rates ranging from 1 mV s−1 to 100 mV s−1.
3.54 for the asymmetric cell, weight of the active material was 4.54 mg (excluding the weight of Activated Carbon and PVDF). Fig. 8(b)) demonstrate the CV curve of porous CoC2O4//AC in two electrode ASCs (Asymmetry Supercapacitors) mode at 10 mV s−1 in different potential windows. Fig. 8c demonstrate the CV curve with different scan rates ranging from 1 mV s−1 to 100 mV s−1.
Fig. 8(d) subsequently, shows GCD studies conducted for measuring the actual capacitance of the electrode using eqn (11). The capacitance values were found to be 551 F g−1, 538 F g−1, 520 F g−1, and 396 F g−1 at current densities 0.5 A g−1, 1 A g−1, 2 A g−1, and 3 A g−1 respectively. In Fig. 8(e), EIS plot (Nyquist) plot was shown in the frequency range 1 MHz to 0.1 Hz at OCP (108 mV) shows higher charge transfer in full ASC (anhydrouCoC2O4//AC) cell. Fig. 8(f) show Coulombic efficiency plot of two electrode cell with capacity retention close 97% of its initial value after 1700cycles. Specific energy and specific power of asymmetric capacitors were calculated using following equations:
 | (16) |
 | (17) |
Fig. 8(g) shows plot of specific energy (E) vs. specific power (P) at different constant current rates. Resultant values are highest specific energy was found to be W h kg−1 at 0.5 A g−1 current density with specific power of ∼647 W kg−1. Maximum specific power of ∼3890 W kg−1 was obtained when specific energy reduced to ∼92 W h kg−1 at 3 A g−1 of current density. A comparison of capacitance of different Cobalt oxalate based electrodes is given in Table 1.33–36
| Material | Morphology | Capacitance (F g−1) | Operating potential (V) | Electrolyte | Reference |
|---|---|---|---|---|---|
| CoC2O4 | Thin sheet | 1269 at 6 A g−1 | 0 to 0.5 | 6 M KOH | 33 |
| Co0.5Mn0.4Ni0.1C2O4*nH2O | Micro polyhedrons | 990 at 0.6 A g−1 | 0 to 0.4 | 3 M KOH | 13 |
| CoC2O4·2H2O | 2D porous thin sheets | 1.631 F cm2 at 1.20 mA cm−1 | 0 to 0.4 | 6 M KOH | 21b |
| NiC2O4 | 2D thin sheet | 2835 F g−1 at | 0 to 0.4 | 6 M KOH | 34 |
| Ni0.55Co0.45C2O4 | Micro-cuboid | 562 C g−1 1A g−1 | 0 to 0.6 | 6 M KOH | 35 |
| MnC2O4/GO | Olive-like | 122 F g−1 at 0.5 A g−1 | −0.1 to 0.55 | 6 M KOH | 36 |
| CoC2O4·2H2O | Flakes type | 840 F g−1 at 1 A g−1 | 0 to 0.3 | 2 M KOH | Present work |
| Anhydrous CoC2O4 | Nanorods | 2116 F g−1 at 1 A g−1 and 1636 F g−1 at 1 mV s−1 | 0 to 0.3 | 2 M KOH | Present work |
| Anhydrous CoC2O4 | Nanorods | 973 F g−1 at 1 A g−1 | 0 to 0.3 | 0.5 M Na2SO4 | Present work |
Conclusions
In summary, porous anhydrous CoC2O4 nanorods were successfully synthesized using two-step process, first CoC2O4·2H2O was synthesised by co-precipitation method in aqueous medium followed by heating the precipitate at 210 °C to produce porous CoC2O4 nanorods. Porous CoC2O4 nanorods showed pseudocapacitive energy/charge storage behaviour with specific capacitance of the materials reaching as high as 2116 F g−1 at current density of 1 A g−1 with excellent cyclic stability. Predominant intercalative mechanism seems to operative behind high charge storage as intercalative (inner) and surface (outer) charges stored by porous anhydrous CoC2O4 were close to high 75% and 25% respectively. Porous anhydrous CoC2O4//AC full cell resulted maximum specific energ 129 W h kg−1 and specific power of ∼647 W kg−1 at 0.5 A g−1 current density in the voltage window of 1.3 V in 2 M KOH electrolyte. These results make porous anhydrous CoC2O4 nanorods as a potential pseudo-capacitive electrode for large scale energy storage application in ASC mode.Author statement
Dr Preetam Singh conceptualized and supervised the work. Rakesh Mondal and Neeraj Kumar Mishra have completed the experimental work. Neeraj Kumar Mishra have organized the manuscript completed the study.Conflicts of interest
The authors declare that they have no known competing financial interests or personal relationships that could have appeared to influence the work reported in this paper.Acknowledgements
Authors thank Department of Ceramic Engineering, IIT (BHU) for its facility and support. Dr Preetam Singh thanks Science and Engineering Research Board (SERB) India for the financial support (Project no.: EMR/2016/006840).References
- V. Augustyn, P. Simon and B. Dunn, Energy Environ. Sci., 2014, 7, 1597–1614 RSC.
- T. Brezesinski, J. Wang, S. H. Tolbert and B. Dunn, Nat. Mater., 2010, 9, 146–151 CrossRef CAS PubMed.
- A. J. Brad, G. Inzelt and F. Scholz, Electrochemical Dictionary, Springer Science & Business Media, 2008, ISBN, 978-3-642-29551-5 Search PubMed.
- B. E Conway, J. Electrochem. Soc., 1991, 138(6), 1539–1548 CrossRef.
- B. E. Conway and E. Gileadi, Trans. Faraday Soc., 1962, 58, 2493–2509 RSC.
- B. E. Conway and H. Angerstein-Kozlowska, Acc. Chem. Res., 1981, 14(2), 49–56 CrossRef CAS.
- S. Trasatti and G. Buzzanca, J. Electroanal. Chem. Interfacial Electrochem., 1971, 29(2), A1–A5 CrossRef.
- H. Y. Lee and J. B. Goodenough, J. Solid State Chem., 1999, 144, 220–223 CrossRef CAS.
- Y. Gogotsi and R. M. Penner, ACS Nano, 2018, 12, 2081–2083 CrossRef CAS PubMed.
- C. Costentin, T. R. Porter and J. M. Savéant, ACS Appl. Mater. Interfaces, 2017, 9(10), 8649–8658 CrossRef CAS PubMed.
- D. P. Dubal, O. Ayyad, V. Ruiz and P. Gómez-Romero, Chem. Soc. Rev., 2015, 44(7), 1777–1790 RSC.
- D. P. Dubal, O. Ayyad, V. Ruiz and P. Gómez-Romero, Chem. Soc. Rev., 2015, 44, 1777–1790 RSC.
- Y. Z. Zhang, J. Zhao, J. Xia, L. Wang, W. Y. Lai, H. Pang and W. Huang, Sci. Rep., 2015, 5, 8536 CrossRef CAS PubMed.
- M. C. López, J. L. Tirado and C. Pérez Vicente, J. Power Sources, 2013, 227, 65–71 CrossRef.
- Y. Zhang, Z. Lu, M. Guo, Z. Bai and B. Tang, JOM, 2016, 68(11), 2952–2957 CrossRef CAS.
- L. Ren, P. Wang, Y. Han, C. Hu and B. Wei, Chem. Phys. Lett., 2009, 476, 78–83 CrossRef CAS.
- F. Li, Z. Liu, J. Shen, X. Xu, L. Zeng, B. Zhang, H. Zhu, Q. Liu, J. Liu and M. Zhu, J. Mater. Chem. A, 2021, 9, 2830–2839 RSC.
- J. Xu, L. He, H. Liu, T. Han, Y. Wang, C. Zhang and Y. Zhang, Electrochim. Acta, 2015, 170, 85–91 CrossRef CAS.
- L. An, Q. Ren, W. Li, K. Xu, Y. Cao, T. Ji, R. Zou, Z. Chena and J. Hu, J. Mater. Chem. A, 2015, 3(21), 11503–11510 RSC.
- Y. Wei, X. Ren, H. Ma, X. Sun, Y. Zhang, X. Kuang, T. Yan, H. Ju, D. Wu and Q. Wei, Chem. Commun., 2018, 54, 1533–1536 RSC.
- (a) B. Evanko, S. W. Boettcher, S. Joon Yoo and G. D. Stucky, ACS Energy Lett., 2017, 2, 2581–2590 CrossRef CAS; (b) T. Pu, J. Li, Y. Jiang, B. Huang, W. Wang, C. Zhao, L. Xie and L. Chen, Dalton Trans., 2018, 47, 9241–9249 RSC.
- R. Sahoo, D. T. Pham, T. H. Lee, T. H. T. Luu, J. Seok and Y. H. Lee, ACS Nano, 2018, 12, 8494–8505 CrossRef CAS PubMed.
- I. Hanzu, T. Djenizian and P. Knauth, J. Phys. Chem. C, 2011, 115, 5989–5996 CrossRef CAS.
- V. Augustyn, J. Come, M. A. Lowe, J. W. Kim, P. L. Taberna, S. H. Tolbert, H. D. Abruña, P. Simon and B. Dunn, Nat. Mater., 2013, 12, 518–522 CrossRef CAS PubMed.
- M. Park, X. Zhang, M. Chung, G. B. Less and A. M. Sastry, J. Power Sources, 2010, 195, 7904–7929 CrossRef CAS.
- H. S. Kim, J. B. Cook, H. Lin, J. S. Ko, S. H. Tolbert, V. Ozolins and B. Dunn, Nat. Mater., 2017, 16, 454–460 CrossRef CAS PubMed.
- (a) W. Ren, X. Chen and C. Zhao, Adv. Energy Mater., 2018, 8(24), 1–8 CAS; (b) C. Long, L. Miao, D. Zhu, H. Duan, Y. Lv, L. Li, M. Liu and L. Gan, ACS Appl. Energy Mater., 2021, 4, 5727–5737 CrossRef CAS; (c) Z. Song, L. Miao, L. Li, D. Zhu, L. Gan and M. Liu, Carbon, 2021, 180, 135–145 CrossRef CAS.
- L. Basirico and G. Lanzara, Nanotechnology, 2012, 23, 305401 CrossRef CAS PubMed.
- B. Pal, S. Yang, S. Ramesh, V. Thangadurai and R. Jose, Nanoscale Adv., 2019, 1(10), 3807–3835 RSC.
- Y. S. Mathis, N. Kurra, X. Wang, D. Pinto, P. Simon and Y. Gogotsi, Adv. Energy Mater., 2019, 9(1–13), 1902007 CrossRef.
- K. Subramani, N. Sudhan, R. Divya and M. Sathish, RSC Adv., 2017, 7, 6648–6659 RSC.
- N. Hu, W. H. Gong, L. Huang and P. K. She, J. Mater. Chem. A, 2019, 7, 1273–1280 RSC.
- G. Cheng, C. Si, J. Zhang, Y. Wang, W. Yang, C. Dong and Z. Zhang, J. Power Sources, 2016, 312, 184–191 CrossRef CAS.
- C. Zhao, Y. Jiang, S. Liang, F. Gao, L. Xie and L. Chen, CrystEngComm, 2020, 22, 2953–2963 RSC.
- L. Wang, R. Zhang, Y. Jiang, H. Tian, Y. Tan, K. Zhu, Z. Yu and W. Li, Nanoscale, 2019, 11, 13894–13902 RSC.
- T. Liu, G. Shao, M. Ji and Z. Ma, Ionics, 2014, 20, 145–149 CrossRef CAS.
| This journal is © The Royal Society of Chemistry 2021 |

