 Open Access Article
Creative Commons Attribution 3.0 Unported Licence
Fabrication, characterization and high photocatalytic activity of Ag–ZnO heterojunctions under UV-visible light
Xiaodong Zhu†
 ,
Juan Wang†,
Daixiong Yang,
Jiawei Liu,
Lili He,
Mao Tang,
Wei Feng
 * and
Xiaoqiang Wu*
College of Mechanical Engineering, Chengdu University, Chengdu 610106, China. E-mail: fengwei233@126.com; wuxiaoqiang@cdu.edu.cn
First published on 10th August 2021
Abstract
Pure ZnO and Ag–ZnO nanocomposites were fabricated via a sol–gel route, and the obtained photocatalysts were characterized by XRD, SEM, TEM, BET, XPS, PL and DRS. The results showed that Ag0 nanoparticles deposit on the ZnO surface and Ag modification has negligible impact on the crystal structure, surface hydroxyl group content and surface area of ZnO. However, the recombination of photogenerated electrons and holes was suppressed effectively by Ag loading. The photocatalytic activity was investigated by evaluating the degradation of MB under xenon lamp irradiation as the UV-visible light source, and the results show that the photocatalytic activity of ZnO significantly improved after Ag modification. Ag–ZnO photocatalysts exhibit higher photocatalytic activity than commercial photocatalyst P25. The degradation degree of MB for 1%Ag–ZnO was 97.1% after 15 min. ˙O2− radicals are the main active species responsible for the photodegradation process, and Ag–ZnO heterojunctions generate more ˙O2− radicals, which is the primary reason for the improved photocatalytic performance.
1 Introduction
Metal oxide semiconductors have been regarded as a kind of promising materials to deal with pollution due to their photocatalytic activity. Among them, ZnO, an important semiconductor material, has attracted an extensive range of research attention because of its low cost, excellent electrochemical stability and high electron mobility.1–4 However, there are also some defects in ZnO. It is usually active in the presence of UV light and the photoexcited electrons and holes recombine easily, which results in a decrease of its photocatalytic property.5–10 Therefore, advancing the photocatalytic activity of ZnO has become an active research topic at present. ZnO modified by noble metal loading11–14 and ion doping15–18 has attracted considerable attention and has been widely studied. The effect of ion doping on the photocatalytic performance of ZnO is still controversial. Liu et al.15 found that Fe doping can modify the ZnO nanofiber morphology and reduce the optical bandgap to improve its photocatalytic activity. However, ion doping does not necessarily improve the photocatalytic performance of ZnO, and it has been reported that Fe–doped ZnO and Cu-doped ZnO show less photocatalytic activity than pure ZnO.17,18For noble metal loading, the photocatalytic activity of ZnO can always be enhanced by loading with Au,19 Pt20 and Ag.21 Unexpectedly, there are controversies involved in the explanation of noble metal deposition for improving the photocatalytic performance of ZnO. Muñoz-Fernandez et al.20 synthesized Ag–ZnO nanocomposites by a solvothermal method and are convinced that the enhancement of photocatalytic activity lies in the increased surface area and less recombination rate of photogenerated pairs compared to pure ZnO. The Ag–ZnO hybrid with high photocatalytic activity was prepared by Dong et al. and they showed that the high activity of Ag–ZnO was due to a high degree of crystallinity and a higher ratio of surface hydroxyl oxygen.22
In the sol–gel method, it is easy to add some impurity elements evenly and quantitatively to achieve uniform doping at the molecular level, thus obtaining photocatalysts with high photocatalytic activity. On the other hand, although several studies on Ag–ZnO composites have been reported, the photocatalytic activity of each study is quite different and there are numerous controversies about the mechanism of Ag modification to improve the photocatalytic activity of ZnO. Therefore, in the present study, different concentrations of Ag modified ZnO were prepared by the sol–gel method, focusing on the effects of Ag modification on the crystal structure, surface morphology, elemental composition and valence state, optical properties and photocatalytic activity of ZnO. Ag–ZnO heterojunction photocatalytic materials with activity higher than P25 were obtained, and the mechanism of Ag modification on improving the photocatalytic activity was analyzed.
2 Experimental
2.1 Fabrication of pure and Ag–ZnO nanocomposites
Pure and Ag–ZnO nanocomposites were fabricated as follows: diethanolamine (6 mL), Zn(CH3COO)2·H2O (13.2 g) and certain amounts of AgNO3 were dissolved in a 160 mL ethanol/water system (the volume ratio is 5![[thin space (1/6-em)]](https://www.rsc.org/images/entities/char_2009.gif) :
:![[thin space (1/6-em)]](https://www.rsc.org/images/entities/char_2009.gif) 3). A ZnO sol could be obtained after stirring at 70 °C about 120 min and aging for 2 h. The resulting mixture solution was dried at 90 °C and then heated at 550 °C for 2 h. Finally, 1%, 3% and 5% (Ag/Zn molar ratio) Ag-loaded ZnO nanocomposites can be obtained after full grinding. The 1% Ag-loaded ZnO is labeled as 1%Ag–ZnO, same as 3%Ag–ZnO and 5%Ag–ZnO. Pure ZnO was prepared for comparison by the same procedure without adding AgNO3.
3). A ZnO sol could be obtained after stirring at 70 °C about 120 min and aging for 2 h. The resulting mixture solution was dried at 90 °C and then heated at 550 °C for 2 h. Finally, 1%, 3% and 5% (Ag/Zn molar ratio) Ag-loaded ZnO nanocomposites can be obtained after full grinding. The 1% Ag-loaded ZnO is labeled as 1%Ag–ZnO, same as 3%Ag–ZnO and 5%Ag–ZnO. Pure ZnO was prepared for comparison by the same procedure without adding AgNO3.
2.2 Characterization
X-ray diffraction (XRD) was used to examine the crystal structure of samples using an X-ray diffractometer (DX-2700). The specific surface areas were determined by nitrogen adsorption–desorption isotherms using the Brunauer–Emmett–Teller (BET) theory. X-ray photoelectron spectra (XPS) test by a spectrometer (XSAM800) was employed to examine the chemical state. A field-emission scanning electron microscope (SEM, FEI-Inspect F50) and a transmission electron microscope (TEM and HRTEM, FEI-Tecnai G2 F20) were used to observe the surface morphology. The recombination rate of photoinduced electrons and holes was investigated by photoluminescence (PL) spectra using a luminescence spectrometer (F-4600). UV-vis absorption spectra were recorded on a spectrophotometer (UV-3600).2.3 Photocatalytic test
The photocatalytic property of pure and Ag–ZnO was assessed by examining the photocatalytic degradation of MB. The experiments were conducted as follows: MB solution (100 mL, 10 mg L−1) and 100 mg sample were added into a beaker. To establish the adsorption–desorption equilibrium between MB molecules and photocatalysts, the obtained mixture was stirred for 30 min in dark. A 250 W xenon lamp was employed as the UV-visible light source. About 5 mL sample was removed at a given time interval and centrifuged to completely remove the suspended photocatalyst particles. Then, the MB absorbance at 664 nm was measured via a UV-Visible spectrophotometer. The degradation degree was calculated by the equation: , where A0 and At are the initial absorbance and absorbance at time “t”, respectively.
3 Results and discussion
3.1 Crystal structure
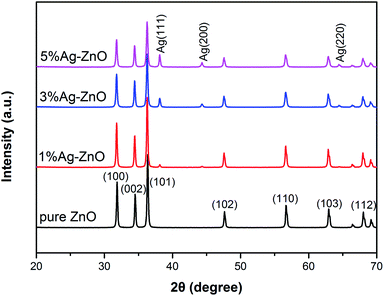
Fig. 1 shows the XRD patterns of pure ZnO and Ag–ZnO nanocomposites. All peaks are strong and sharp, which indicates that both pure ZnO and Ag–ZnO are highly crystalline. The pure ZnO pattern displays diffraction peaks at 31.8°, 34.4°, 36.3°, 47.6°, 56.6°, 62.9° and 68.0°, which are indexed to the crystal planes of (100), (002), (101), (102), (110), (103) and (112) of hexagonal wurtzite structures, respectively.1,13 The shape and position of peaks in Ag–ZnO patterns are similar to those of pure ZnO, indicating that Ag–ZnO nanocomposites are also hexagonal wurtzite structures. Moreover, the peaks at 38.1°, 44.3°, 64.5° in Ag–ZnO patterns are assigned to the (111), (200) and (220) planes of the cubic Ag phase,20,23 implying the existence of metallic Ag in Ag–ZnO nanocomposites. The intensity of these peaks gradually increases with the increase in the Ag addition content, indicating that more metallic Ag forms in the matrix. On the other hand, as the Ag concentration increases, the peak intensity of ZnO decreases, suggesting that the crystallinity and grain size decrease in Ag–ZnO samples.7,19 The grain sizes (D) of pure ZnO, 1%, 3% and 5%Ag–ZnO nanocomposites were 38.8 nm, 38.6 nm, 35.5 nm and 35.2 nm, respectively, which were calculated by Scherrer's formula D = 0.89λ/β![[thin space (1/6-em)]](https://www.rsc.org/images/entities/char_2009.gif) cos
cos![[thin space (1/6-em)]](https://www.rsc.org/images/entities/char_2009.gif) θ.5,17 The grain size is slightly reduced by Ag loading, which can be attributed to the fact that Ag particles exist on the ZnO surface, blocking the migration and diffusion of ZnO.9
θ.5,17 The grain size is slightly reduced by Ag loading, which can be attributed to the fact that Ag particles exist on the ZnO surface, blocking the migration and diffusion of ZnO.9
3.2 Morphology and BET surface area
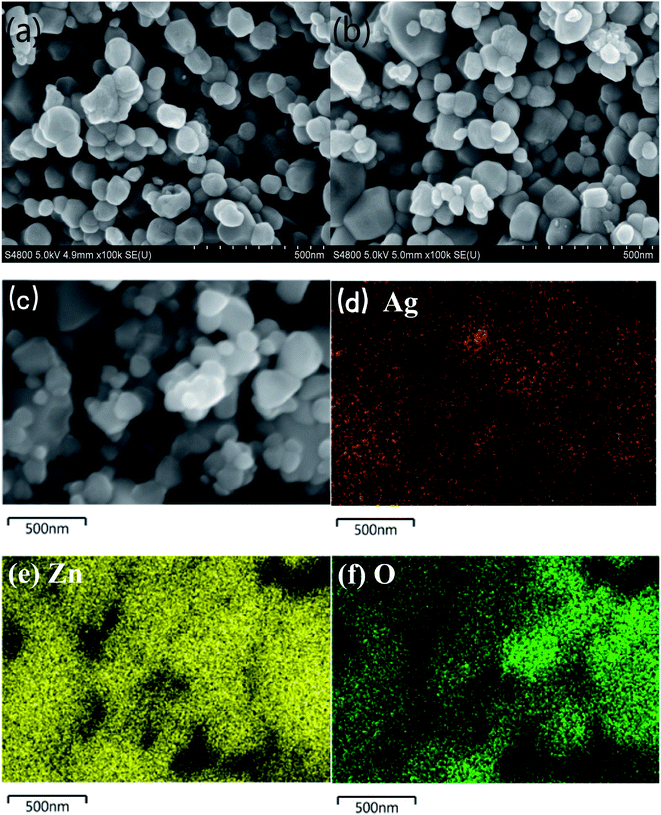
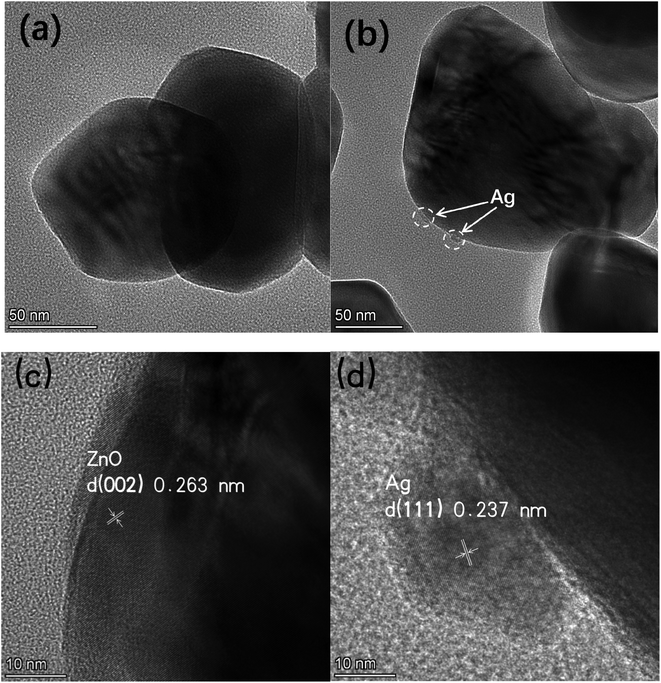
Fig. 2 shows SEM images of pure ZnO (a) and 1%Ag–ZnO (b) nanocomposites. It was observed that the particles in pure ZnO represent spherical-like shape with diameter in the range of 40 nm to 100 nm. The particles in 1%Ag–ZnO show a similar spherical-like morphology. The EDS mapping (Fig. 2(c)–(f)) of 1%Ag–ZnO reveals that Zn, O and Ag elements exist and were uniformly dispersed in the matrix.The TEM images of pure ZnO (a) and 1%Ag ZnO (b) are displayed in Fig. 3. It can be seen that the particle sizes in pure ZnO were 40–100 nm approximately, which is in line with the SEM image. In the 1%Ag–ZnO sample, Ag nanoparticles with the size of 5–10 nm can be observed to be deposited on the surface of ZnO. Fig. 3(c) and (d) display the HRTEM images of pure ZnO and 1%Ag–ZnO, respectively. The lattice distance in Fig. 3(c) is 0.263 nm, which corresponds to the (002) plane of hexagonal ZnO.22,24 It is observed in Fig. 3(d) that a particle deposited on the matrix and the marked lattice distance is 0.237 nm, ascribing to the (111) plane of metallic silver, which suggests that Ag particles is absorbed on the surface of ZnO.25,26 The TEM results are in line with the XRD and XPS results, proving that the Ag element exists as metallic silver.
It is well known that the specific surface area is a key factor to study the photocatalytic property of ZnO. However, the impact of Ag loading on the specific surface area of ZnO is disputed. Numerous studies reveal that the specific surface area of ZnO increases after the addition of Ag.27–29 On the contrary, Ag-modified ZnO exhibits less specific surface area compared to the pure ZnO in Liang's30 study. Moreover, Zhu et al.31 found that the specific surface area is almost unchanged after the Ag loading. The different results of specific surface area may be attributed to numerous syntheses methods and processes. In the present study, the BET surface areas of pure ZnO and 1%Ag–ZnO obtained were 5.7 m2 g−1 and 5.8 m2 g−1, respectively. SEM and TEM images show that the morphology of Ag–ZnO does not change significantly compared to that of pure ZnO. Accordingly, the specific surface area of ZnO was not influenced by Ag loading, which is in agreement with literature.31
3.3 Elements and chemical state
The full scan spectra of pure ZnO and 1%Ag–ZnO (Fig. 4(a)) show the signals from Zn, O, C and Zn, O, C, Ag elements, respectively. Among them, the presence of C element was probably due to the oil pollution from the instrument itself. Fig. 4(b) shows the high-resolution spectra of Zn 2p. The peaks of 1%Ag–ZnO are located at 1021.2 eV and 1044.3 eV, which are ascribed to Zn 2p3/2 and Zn 2p1/2, respectively, manifesting that Zn element exists in the Zn2+ chemical state in 1%Ag–ZnO.24,30 Both the peaks of Ag–ZnO shift to a lower binding energy compared to those of pure ZnO (1021.5 eV for Zn 2p3/2 and 1044.7 eV for Zn 2p1/2), which can be attributed to the electron transfer between ZnO and Ag.31 The Ag 3d spectrum of 1%Ag–ZnO (Fig. 4(c)) shows two peaks centered at 367.2 eV and 373.2 eV. The energy spacing between two peaks is 6.0 eV, indicating the presence of metallic Ag,23,31 which is consistent with the results of XRD analysis. The O 1s spectrum of pure ZnO (Fig. 4(d)) was decomposed into three peaks at 530.2 eV, 531.7 eV and 532.9 eV, which originate from the crystal lattice oxygen in ZnO, surface hydroxyl groups and chemisorbed oxygen,32,33 respectively. Furthermore, the O 1s spectrum of 1%Ag–ZnO is decomposed into two peaks at 530.2 eV and 532.0 eV, which are attributed to the lattice oxygen and surface hydroxyl groups, respectively.1 The surface hydroxyl groups content in a semiconductor increases after modification, which is favorable to the photocatalytic process.34–36 However, in our study, the amounts of surface hydroxyl groups of pure ZnO and 1%Ag–ZnO were calculated to be 27.0% and 26.3%, respectively, implying that Ag loading did not improve the content of surface hydroxyl groups.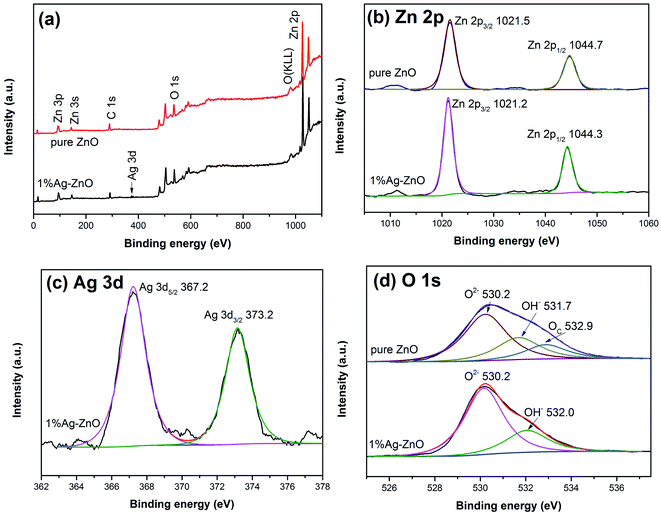 | ||
| Fig. 4 XPS spectra of pure ZnO and 1%Ag–ZnO (a) XPS full spectra of samples, (b) Zn 2p spectra, (c) Ag 3d spectrum, (d) O 1s spectra. | ||
3.4 Optical property
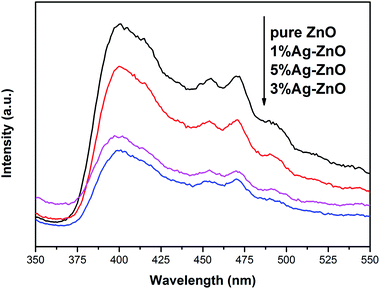
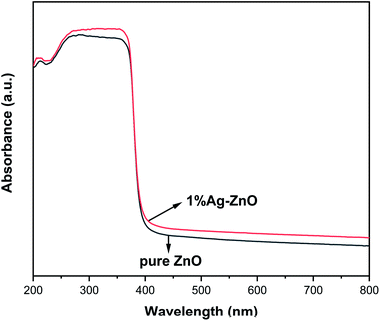
Fig. 5 exhibits the PL spectra of pure ZnO and Ag–ZnO. The peak around 400 nm in pure ZnO can be ascribed to free excitonic emission.9,37 Several peaks at 450–500 nm are attributed to the transition between the different defect states.9,24,37 All the Ag–ZnO samples show lower peak intensity than pure ZnO, implying that the recombination rate of photoinduced pairs decreases via Ag modification, which is in favor of the photocatalytic activity improvement.38 The peak intensity of Ag–ZnO samples first decreases and then increases with the increase in the Ag content, which indicates that there is an optimum concentration for inhibiting the recombination of photoinduced electrons and holes. Some studies have shown that high doping concentration will form new recombination centers, which is not conducive to the separation of photoinduced electrons and holes.9,19,28,30 On the contrary, it has been reported that in a certain concentration range, the more doping, the more conducive to the separation of photoinduced pairs.7,39 In the present study, 3%Ag–ZnO exhibited the lowest peak intensity and excess Ag addition is unfavorable to charge separation.Fig. 6 exhibits the UV-vis absorption spectra of pure ZnO and 1%Ag–ZnO. Both the samples have strong absorption in the UV region. After Ag modification, the absorption edge of ZnO does not show a clear red-shift, indicating that Ag modification has little effect on the band gap width of ZnO. It is worth noting that the absorption of 1%Ag–ZnO in the visible region increases slightly, which is conducive to improving the photocatalytic performance under visible light.
3.5 Photocatalytic activity
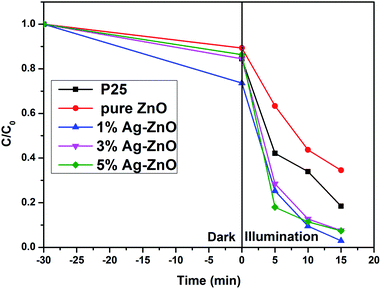
The photocatalytic property of pure ZnO and Ag–ZnO nanocomposites was evaluated via the degradation of MB. Fig. 7 provides the degradation degrees of MB for pure ZnO and Ag–ZnO samples. Commercial P25 was employed for comparison, and its degradation degree was 81.5% after 15 min. The degradation degree of pure ZnO was 65.5%. Remarkably, Ag–ZnO photocatalysts showed a higher photocatalytic activity than commercial P25. The degradation degrees of 1%, 3% and 5%Ag–ZnO were 97.1%, 92.5% and 92.6%, respectively. 1%Ag–ZnO exhibited the highest photocatalytic activity, suggesting that an appropriate amount of Ag modification improves the photocatalytic activity significantly.The surface area and surface hydroxyl group content of the photocatalyst are important to its photocatalytic activity. More surface area is beneficial for providing active reaction spots and enhancing light absorption. Surface hydroxyl group will generate superoxide radical ions (˙OH), which can decompose MB molecules effectively.40 However, in the present study, as discussed in BET and XPS sections, it was proven that the specific surface area and surface hydroxyl group content of ZnO remained almost unchanged after Ag loading. The increased photocatalytic activity should be attributed to the suppression of the photogenerated electrons and holes by Ag loading, which is confirmed by PL spectra. Besides, the increase in the visible light absorption is also the reason for the improvement of photocatalytic activity.
3.6 Photodegradation mechanism
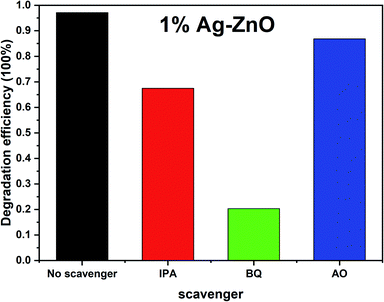
To investigate the active radicals in the photodegradation process, benzoquinone (BQ), isopropanol (IPA) and ammonium oxalate (AO) were added as scavengers to the photodegradation system, and the results are shown in Fig. 8. After adding BQ, IPA and AO, the degradation degrees of MB by 1%Ag–ZnO decreased to 20.3%, 67.4% and 86.8%, respectively. Since BQ, IPA and AO were selected to quench ˙O2−, ˙OH and h+, respectively, the results indicate that the ˙O2− radical is the predominant active species in the photodegradation process. ˙OH and h+ species are the secondary factors.As ˙O2− radical is the main active species, therefore, the nitro blue tetrazolium (NBT) experiment was conducted to verify the formation of ˙O2− species and compare the amount between pure ZnO and Ag–ZnO.41,42 Since NBT will react with ˙O2− to form purple particles, which consumes NBT in the solution, resulting in a decrease in the NBT absorbance, therefore, the NBT absorbance gradually decreasing with an increase in the irradiation time (Fig. 9(a)) testifies the formation of ˙O2− species in 1%Ag–ZnO under irradiation. Fig. 9(b) shows the NBT absorbance curves of pure ZnO and 1%Ag–ZnO at the same time. It is found that the NBT absorbance of 1%Ag–ZnO is lower than that of pure ZnO, which proves that more ˙O2− is produced by 1%Ag–ZnO than pure ZnO. Ag modification is beneficial to the separation of photogenerated electrons and holes, which is consistent with the results from PL spectra.
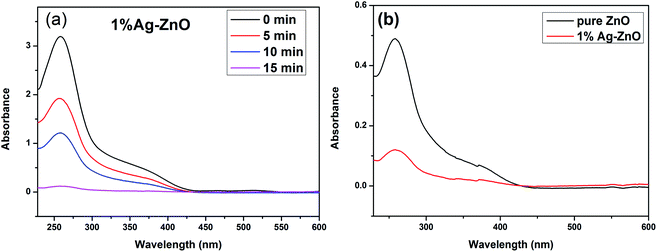 | ||
| Fig. 9 The NBT absorbance curves of 1%Ag–ZnO with increasing time (a), the comparison of pure ZnO and 1%Ag–ZnO (b). | ||
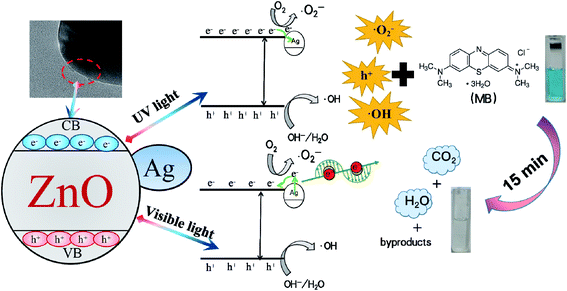
Based on the discussion above, a schematic for the photodegradation of RhB by 1%Ag–ZnO is proposed in Fig. 10. When ZnO is irradiated by a UV light source, electrons in the valence band (VB) will be excited to the conduction band (CB), leaving holes in VB simultaneously.27,43 The photogenerated electrons in CB will transfer to Ag particles as the CB energy level of ZnO is higher than the Fermi level of metallic Ag, which suppresses the recombination and prolongs the lifetime of photogenerated pairs.28,30,40 Under visible light, Ag particles are able to absorb visible light due to the effect of surface plasmon resonance and generate hot electrons. Part of them will jump to CB and react with O2 to generate ˙O2− radicals.44,45 The electrons in the 3d orbit are easily transferred from Ag particles to CB of ZnO owing to the interface effect of Ag/ZnO heterojunctions,46 which will yield more ˙O2− radicals and thus enhance the photocatalytic activity. In addition, the holes will transform into˙OH radicals. The ˙O2−, ˙OH radicals and holes will be responsible for decomposing the MB molecules effectively.47–50
Remarkably, the amount of Ag has an influence on the photocatalytic performance. The degradation degree declines slightly when the Ag/Ti molar ratio surpasses 1%. The decrease cannot be attributed to the formation of new recombination centers due to the addition of excess Ag because the PL peak intensity of 3%Ag–ZnO and 5%Ag–ZnO is still lower than that of 1%Ag–ZnO. It was confirmed that Ag particles are loaded on the ZnO surface and excess Ag particles will hinder the absorption of light,51–53 thus causing a drop in the photocatalytic activity. Table 1 lists the photocatalytic performance data reported in literature. The Ag–ZnO photocatalyst obtained in the present study possesses high photocatalytic activity.
| Method | Catalyst | Target pollutant | Light source | Maximum efficiency | Ref. |
|---|---|---|---|---|---|
| One-step growth method | Pure ZnO, 400 mg L−1 | MO (20 ppm) | High-pressure mercury lamp (360 W) | 98.3% in 100 min | 4 |
| Chemical precipitation method | Ce–ZnO, 500 mg L−1 | MO (5 mg L−1) | High-pressure mercury lamp (250 W) | 89.5% in 240 min | 7 |
| Precipitation method | Pt–ZnO, 1000 mg L−1 | RhB (20 mg L−1) | Ultra-Vitalux lamp (300 W) | 96.9% in 60 min | 13 |
| Electrospinning method | Fe–ZnO, 400 mg L−1 | MB (10 mg L−1) | Mercury lamp | 88% in 360 min | 15 |
| Microwave assisted ultrasonicated precipitation method | Sn–Cu–ZnO, 1000 mg L−1 | MB (20 ppm) | High-pressure halogen lamp (500 W) | 98.5% in 180 min | 16 |
| Three-step hydrothermal and pulsed laser ablation method | Au–ZnO, 500 mg L−1 | MB (5 × 10⁻⁵ M) | Xenon lamp (300 W) | 98% in 20 min | 19 |
| Solvothermal method | Ag–ZnO, 8.3 mg L−1 | MB (2.5 ppm) | High-pressure mercury vapor lamp (125 W) | 99% in 120 min | 20 |
| One-pot hydrothermal method | Ag–ZnO, 200 mg L−1 | RhB (1 × 10⁻⁵ M) | UV lamp (125 W) | 92% in 80 min | 24 |
| Electrospinning and hydrothermal method | C–ZnO | RhB (10 mg L−1) | High-pressure mercury lamp (50 W) | 96% in 50 min | 33 |
| Borohydride reduction method | Pd–ZnO, 500 mg L−1 | Congo red (16 mg L−1) | UV light (100 W) | 98.2% in 60 min | 54 |
| Sol–gel method | Ag–ZnO, 1000 mg L−1 | MB (10 mg L−1) | Xenon lamp (250 W) | 97.1% in 15 min | Present study |
4 Conclusions
In the present study, pure ZnO and Ag–ZnO heterojunctions were synthesized via a sol–gel pathway and the photocatalytic performances were studied. The characterization results show that Ag0 nanoparticles deposit on the surface of ZnO and Ag/ZnO heterojunctions formed in the photocatalysts. Ag/ZnO photocatalysts show higher photocatalytic activity than commercial P25. Moreover, Ag loading suppresses the recombination of photoinduced electrons and holes effectively and enhances the visible light absorbance, thereby improving the photocatalytic activity. 1%Ag–ZnO exhibits the best photocatalytic performance, with the degradation degree of 97.1% after 15 min. Photocatalytic mechanism experiment results indicate that the main active species in the photodegradation process is the ˙O2− radical.Conflicts of interest
The authors declare that they have no conflict of interest.Acknowledgements
This work was supported by the Training Program for Innovation of Chengdu University (S202011079053, CDU-CX-2021527), the Chengdu Technology Innovation Research and Development Project of Chengdu City (Grant No. 2019-YFYF-00013-SN).References
- F. X. Wang, L. Liang, L. Shi, M. S. Liu and J. M. Sun, CO2-assisted synthesis of mesoporous carbon/C-doped ZnO composites for enhanced photocatalytic performance under visible light, Dalton Trans., 2014, 43, 16441–16449 RSC.
- K. H. Park, G. D. Han, B. J. Kim, E. H. Kang, J. S. Park, J. H. Shim and H. D. Park, Effects of atomic layer deposition conditions on the formation of thin ZnO films and their photocatalytic characteristics, Ceram. Int., 2019, 45, 18823–18830 CrossRef CAS.
- B. Poornaprakash, U. Chalapathi, M. Chandra Sekhar, V. Rajendar, S. V. Prabhakar Vattikuti, M. Siva Pratap Reddy, Y. Suh and S. H. Park, Effect of Eu3+ on the morphology, structural, optical, magnetic, and photocatalytic properties of ZnO nanoparticles, Superlattices Microstruct., 2018, 123, 154–163 CrossRef CAS.
- C. C. Hu, L. Lu, Y. J. Zhu, R. Li and Y. J. Xing, Morphological controlled preparation and photocatalytic activity of zinc oxide, Mater. Chem. Phys., 2018, 217, 182–191 CrossRef CAS.
- A. Khataee, R. D. C. Soltani, Y. Hanifehpour, M. Safarpour, H. G. Ranjbar and S. W. Joo, Synthesis and characterization of dysprosium-doped ZnO nanoparticles for photocatalysis of a textile dye under visible light irradiation, Ind. Eng. Chem. Res., 2014, 53, 1924–1932 CrossRef CAS.
- R. Beura, R. Pachaiappan and P. Thangadurai, A detailed study on Sn4+ doped ZnO for enhanced photocatalytic degradation, Appl. Surf. Sci., 2018, 433, 887–898 CrossRef CAS.
- J. H. Lang, J. Y. Wang, Q. Zhang, X. Y. Li, Q. Han, M. B. Wei, Y. R. Sui, D. D. Wang and J. H. Yang, Chemical precipitation synthesis and significant enhancement in photocatalytic activity of Ce-doped ZnO nanoparticles, Ceram. Int., 2016, 42, 14175–14181 CrossRef CAS.
- L. Diamandescu, M. Cernea, R. Trusca, M. Enculescu, L. Tanase, M. Baibarac, M. Feder, A. Nicoara and T. Popescu, Effects of a surfactant on the morphology and photocatalytic properties of polycrystalline Fe-doped ZnO powders, J. Phys. Chem. Solids, 2018, 121, 319–328 CrossRef CAS.
- M. Ahmad, E. Ahmed, F. Zafar, N. R. Khalid, N. A. Niaz, A. Hafeez, M. Ikram, M. Ajmal Khan and Z. L. Hong, Enhanced photocatalytic activity of Ce-doped ZnO nanopowders synthesized by combustion method, J. Rare Earths, 2015, 33, 255–262 CrossRef CAS.
- A. Samanta, M. N. Goswami and P. K. Mahapatra, Optical properties and enhanced photocatalytic activity of Mg-doped ZnO nanoparticles, Phys. E, 2018, 104, 254–260 CrossRef CAS.
- X. M. Hou, L. X. Wang, F. Li, G. F. He and L. Q. Li, Controlled loading of gold nanoparticles on ZnO nanorods and their high photocatalytic activity, Mater. Lett., 2015, 159, 502–505 CrossRef CAS.
- Y. C. Chang and J. Y. Guo, ZnO/Pt core-shell nanorods on the cotton threads with high enhanced photocatalytic properties, Mater. Chem. Phys., 2016, 180, 9–13 CrossRef CAS.
- C. A. Jaramillo-Páez, J. A. Navío, M. C. Hidalgo and M. Macías, ZnO and Pt-ZnO photocatalysts: characterization and photocatalytic activity assessing by means of three substrates, Catal. Today, 2018, 313, 12–19 CrossRef.
- L. Ma and S. J. Ding, Synthesis of thermostable Au@ZnO core-shell nanorods with efficient visible-light photocatalytic activity, Mater. Lett., 2018, 217, 255–258 CrossRef CAS.
- L. Liu, Z. W. Liu, Y. X. Yang, M. Q. Geng, Y. M. Zou, M. B. Shahzad, Y. X. Dai and Y. Qi, Photocatalytic properties of Fe-doped ZnO electrospun nanofibers, Ceram. Int., 2018, 44, 19998–20005 CrossRef CAS.
- S. Vignesh and J. K. Sundar, Investigations of visible light driven Sn and Cu doped ZnO hybrid nanoparticles for photocatalytic performance and antibacterial activity, Appl. Surf. Sci., 2018, 449, 617–630 CrossRef.
- T. H. Le, A. T. Bui and T. K. Le, The effect of Fe doping on the suppression of photocatalytic activity of ZnO nanopowder for the application in sunscreens, Powder Technol., 2014, 268, 173–176 CrossRef CAS.
- T. Saidani, M. Zaabat, M. S. Aida and B. Boudine, Effect of copper doping on the photocatalytic activity of ZnO thin films prepared by sol–gel method, Superlattices Microstruct., 2015, 88, 315–322 CrossRef CAS.
- H. J. Jung, R. Koutavarapu, S. Lee, J. H. Kim, H. C. Choi and M. Y. Choi, Enhanced photocatalytic activity of Au-doped Au@ZnO core-shell flower-like nanocomposites, J. Alloys Compd., 2018, 735, 2058–2066 CrossRef CAS.
- L. Muñoz-Fernandez, A. Sierra-Fernandez, O. Milošević and M. E. Rabanal, Solvothermal synthesis of Ag/ZnO and Pt/ZnO nanocomposites and comparison of their photocatalytic behaviors on dyes degradation, Adv. Powder Technol., 2016, 27, 983–993 CrossRef.
- Z. G. Jia, K. K. Peng, Y. H. Li and R. S. Zhu, Preparation and photocatalytic performance of porous ZnO microrods loaded with Ag, Trans. Nonferrous Met. Soc. China, 2012, 22, 873–878 CrossRef CAS.
- Y. Y. Dong, Y. Q. Jiao, B. J. Jiang and C. G. Tian, Commercial ZnO and its hybrid with Ag nanoparticles: photocatalytic performance and relationship with structure, Chem. Phys. Lett., 2017, 679, 137–145 CrossRef CAS.
- H. R. Liu, H. Liu, J. Yang, H. F. Zhai, X. G. Liu and H. S. Jia, Microwave-assisted one-pot synthesis of Ag decorated flower-like ZnO composites photocatalysts for dye degradation and NO removal, Ceram. Int., 2019, 45, 20133–20140 CrossRef CAS.
- Q. L. Huang, Q. T. Zhang, S. S. Yuan, Y. C. Zhang and M. Zhang, One-pot facile synthesis of branched Ag–ZnO heterojunction nanostructure as highly efficient photocatalytic catalyst, Appl. Surf. Sci., 2015, 353, 949–957 CrossRef CAS.
- Y. S. Liu, S. H. Wei and W. Gao, Ag/ZnO heterostructures and their photocatalytic activity under visible light: Effect of reducing medium, J. Hazard. Mater., 2015, 287, 59–68 CrossRef CAS PubMed.
- F. Chen, Y. Z. Tang, C. B. Liu, J. C. Qian, Z. Y. Wu and Z. G. Chen, Synthesis of porous structured ZnO/Ag composite fibers with enhanced photocatalytic performance under visible irradiation, Ceram. Int., 2017, 43, 14525–14528 CrossRef CAS.
- O. Bechambi, M. Chalbi, W. Najjar and S. Sayadi, Photocatalytic activity of ZnO doped with Ag on the degradation of endocrine disrupting under UV irradiation and the investigation of its antibacterial activity, Appl. Surf. Sci., 2015, 347, 414–420 CrossRef CAS.
- F. Hosseini, A. Kasaeian, F. Pourfayaz, M. Sheikhpour and D. S. Wen, Novel ZnO-Ag/MWCNT nanocomposite for the photocatalytic degradation of phenol, Mater. Sci. Semicond. Process., 2018, 83, 175–185 CrossRef CAS.
- S. Rajaboopathi and S. Thambidurai, Enhanced photocatalytic activity of Ag–ZnO nanoparticles synthesized by using padina gymnospora seaweed extract, J. Mol. Liq., 2018, 262, 148–160 CrossRef CAS.
- Y. M. Liang, N. Guo, L. L. Li, R. Q. Li, G. J. Ji and S. C. Gan, Fabrication of porous 3D flower-like Ag/ZnO heterostructure composites with enhanced photocatalytic performance, Appl. Surf. Sci., 2015, 332, 32–39 CrossRef CAS.
- X. L. Zhu, X. Z. Liang, P. Wang, Y. Dai and B. B. Huang, Porous Ag–ZnO microspheres as efficient photocatalyst for methane and ethylene oxidation: Insight into the role of Ag particles, Appl. Surf. Sci., 2018, 456, 493–500 CrossRef CAS.
- X. G. Han, H. Z. He, Q. Kuang, X. Zhou, X. H. Zhang, T. Xu, Z. X. Xie and L. S. Zheng, Controlling morphologies and tuning the related properties of nano/microstructured ZnO crystallites, J. Phys. Chem. C, 2009, 113, 584–589 CrossRef CAS.
- J. B. Mu, C. L. Shao, Z. C. Guo, Z. Y. Zhang, M. Y. Zhang, P. Zhang, B. Chen and Y. C. Liu, High photocatalytic activity of ZnO-Carbon nanofiber heteroarchitectures, ACS Appl. Mater. Interfaces, 2011, 3, 590–596 CrossRef CAS PubMed.
- Y. Zhao, J. Liu, L. Y. Shi, S. Yuan, J. H. Fang, Z. Y. Wang and M. H. Zhang, Solvothermal preparation of Sn4+ doped anatase TiO2 nanocrystals from peroxo-metal-complex and their photocatalytic activity, Appl. Catal., B, 2011, 103, 436–443 CrossRef CAS.
- S. Demirci, T. Dikici, M. Yurddaskal, S. Gultekin, M. Toparli and E. Celik, Synthesis and characterization of Ag doped TiO2 heterojunction films and their photocatalytic performances, Appl. Surf. Sci., 2016, 390, 591–601 CrossRef CAS.
- M. V. Dozzi, L. Artiglia, G. Granozzi, B. Ohtani and E. Selli, Photocatalytic activity vs. structural features of titanium dioxide materials singly doped or codoped with Fluorine and Boron, J. Phys. Chem. C, 2014, 118, 25579–25589 CrossRef CAS.
- M. Wang, J. Y. Xu, T. M. Sun, Y. F. Tang, G. Q. Jiang and Y. J. Shi, Facile photochemical synthesis of hierarchical cake-like ZnO/Ag composites with enhanced visible-light photocatalytic activities, Mater. Lett., 2018, 219, 236–239 CrossRef CAS.
- P. Sagar, P. K. Shishodia, R. M. Mehra, H. Okada, A. Wakahara and A. Yoshid, Photoluminescence and absorption in sol-gel-derived ZnO films, J. Lumin., 2007, 126, 800–806 CrossRef CAS.
- X. D. Zhu, R. R. Zhu, L. X. Pei, H. Liu, L. Xu, J. Wang, W. Feng, Y. Jiao and W. M. Zhang, Fabrication, characterization, and photocatalytic activity of anatase/rutile/SnO2 nanocomposites, J. Mater. Sci.: Mater. Electron., 2019, 30, 21210–21218 CrossRef CAS.
- A. Meng, X. J. Li, X. L. Wang and Z. J. Li, Preparation, photocatalytic properties and mechanism of Fe or N-doped Ag/ZnO nanocomposites, Ceram. Int., 2014, 40, 9303–9309 CrossRef CAS.
- J. X. Qin, J. Wang, J. J. Yang, H. Yun, M. L. Fu and D. Q. Ye, Metal organic framework derivative-TiO2 composite as efficient and durable photocatalyst for the degradation of toluene, Appl. Catal., B, 2020, 267, 118667 CrossRef CAS.
- J. Li, Y. J. Wang, Y. J. Li, G. Yao and B. Lai, Surface Fe(III)/Fe(II) cycle promoted the degradation of atrazine by peroxymonosulfate activation in the presence of hydroxylamine, Appl. Catal., B, 2019, 256, 117782 CrossRef CAS.
- J. A. Quek, S. M. Lam, J. C. Sin and A. R. Mohamed, Visible light responsive flower-like ZnO in photocatalytic antibacterial mechanism towards Enterococcus faecalis and Micrococcus luteus, J. Photochem. Photobiol., B, 2018, 187, 66–75 CrossRef CAS.
- X. X. Lin, R. Fei, D. G. Fu and C. W. Yuan, Enhanced photocatalytic activity of fluorine doped TiO2 by loaded with Ag for degradation of organic pollutants, Powder Technol., 2012, 219, 173–178 CrossRef CAS.
- S. D. Asl and S. K. Sadrnezhaad, Photocatalytic activity of rutile/anatase TiO2 nanorod/nanobranch thin film loaded with Au@Ag@Au core double shell nanoparticles, J. Photochem. Photobiol., A, 2019, 380, 111843 CrossRef.
- Y. X. Wang, C. Yan, L. Chen, Y. J. Zhang and J. H. Yang, Controllable charge transfer in Ag–TiO2 composite structure for SERS application, Nanomaterials, 2017, 7, 159 CrossRef.
- S. M. Hosseini, I. Abdolhosseini Sarsari, P. Kameli and H. Salamati, Effect of Ag doping on structural, optical, and photocatalytic properties of ZnO nanoparticles, J. Alloys Compd., 2015, 640, 408–415 CrossRef CAS.
- X. D. Zhu, L. X. Pei, R. R. Zhu, Y. Jiao, R. Y. Tang and W. Feng, Preparation and characterization of Sn/La co-doped TiO2 nanomaterials and their phase transformation and photocatalytic activity, Sci. Rep., 2018, 8, 12387 CrossRef.
- Z. F. Zhao, T. Y. Kou, L. X. Zhang, S. C. Zhai, W. Wang and Y. Wang, Dealloying induced N-doping in spindle-like porous rutile TiO2 for enhanced visible light photocatalytic activity, Corros. Sci., 2018, 137, 204–211 CrossRef CAS.
- T. Y. Kou, C. H. Jin, C. Zhang, J. Z. Sun and Z. H. Zhang, Nanoporous core-shell Cu@Cu2O nanocomposites with superior photocatalytic properties towards the degradation of methyl orange, RSC Adv., 2012, 2, 12636–12643 RSC.
- Z. L. Yang, J. Lu, W. C. Ye, C. S. Yu and Y. L. Chang, Preparation of Pt/TiO2 hollow nanofibers with highly visible light photocatalytic activity, Appl. Surf. Sci., 2017, 392, 472–480 CrossRef CAS.
- X. D. Zhu, H. Y. Xu, Y. Yao, H. Liu, J. Wang, Y. Pu, W. Feng and S. H. Chen, Effects of Ag0-modification and Fe3+-doping on the structural, optical and photocatalytic properties of TiO2, RSC Adv., 2019, 9, 40003–40012 RSC.
- X. X. Lin, F. Rong, D. G. Fu and C. W. Yuan, Enhanced photocatalytic activity of fluorine doped TiO2 by loaded with Ag for degradation of organic pollutants, Powder Technol., 2012, 219, 173–178 CrossRef CAS.
- N. Guy and M. Ozacar, The influence of noble metals on photocatalytic activity of ZnO for Congo red degradation, Int. J. Hydrogen Energy, 2016, 41, 20100–20112 CrossRef CAS.
Footnote |
| † Xiaodong Zhu and Juan Wang should be considered as first authors. |
| This journal is © The Royal Society of Chemistry 2021 |

