DOI:
10.1039/D1RA04976C
(Paper)
RSC Adv., 2021,
11, 31693-31711
Efficient corrosion inhibition by sugarcane purple rind extract for carbon steel in HCl solution: mechanism analyses by experimental and in silico insights†
Received
28th June 2021
, Accepted 12th September 2021
First published on 27th September 2021
Abstract
Sugarcane purple rind ethanolic extract (SPRE) was evaluated as an efficient corrosion inhibitor for carbon steel (C-steel) in 1 M HCl solution. Dynamic weight loss, potentiodynamic polarization, electrochemical impedance spectroscopy (EIS) and frequency modulation (EFM) measurements were employed to evaluate the anticorrosive efficiency of SPRE, which was further validated by morphological and wettability analyses. The results of the weight loss tests showed that the inhibition efficiency (ηw) for C-steel in HCl solution increased with an increase in the concentration of SPRE. An increase in temperature moderately impaired the anticorrosive efficacy of SPRE. The maximum ηw of 96.2% was attained for C-steel in the inhibition system with 800 mg L−1 SPRE at 298 K. The polarization curves indicated that SPRE simultaneously suppressed the anodic and cathodic reactions for C-steel in HCl solution, which can be categorized as a mixed-type corrosion inhibitor with a predominant anodic effect. The corrosion current density (icorr-P) was monotonously reduced with an increase in the concentration of SPRE. The charge transfer resistance (Rct) was enhanced for C-steel in the inhibition solution with a restrained capacitive property due to the adsorption of SPRE. A high temperature caused partial desorption of SPRE on the C-steel surface and a slight increase in icorr-P and decrease in Rct. However, SPRE still fully maintained its morphology and wettability at 328 K. The electrochemical kinetics of C-steel in HCl solution without and with SPRE was also supported by EFM spectra. The adsorption of SPRE conformed to the Langmuir isotherm and increased the corrosion activation energy of C-steel. Complementing the experimental observations, calculations based on density functional theory indicated that the hydroxyl-substituted pyran moiety on the carthamin (CTM) and anthocyanin (ATC) constituents in SPRE hardly contributed to its reactive activity due to their adsorption processes. Therefore, CTM and ATC exhibited imperfect parallel adsorption on the Fe (100) plane according to the molecular dynamics simulation, while anthoxanthin (ATA) and catechinic acid (CCA) constituents exhibited a flat orientation on the iron surface.
1. Introduction
Carbon steel (C-steel) is utilized in a myriad of industrial domains as a structural material due to its fascinating properties such as high mechanical strength, toughness and machinability.1–3 However, corrosion is the most challenging issue associated with C-steel in the service environment, especially acidic solution, which hampers the lifespan of related facilities and even causes severe accidents.4 Furthermore, the release of rust in the ecosystem also poses a heavy environmental burden.5 Thereby, research efforts have been devoted to controlling the deterioration of C-steel in various corrosive media. Consequently, corrosion inhibitors, especially organic species, have attracted significant scientific and industrial attention owing to their low cost, convenience and efficiency.6 Many compounds such as imidazoles,7 quinolines8 and amines9 have been explored as effective corrosion inhibitors for C-steel in various media. However, their low biodegradability, high cost and rigorous synthesis protocols hamper their sustainable application. Severe environmental issues have also caused the scientific and economic communities to focus on the utilization of eco-friendly compounds without inherent toxicity as effective corrosion inhibitors.
Plant extracts are a fast-growing family of environmentally friendly inhibitors owing to their biodegradability, accessibility and affordability.10 Moreover, due to the increasing awareness of sustainable development, biomass waste has been regarded as desirable materials for extracting functional components, which may also be an effective solution for garbage sorting and recycling. Accordingly, many active compounds such as carboxylic acids, bioamines, polysaccharides, polyphenols and flavonoids have been developed as inhibitors.11–13 Haldhar et al.14 extracted phytochemicals from Cannabis sativa leaves (CSLE) as a corrosion inhibitor for C-steel in 0.5 M H2SO4 solution. The inhibition efficiency reached up to 97.31% with 200 mg L−1 CSLE by physicochemical adsorption. Jmiai and co-workers15 employed jujube shell extract (JSE) to mitigate copper corrosion in 1 M HCl solution. The electrochemical results indicated that JSE prominently inhibited the cathodic reaction at the copper/electrolyte interface, yielding an efficiency of 91% (2 g L−1 extract). Li et al.16 acquired walnut green husk extract (WGHE) for the corrosion inhibition of cold rolled steel in 3.0 M H3PO4 solution. Although an insufficient inhibition efficiency was observed using only WGHE, a superior result (97.2%) was attained by the synergistic effect between WGHE and sodium lignosulfonate. As prevalent phytochemicals, polyphenols and flavonoids are frequently acquired from plants as corrosion inhibitors. HosseinpourRokni et al.17 utilized polyphenol-containing extracts to inhibit the alkaline corrosion of aluminum alloy, which also improved the anode utilization in an air battery. A representative flavonoid was extracted from Ruta chalepensis leaves by Benghalia and co-workers, which could mitigate the corrosion of X52 steel in 1 M HCl solution with an efficiency of 80.65%.18 Kouache et al.19 extracted polyphenols (IVE) from Inula viscosa and employed IVE to prevent the corrosion of X70 steel in 1 M HCl solution. Both weight loss and electrochemical measurements demonstrated that IVE was an effective corrosion inhibitor, yielding a maximum efficiency of 92%. However, the reported anticorrosive efficiency of polyphenol- and/or flavonoid-based biomass extracts is still unsatisfactory, especially for M-steel in an acid-chloride environment (vide infra).
Recently, the cost, complexity and lengthy times of experimental protocols have motivated researchers to develop efficient simulations to deeply disclose the corrosion retardation behaviors of inhibitors for metals in aggressive media.20 In detail, theoretical calculations can probe the intrinsic structural properties of an inhibitor on the electronic/atomic scale and trigger a great deal of interest in clarifying the underlying anticorrosion mechanism. For instance, Shahini et al.2 utilized molecular dynamics (MD) and Monte Carlo (MC) simulations to elucidate the adsorption configuration of Mish Gush leaf extract (MGLE) on the Fe (110) plane. The anticorrosion mechanism of the main constituents in MGLE was also supported by density functional theory (DFT) calculations. Palaniappan et al.21 prepared ethanolic extracts (CRE) of the root and stem of Catharanthus roseus for retarding the corrosion of C-steel in 3.5% NaCl solution. They proposed the adsorption mechanism of the CRE constituents according to the reactive descriptors from DFT calculations. However, owing to the inevitable deviation from the actual situation, the accuracy and feasibility of theoretical calculations are still controversial for revealing the anticorrosive nature of an inhibitor.22 Besides, the relationship between electronic parameters and experimentally obtained inhibition efficiency also remains elusive. Crucially, although the bulk of theoretical calculations has already done for the adsorption mechanism, little focus has been given to the ion–dipole interaction for inhibitors in an aqueous environment.
Considering high performance and feasibility, we selected the inedible sugarcane purple rind (SPR) as the raw material, which is rich in polyphenols and flavonoids.23 The ethanolic extract of SPR (SPRE) was employed as a potential corrosion inhibitor for C-steel in 1 M HCl solution. To the best of our knowledge, the anticorrosive effect of SPRE for C-steel in acidic solution has not been reported to date. The corrosion mitigation effect of SPRE was thoroughly evaluated by dynamic weight loss measurement, potentiodynamic polarization, electrochemical impedance spectroscopy (EIS) and frequency modulation (EFM) at different temperatures. The surface analysis supported the favorable anticorrosion capacity of SPRE for C-steel in HCl solution. Moreover, dominant solvent models were built for the main constituents of SPRE through multi-scale simulation, which were further employed in DFT calculations. MD simulations were also conducted to probe the adsorption mechanism of the SPRE constituents on the Fe (100) plane. The complementary and consistent information between the experimental and theoretical results indicated that SPRE is a promising candidate for inhibiting the corrosion of C-steel in acidic media.
2. Experimental
2.1 Materials
Fresh SPR was uniformly collected from Huizhou, Guangdong Province, in December 2020 to avoid a difference in constituents due to region and time variation. Analytically pure anhydrous ethanol, acetone and concentrated HCl solution (37 wt%) were obtained from Beijing Chemical Works (China). The chromatographic standard substances proposed in SPRE were supplied by D&A Systems Co. Ltd (Beijing, China). Q235 steel sheets (50 × 25 × 2 mm3) were employed as the substrate, which were purchased from Tianjin Institute of Chemical Research & Design (China), whose chemical components are listed in Table S1 (ESI†). Lab-made deionized water (18.2 MΩ cm2) was utilized to prepare the corrosive medium (1 M HCl solution) by diluting a concentrated HCl solution.
2.2 Extraction procedure and characterization
The saccharose-rich fibrovascular tissue of SPR was carefully scraped to avoid enzymatic reactions before the extraction, only leaving the inedible stiff rind. Then, SPR was cleaned using deionized water, naturally seasoned under ambient conditions, crushed into fragments using an agate mortar, and then ground into a fine powder. 15.0 g SPR powder was charged in a round-bottom flask with 250 mL anhydrous ethanol through a Soxhlet apparatus at 343 K for 12 h. The ethanolic solution was centrifuged at 1500 rpm to remove the trace amount of insoluble debris, and further distilled under reduced pressure at 328 K until a brown paste was acquired. Afterwards, the paste was decanted and oven-dried at 343 K overnight; ultimately, about 5.9 g (yield: 39.3%) brown particles was obtained and labeled as SPRE. The polyphenol and flavonoid contents were verified via the Folin–Ciocalteu colorimetric method.24 The chemical constituents in SPRE were identified using a 1220 Infinity II high-performance liquid chromatographic system (HPLC, Agilent, USA) using a Kromasil 100-5C18 column with acetonitrile as the mobile phase. A UV detector registered at 280 nm was utilized to monitor the active components in SPRE. In addition, Fourier transform infrared spectra (FTIR) of SPR powder and SPRE were recorded using an iN10 MX model (Thermo Scientific, USA) in the wavenumber range of 4000 to 400 cm−1.
2.3 Corrosion inhibition analysis
2.3.1 Dynamic weight loss measurement. C-steel coupons were degreased in acetone for 6 h, abraded successively by water-proof emery paper from 200 to 2000 mesh, polished on a piece of artificial schammy, sequentially cleaned with ethanol and deionized water, and eventually dried under a nitrogen flow. The polished coupons were fixed on an RCC-III rotation corrosion instrument (Qinyou Company, China) in triplicate and immersed in 1 M HCl solution without and with a concentration gradient of SPRE (100, 200, 400, 600 and 800 mg L−1). The immersion system was incubated in a water bath at selected temperatures with a rotation speed of 72 rpm for 24 h. Afterwards, the C-steel coupons were withdrawn from the solution and ultrasonically washed in acetone to remove the corrosion products. Employing the weight loss (Δm, kg) of the coupon before and after immersion, the corrosion rate (v, mm/a) of C-steel and the corresponding inhibition efficiency (ηw, %) were calculated using the following equations:| |
 | (1a) |
| |
 | (1b) |
where S (mm2) is the area of the coupon; t (h) is the immersion period; and v0 and vi (mm/a) are the corrosion rates of C-steel in HCl solution without and with different concentrations of SPRE, respectively.
2.3.2 Electrochemical evaluation. An Autolab PGSTAT302N workstation (Metrohm, Switzerland) was used to perform all electrochemical determinations in a three-electrode cell under non-stirred conditions at pre-set temperatures. A C-steel coupon encased in an epoxy holder (effective area of 1 cm2) was employed as the working electrode; platinum foil was utilized as the counter electrode; and Ag/AgCl (KCl sat.) connected with a Luggin capillary was used as the reference electrode. The testing cell was kept in a Faraday cage throughout the measurement to minimize external interferences.Prior to the electrochemical measurements, the C-steel electrode was conditioned in the test solution for 30 min to stabilize the open circuit potential (Eocp). Potentiodynamic polarization was conducted in the potential range of −250 to 250 mV vs. Eocp with a scanning rate of 1 mV s−1. The Stern–Geary relationship was used to determine the corrosion current density (icorr), from which the inhibition efficiency (ηp, %) could be estimated as follows:
| |
 | (2) |
where
i0corr and
iicorr (mA cm
−2) are the current densities of C-steel in HCl solution without and with different concentrations of SPRE, respectively. Electrochemical impedance spectroscopy (EIS) was performed at
Eocp in the frequency range of 10
−1 to 10
5 Hz with a sine amplitude of 10 mV. The EIS data was fitted using the in-built NOVA 2.1 software. Based on the fitted charge transfer resistance (
Rct), the corrosion inhibition efficiency (
ηe, %) of SPRE for C-steel in HCl solution was calculated as follows:
| |
 | (3) |
where
R0corr and
Ricorr (Ω cm
2) are the charge transfer resistances for C-steel in the uninhibited and inhibited solutions, respectively. The base frequency of the electrochemical frequency modulation (EFM) test was set at 0.1 Hz using multipliers of 2 and 5 with a 10 mV amplitude and sinusoidal waveform of 16 cycles. According to the deterioration nature of C-steel in acidic media, an activation-controlled model was employed to resolve the EFM spectra. Triplicate tests were conducted to reliably check the reproducibility of the electrochemical results.
2.4 Surface analysis
The surface morphologies of the C-steel coupons after 24 h immersion in 1 M HCl solution without and with 800 mg L−1 SPRE at 328 K were examined using a Quanta FEG 250 scanning electron microscope (SEM, FEI, USA) at an accelerating voltage of 10 kV. Besides, the water contact angle for the sample after 24 h immersion in the uninhibited or inhibited solutions was also checked using an OCA 35 optical contact angle setup (DataPhysics, Germany). A Dimension FastScan atomic force microscope (AFM, Bruker, Germany) was employed to acquire the surface topographies of C-steel after 24 h immersion in HCl solution without and with 800 mg L−1 SPRE in tapping mode at 328 K. Notably, surface analysis of the freshly polished C-steel was also performed for comparison.
2.5 Theoretical simulation
2.5.1 Quantum chemical analysis. Materials studio (BIOVIA, France) was employed for the theoretical studies. First-principles DFT analyses of the main constituents in SPRE were performed using the DMol3 module. Microspecies analyses were initially performed to ascertain the accurate chemical state of each constituent in 1 M HCl solution for the subsequent DFT calculations. According to our previous reports,25–27 the dominant solvent models of the main SPRE constituents were built through multi-scale simulations. Each model was thoroughly optimized using the generalized gradient approximation treated by the Perdew–Burke–Ernzerhof exchange correlation potential. An all electron double numerical atomic orbital augmented by d-polarization functions was employed as the basis set (version 4.4). Global reactive descriptors, i.e., optimized configuration, highest occupied molecular orbital (HOMO), lowest unoccupied molecular orbital (LUMO) and electrostatic potential mapping (ESP), were extracted for four constituents. Meanwhile, local descriptors (Fukui indices) were also estimated by Mulliken population analysis and projected on the isosurface of the total electron density.
2.5.2 Molecular dynamics simulation. MD simulations were conducted via the Forcite Plus module to elucidate the adsorption mechanism of the main constituents of SPRE on the C-steel surface. The Fe (100) plane with the highest surface energy was cleaved (five layers) from an iron crystal, which was fully relaxed and fixed before the MD simulations. A vacuum slab of 30 Å was created together with the enlargement of the periodic simulation box as 37.3 × 37.3 × 46.5 Å3, which was sufficient for the interaction between the Fe (100) surface and the inhibitor. Conforming to the actual corrosive medium, 1682 water molecules (1 g cm−3), 10H3O+, 10 Cl− and one inhibitor were involved in a single system, in which the inhibitor was randomly placed in the box. Group-based cutoff and Ewald schemes were utilized to deal with the van der Waals and electrostatic interactions, respectively. After full optimization of the system employing the interface force field, the Quench task was applied to acquire the adsorption course of the inhibitors on the Fe (100) surface at 298 K under the NVT canonical ensemble (constant atom number, volume and temperature maintained by Nose thermoset) for 2000 ps with a step of 1 fs. The last 100 frames of the dynamic trajectory were averaged to extract the energy eigenvalues.
3. Results and discussion
3.1 Characterization of SPRE
HPLC chromatography of SPRE is shown in Fig. S1.† Coupling the retention time of the standard substances with other reports,23,28 four remarkable components were identified as carthamin (CTM), anthocyanin (ATC), anthoxanthin (ATA) and catechinic acid (CCA), the structures of which are displayed in Fig. 1. Moreover, the contents of polyphenols and flavonoids were estimated to be 203.51 ± 9.04 mg GAE/g and 116.27 g QE/g, respectively, using the Folin–Ciocalteu colorimetric method, which validated the rationality of the main constituents in SPRE.
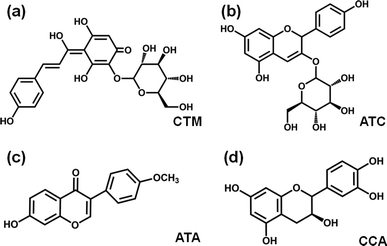 |
| | Fig. 1 Molecular structures of the main constituents in SPRE: (a) carthamin (CTM), (b) anthocyanin (ATC), (c) anthoxanthin (ATA) and (d) catechinic acid (CCA). | |
The functional groups on the main SPRE constituents were chemically identified via FTIR spectroscopy, as shown in Fig. 2. The similar spectra of the SPR powder and SPRE confirm the dominance of the proposed constituents in SPRE. The broad peak centered at 3358 cm−1 is ascribed to the stretching vibration of –OH, resulting from the hydroxyl-terminated polyphenols and flavonoids.29 The peak at 2928 cm−1 is associated with the stretching vibration of the alkyl groups (–CH2–).27 The stretching of the typical –C![[double bond, length as m-dash]](https://www.rsc.org/images/entities/char_e001.gif) O on flavonoids can be identified at 1731 cm−1.2 While, another featured vibration for flavonoid is recognized at 1625 cm−1 (aromatic oxide).30 The peak located at 1415 cm−1 corresponds to the stretching vibration of C–O–C.1 The shoulder peak at 1053 cm−1 is the characteristic adsorption of the glycosidic structure.13 The presence of substituted glucopyranose is confirmed by the peaks at 923 and 870 cm−1.23 Closer inspection of the spectra in Fig. 2 reveals that both bathochromic and hypochromatic shifts occurred for the characteristic adsorption of SPRE compared to that of SPR. This may be due to the purification of the main constituents after ethanolic extraction. According to the FTIR analysis, the oxygen heteroatoms, aromatic rings and conjugated unsaturated bonds in SPRE can behave as active sites for adsorption on the C-steel surface, and thus inhibit dissolution of the metal in aggressive media.31
O on flavonoids can be identified at 1731 cm−1.2 While, another featured vibration for flavonoid is recognized at 1625 cm−1 (aromatic oxide).30 The peak located at 1415 cm−1 corresponds to the stretching vibration of C–O–C.1 The shoulder peak at 1053 cm−1 is the characteristic adsorption of the glycosidic structure.13 The presence of substituted glucopyranose is confirmed by the peaks at 923 and 870 cm−1.23 Closer inspection of the spectra in Fig. 2 reveals that both bathochromic and hypochromatic shifts occurred for the characteristic adsorption of SPRE compared to that of SPR. This may be due to the purification of the main constituents after ethanolic extraction. According to the FTIR analysis, the oxygen heteroatoms, aromatic rings and conjugated unsaturated bonds in SPRE can behave as active sites for adsorption on the C-steel surface, and thus inhibit dissolution of the metal in aggressive media.31
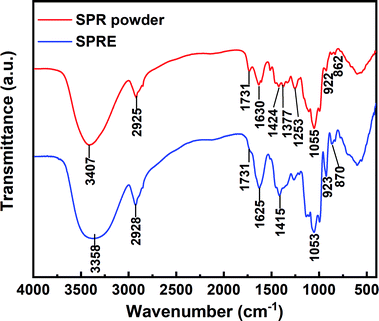 |
| | Fig. 2 FTIR spectra of SPR powder and SPRE. | |
3.2 Corrosion inhibition effect of SPRE
3.2.1 Dynamic weight loss. As a reliable strategy, the anticorrosive effect of SPRE for C-steel in 1 M HCl solution was preliminarily determined via the dynamic weight loss method. Fig. 3 shows the corrosion rate of C-steel in 1 M HCl solution at the desired temperature without and with different SPRE concentrations together with the corresponding ηw. As is seen in Fig. 3a, the corrosion rate was prominently reduced upon the addition of SPRE at each constant temperature and the inhibition effect became more significant with an increase in the concentration of SPRE. By virtue of its abundant active sites, SPRE adsorbs on the C-steel surface, isolates the corrosive species, and thus decelerates the corrosion rate. However, elevated temperature impaired the efficacy of SPRE for C-steel given that the corrosion rate increased at each inhibitor dosage. This is because the movement of the species is inevitably aggravated at the steel/electrolyte interface; besides, the interfacial colloidal viscosity also decreases with an increase in temperature.9 Consequently, the adsorption tendency and strength of SPRE are weakened at high temperatures. The uncovered sites on the C-steel surface are vulnerable to acidic corrosion, leading to a relatively high corrosion rate. Notably, the ηw for the solution with 800 mg L−1 SPRE at 328 K was as high as 5.93 mm/a, which is still lower than that of the blank control at 298 K (7.37 mm/a). This evidences that SPRE is a potent material for mitigating the corrosion of C-steel in HCl medium. Accordingly, the ηw in Fig. 3b exhibits an ascending trend with an increase in the concentration of SPRE at a certain temperature, while an increase in temperature lower ηw with the same dosage of SPRE. The maximum ηw of 94.7% was achieved for C-steel immersed in HCl solution with 800 mg L−1 SPRE at 298 K.
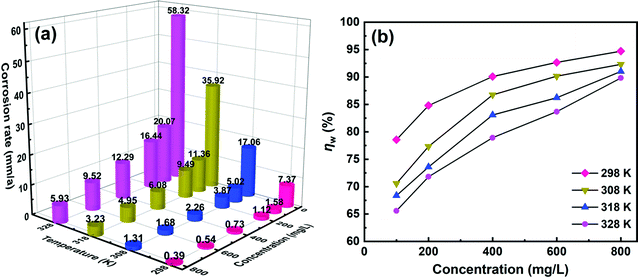 |
| | Fig. 3 Corrosion rates (a) and corresponding inhibition efficiencies (b) for C-steel in 1 M HCl solution without and with designed concentrations of SPRE. | |
3.2.2 Potentiodynamic polarization. To elucidate the kinetic mechanism of corrosion inhibition, potentiodynamic polarization was carried out for C-steel in 1 M uninhibited and inhibited HCl solution. Initially, Eocp was recorded, as shown in Fig. 4a, to ensure the stability of the polarization tests. Clearly, the Eocp for C-steel exposed in the uninhibited solution varied due to the continuous active state in the corrosive electrolyte. On the contrary, Eocp for each inhibited specimen reached quasi-equilibrium after 30 min immersion in HCl solution. Moreover, the Eocp for the inhibited system was superior to that of the blank control, which was more pronounced at a higher inhibitor concentration. The positive shift in Eocp reveals that the adsorption of SPRE efficiently shields the active sites on the C-steel surface.
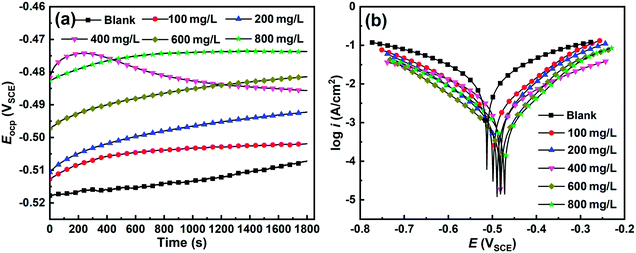 |
| | Fig. 4 Evolution of the open circuit potential (a) and potentiodynamic polarization curves (b) for C-steel in 1 M HCl solution at 298 K without and with designed concentrations of SPRE. | |
Fig. 4b displays the polarization curves for C-steel in HCl solution without and with different concentrations of SPRE at 298 K. Obviously, both the anodic and cathodic branches shifted toward the low current density region for C-steel in the SPRE-containing solution, which became more remarkable with an increase in the concentration of the inhibitor. It is well-established that the corrosion of C-steel in HCl medium consists of anodic metal dissolution and cathodic hydrogen evolution.32 SPRE adsorbs on the active sites of the C-steel surface, isolates the metal from aggressive species, and thus reduces the corrosion current density. In addition, the almost parallel cathodic curves shown in Fig. 4b imply that the presence of SPRE hardly altered the hydrogen evolution mechanism.33 On the contrary, the anodic counterpart exhibited a relatively severe change for the inhibited system. Hence, SPRE preferentially adsorbs on the anodic sites along the inner Helmholtz plane on the C-steel surface, and the ensuing adsorption layer acts as a barrier to lower metal dissolution. This speculation is also evidenced by the positive shift in corrosion potential (Ecorr), which was derived by extrapolation of the Tafel slope.25
The electrochemical kinetic parameters, namely Ecorr, corrosion current density (icorr-P), anodic (βa) and cathodic (βc) slopes, derived from the curves in Fig. 4b are tabulated in Table 1. As expected, icorr-P continuously declined as the concentration of SPRE increased, disclosing the arrested corrosion of C-steel in HCl solution due to the adsorption of the inhibitor. Consequently, ηp monotonously increased with an increase in the concentration of the inhibitor, which reached 95.2% for the inhibited solution with 800 mg L−1 SPRE. The Ecorr value was enhanced for C-steel in the SPRE-containing solution, consolidating the predominant anodic inhibition effect.34 Noteworthily, the Ecorr value equilibrated in around −0.472 V (800 mg L−1 of SPRE), which has a difference smaller than 85 mV compared to that for the uninhibited control (−0.513 V). Therefore, SPRE can be categorized as a mixed-type corrosion inhibitor with a dominant anodic effect for C-steel in HCl medium. Furthermore, the insignificant variation in βc for C-steel in the uninhibited and inhibited solution indicates that SPRE hardly changed the hydrogen evolution mechanism. In contrast, βa increased with an increase in the concentration of SPRE, indicating that the dissolution of C-steel was gradually decayed in the HCl solution. Closer inspection of the data in Table 1 reveals that βa for the blank control is larger than that obtained in the presence of SPRE. This may be attributed to the generated H2 at the steel/electrolyte interface due to the serious corrosion, which can instantaneously block the charge exchange and elevate the apparent βa.
Table 1 Electrochemical kinetic parameters for C-steel in 1 M HCl solution at 298 K without and with designed concentrations of SPRE
| CSPRE (mg L−1) |
Ecorr (V) |
icorr-P (mA cm−2) |
βa (mV dec−1) |
−βc (mV dec−1) |
ηp (%) |
| 0 |
−0.513 |
8.89 |
165.45 |
151.37 |
— |
| 100 |
−0.503 |
2.26 |
132.63 |
149.47 |
74.6 |
| 200 |
−0.494 |
1.38 |
141.27 |
150.55 |
84.5 |
| 400 |
−0.485 |
0.93 |
159.20 |
143.12 |
89.5 |
| 600 |
−0.482 |
0.71 |
153.37 |
147.73 |
92.0 |
| 800 |
−0.472 |
0.43 |
155.28 |
145.06 |
95.2 |
3.2.3 Electrochemical impedance spectroscopy. Fig. 5(a) and (b) illustrate the Nyquist and Bode plots for C-steel in 1 M HCl solution at 298 K without and with different concentrations of SPRE, respectively. In Fig. 5a, all the Nyquist curves exhibit an irregular semicircle in the high frequency domain, which can be assigned to the heterogeneous nature of the solid/liquid interface.35 Besides, the single suppressed capacitive loop also indicates that the corrosion of C-steel in HCl solution is principally governed by the charge transfer mechanism without and with SPRE. This is supported by the single maximum of the phase angle presented in Fig. 5b. A small inductive loop can be observed in the low-frequency region, which may be explained by the relaxation of H2 adsorption/desorption for C-steel in strong acidic solution.36 The diameter of the Nyquist curve became enlarged and more pronounced with an increase in the concentration of SPRE, implying the progressively enhanced charge transfer resistance (Rct) of C-steel in the inhibited solution.37 A high concentration of SPRE in the corrosive medium intensely interacts with the C-steel surface, allowing the formation of a less permeable barrier layer, which attenuates the interfacial charge transfer, and thereby intensifies Rct. The improved interfacial resistance is also evidenced by Bode spectra shown in Fig. 5b. The low-frequency impedance modulus increased with an increase in the concentration of SPRE. Furthermore, the increase in the phase angle maximum and broadening of the phase angle peak in the middle-frequency region with an increase in the concentration of SPRE concentration collectively confirm the effective inhibitor adsorption and the consequent corrosion mitigation for the C-steel substrate. The slope of log![[thin space (1/6-em)]](https://www.rsc.org/images/entities/char_2009.gif) f vs. log
f vs. log![[thin space (1/6-em)]](https://www.rsc.org/images/entities/char_2009.gif) |Z| approached −1 with an increase in the concentration of SPRE concentration, suggesting the favorable capacitive characteristic at the steel/electrolyte interface.38
|Z| approached −1 with an increase in the concentration of SPRE concentration, suggesting the favorable capacitive characteristic at the steel/electrolyte interface.38
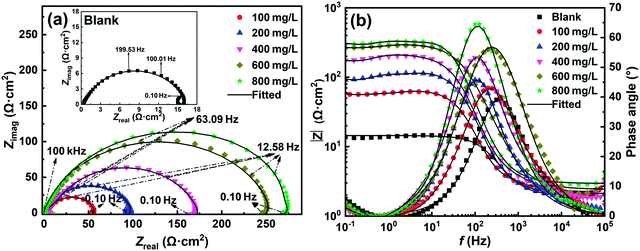 |
| | Fig. 5 Nyquist (a) and Bode (b) plots for C-steel in 1 M HCl solution at 298 K without and with designed concentrations of SPRE. | |
The impedance parameters were obtained by fitting the equivalent circuit (Fig. 6) to quantitatively elucidate the electrochemical behavior. In detail, the circuit shown in Fig. 6a was employed to optimize the results with the prominent inductive element (L), i.e., the spectra of the specimens in the absence and presence of SPRE (100, 200 and 400 mg L−1), while the others were fitted by the circuit depicted in Fig. 6b. Herein, a constant phase element (CPE) was utilized to compensate the dispersion effect caused by electrode roughness and inhomogeneity, whose impedance (ZCPE) could be calculated using the following empirical impedance function:39
where
Y0 is the proportional coefficient;
j (
j2 = −1) is the virtual root;
ω (2π
f, rad s
−1) is the angular frequency; and
n is the phase shift index. The typical parameters including solution resistance (
Rs),
Rct, double-layer capacitance (
Cdl) and
n are compiled in
Table 2. Accordingly, the
Cdl values were deduced using the Brug formula as follows:
32| |
 | (5) |
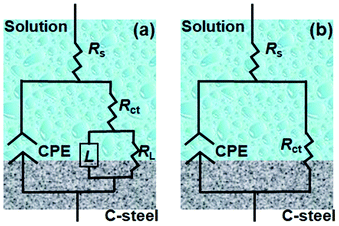 |
| | Fig. 6 Equivalent circuits employed for fitting the EIS data with (a) and without (b) the inductance element.. | |
Table 2 Impedance parameters for C-steel in 1 M HCl solution at 298 K without and with designed concentrations of SPRE
| CSPRE (mg L−1) |
Rs (Ω cm2) |
Rct (Ω cm2) |
CPE |
ηe (%) |
χ2 (×10−4) |
| Cdl (μF cm−2) |
n |
| 0 |
1.85 |
16.37 |
257.19 |
0.82 |
— |
3.85 |
| 100 |
2.13 |
56.12 |
110.25 |
0.88 |
70.83 |
6.01 |
| 200 |
1.94 |
95.79 |
95.04 |
0.91 |
82.91 |
1.54 |
| 400 |
2.07 |
169.46 |
82.38 |
0.93 |
90.34 |
2.51 |
| 600 |
1.89 |
254.59 |
77.40 |
0.95 |
93.57 |
8.92 |
| 800 |
2.11 |
275.91 |
75.27 |
0.96 |
94.07 |
3.13 |
The relatively low magnitude of the χ2 values and the materially equivalent Rs values in Table 2 suggest the validity of our fitting procedure.40 The value of Rct increased from 16.37 to 275.91 Ω cm2 when the concentration of SPRE reached 800 mg L−1. Accordingly, the ηe of 94.07% was achieved, indicating the favorable corrosion inhibition by SPRE for C-steel in HCl solution. Owing to the sufficient adsorption of SPRE on the C-steel surface, the pre-adsorbed water molecules are progressively substituted by the specific organic constituents with a low dielectric constant. Consequently, Cdl decreased with an increase in SPRE concentration according to the following relationship:9
| |
 | (6) |
where
ε and
ε0 are the local and vacuum dielectric constants, respectively;
d is the thickness of the double layer; and
S is the effective area of the electrode. Specifically, the adsorption of SPRE on the C-steel surface led to a reduction in the local dielectric constant and increase in the thickness of the double layer. Therefore,
Cdl apparently declined for C-steel in the inhibited solution. The continuous increase in
Rct and decrease in
Cdl also indicate that the adsorption layer of SPRE tended to be uniform and compact. Relying on the favorable adsorption, the
n value gradually increased became close to unity.
n values exceeding 0.95 were observed for the specimen in the corrosive medium with an SPRE concentration over 600 mg L
−1. A large
n value indicates a relatively smooth and homogeneous surface due to the adsorption of the inhibitor.
41 In summary, the electrochemical-acquired variation in the inhibition efficiencies (
ηp and
ηe) are in accordance with that obtained from the weight loss measurements (
ηw).
3.2.4 Electrochemical frequency modulation. Evaluation of the anticorrosion capacity of an inhibitor is also accessible in a nondestructive manner by recording EFM spectra.42 Fig. S2† (ESI) shows the EFM spectra in the form of current-frequency for C-steel in 1 M HCl solution at 298 K without and with different concentrations of SPRE. The harmonic (integral multiple of base frequencies) and intermodulation (algebraic sum of base frequencies) peaks are obviously distinguished and more distinct than the background noise. This facilitated the calculation of the kinetic parameters, such as the corrosion current density (icorr-E) and causality factors 2/3 (CF2 and CF3) through an activation-controlled model, as depicted in Fig. 7. As can be seen, the negligible variation of CF2 for the specimens without and with different SPRE concentrations signifies that C-steel suffered from uniform corrosion.43 In addition, the negligible deviation from the theoretical values (i.e., 2 and 3) for CF2 and CF3 confirms the causality between input potential disturbance and response current signal, respectively.44 A noticeable decrease in icorr-E was observed upon the addition of SPRE to the HCl solution, and icorr-E was further suppressed as the concentration of SPRE increased. The reduction in icorr-E is powerful evidence to support the availability of SPRE for corrosion inhibition in its natural state toward C-steel in HCl solution. The lone sp2 electron pairs of the abundant O heteroatoms on the main constituents in SPRE can interact with the empty d-orbital of the Fe atom; subsequently, effective adsorption occurs together with tight binding between the inhibitor molecules and metal atoms. Careful perusal of Fig. 7 reveals that the kinetic parameters derived from the EFM spectra agree well with that obtained from the polarization tests.
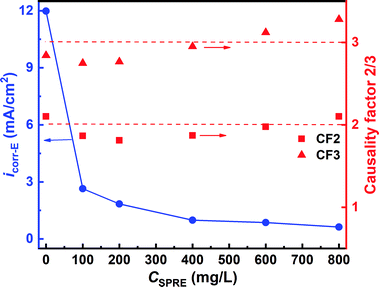 |
| | Fig. 7 Kinetic parameters derived from the EFM spectra for C-steel in 1 M HCl solution with different concentrations of SPRE at 298 K. | |
3.3 Effect of temperature on the anticorrosive capacity of SPRE
3.3.1 Potentiodynamic polarization. As verified by the weight loss method, temperature affects the corrosion inhibition potency of SPRE for C-steel in 1 M HCl solution. This motivated us to evaluate the electrochemical behavior of C-steel in the corrosive medium with the optimal SPRE concentration (800 mg L−1) at different temperatures. Fig. 8a displays the evolution of Eocp for C-steel in HCl solution with 800 mg L−1 SPRE at a temperature in the range of 298 to 328 K. Apparently, the Eocp values of C-steel tended to achieve pseudo-equilibrium after 30 min immersion in HCl solution at the allocated temperatures. Additional insight from Fig. 8a revealed that an increase in temperature lowered the equilibrium Eocp value. The interfacial exchange of species is aggravated under high temperature, which may impair the adsorption tendency of SPRE on the C-steel surface. Less adsorbed inhibitor molecules cause more active sites on the metal to be exposed to the corrosive medium, which can activate the C-steel surface, and thus reduce the Eocp value.45
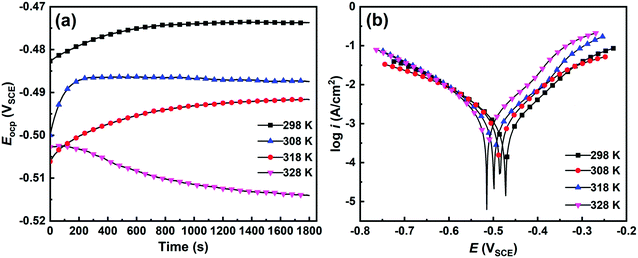 |
| | Fig. 8 Evolution of the open circuit potential (a) and potentiodynamic polarization curves (b) for C-steel in 1 M HCl solution with 800 mg L−1 SPRE at pre-set temperatures. | |
Fig. 8b shows the polarization curves of C-steel in 1 M HCl solution with 800 mg L−1 SPRE at different temperatures. As observed, the curve shifts toward the high-current region with an increase in temperature, revealing the intensified charge exchange at the steel/electrolyte interface. Further scrutiny of Fig. 8b indicates that faint shoulder peaks emerge at about −0.375 V on the anodic branches of the curves obtained at 318 and 328 K. This can be ascribed to the desorption of the physically adsorbed SPRE constituents at the relatively high temperature.46 Meanwhile, altering the temperature dominantly changed the anodic process rather than its cathodic counterpart, confirming that SPRE behaves as a mixed-type inhibitor with a predominant anodic effect for preventing C-steel from corrosion.32 The effect of temperature on the corrosion inhibition capacity of SPRE is also manifested by the fitted kinetic parameters tabulated in Table 3. According to Table 3, icorr-P persistently increased from 0.43 mA cm−2 at 298 K to 1.01 mA cm−2 at 328 K, which indicates that an increase in temperature exacerbated the corrosion of C-steel in the HCl solution to a certain extent. Fortunately, the icorr-P for C-steel in HCl solution at 328 K with 800 mg L−1 SPRE was still much lower than that obtained at 298 K without inhibitor, suggesting that SPRE exerts favorable anticorrosion efficiency through effective adsorption. The value of βa decreased due to the partial SPRE desorption caused by the increase in temperature, which indicates the aggravated corrosion of C-steel. On the contrary, an indistinctive variation in βc was found, which is supported by the almost overlapping cathodic branches in Fig. 8b. Evidently, SPRE hardly altered the hydrogen evolution reaction of C-steel in HCl solution at the elevated temperatures.
Table 3 Electrochemical kinetic parameters for C-steel in 1 M HCl solution with 800 mg L−1 SPRE at pre-set temperatures
| Temperature (K) |
Ecorr (V) |
icorr-P (mA cm−2) |
βa (mV dec−1) |
−βc (mV dec−1) |
| 298 |
−0.472 |
0.43 |
155.28 |
134.06 |
| 308 |
−0.489 |
0.59 |
154.08 |
131.85 |
| 318 |
−0.497 |
0.85 |
143.91 |
133.92 |
| 328 |
−0.516 |
1.01 |
140.27 |
134.47 |
3.3.2 Electrochemical impedance spectroscopy. The impedance characteristics of C-steel in 1 M HCl solution with 800 mg L−1 SPRE at different temperatures were also evaluated, as shown in Fig. 9. As is evident in Fig. 9a, all the Nyquist spectra exhibit a semi-circle shape at different temperatures, revealing a similar corrosion mechanism (i.e., controlled by charge transfer process) for C-steel in the corrosive medium.16 However, the diameter of the high-frequency loop shrunk with an increase in temperature, and a noteworthy inductive loop emerged in the spectra acquired at 318 and 328 K. This signifies a decrease of Rct with an increase in temperature. In addition, at high temperatures, the aggravated adsorption/desorption relaxation of the corrosion products and/or H2 at the steel/electrolyte interface result in the appearance of low-frequency inductance.27 The decay of Rct with an increase in temperature is also evidenced by the Bode plots, as shown in Fig. 9b. The low-frequency resistance decreased with an increase in temperature, arising from the deteriorated adsorption layer. Accordingly, the maximum phase angle gradually decreased and the phase angle peak shifted toward the high-frequency direction as the temperature increased, indicating a reduction in the anticorrosive efficacy of SPRE at relatively high temperatures.
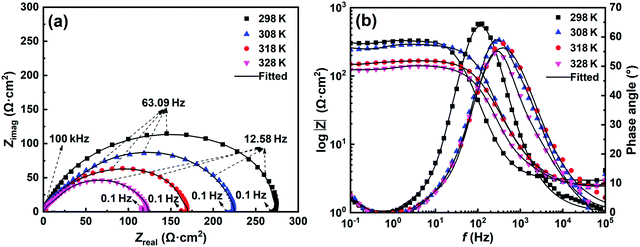 |
| | Fig. 9 Nyquist (a) and Bode (b) plots of C-steel in 1 M HCl solution with 800 mg L−1 SPRE at pre-set temperatures. | |
The equivalent circuits depicted in Fig. 6 were also employed to fit the EIS spectra for C-steel in HCl solution at the desired temperatures. Particularly, Fig. 6a was utilized to fit the data obtained at 318 and 328 K, while Fig. 6b was suitable for the other spectra. The fitted results are listed in Table 4. The low magnitude of the χ2 values and almost uniform value of Rs signify the validity of the fitting procedure.40 As expected, Rct monotonously decreased from 275.91 Ω cm2 at 298 K to 122.56 Ω cm2 at 328 K as the temperature increased. High temperature caused partial desorption of the weakly bonded SPRE from the C-steel surface, impairing the compactness and homogeneity of the barrier layer. Ultimately, the Rct value was moderately reduced with an increase in temperature. In addition, Cdl increased from 75.27 μF cm−2 at 298 K to 97.04 μF cm−2 at 328 K with an increase in temperature. According to the relationship expressed in eqn (6), the partial desorption of SPRE increased the local dielectric constant (ε) and decreased the thickness of double layer, which led to an enhanced Cdl value. Due to the deteriorated SPRE adsorption layer caused by high temperature, n gradually deviated from unity.
Table 4 Impedance parameters for C-steel in 1 M HCl solution with 800 mg L−1 SPRE at pre-set temperatures
| Temperature (K) |
Rs (Ω cm2) |
Rct (Ω cm2) |
CPE |
χ2 (×10−4) |
| Cdl (μF cm−2) |
n |
| 298 |
2.11 |
275.91 |
75.27 |
0.96 |
3.13 |
| 308 |
1.98 |
221.71 |
86.43 |
0.87 |
9.06 |
| 318 |
2.63 |
169.18 |
93.18 |
0.83 |
2.37 |
| 328 |
2.37 |
122.56 |
97.04 |
0.78 |
1.42 |
3.3.3 Electrochemical frequency modulation. The electrochemical kinetics was further evaluated using the EFM technique to establish the effect of temperature on the anticorrosion capacity of SPRE. Fig. S3† (ESI) illustrates the EFM spectra for C-steel in 1 M HCl solution with 800 mg L−1 SPRE at different temperatures, and the kinetic parameters, namely, icorr-E, CF2 and CF3, were fitted via the activation-controlled model and are displayed in Fig. 10. As can be seen, both the CF2 and CF3 values are in the vicinity of the corresponding ideal values (i.e., 2 and 3, respectively) at different temperatures, implying the acceptable accuracy of the EFM data. The increase in temperature mildly shifted icorr-E from 0.63 mA cm−2 at 298 K to 1.37 mA cm−2 at 328 K. Thus, SPRE effectively covers most of the active sites on the C-steel surface through adsorption at relatively low temperatures; on the contrary, an increase in temperature adversely affects the adsorption and the ensuing anticorrosion capability of SPRE for C-steel in HCl solution.
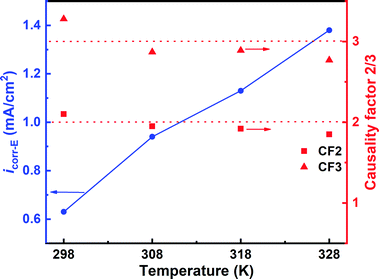 |
| | Fig. 10 Kinetic parameters derived from the EFM spectra for C-steel in 1 M HCl solution with 800 mg L−1 SPRE at pre-set temperatures. | |
In summary, the results of the potentiodynamic polarization, EIS and EFM are consistent at the pre-set temperatures. Although an increase in temperature is detrimental for the anticorrosion efficiency, the electrochemical kinetic and impedance parameters of the inhibited system with the optimal SPRE concentration are still superior compared to that of the blank control. As supported by the outcomes of the dynamic weight loss method, it is reasonable to conclude that SPRE can be deemed an efficient corrosion inhibitor for C-steel in HCl solution.
3.4 Surface analysis
Fig. 11 presents the surface analyses of C-steel after 24 h immersion in 1 M HCl solution without and with 800 mg L−1 SPRE at the highest pre-set temperature (328 K). For comparison, the results of freshly polished C-steel are also displayed in Fig. 11a, which possesses a hydrophilic surface with a contact angle of 47.1°. The relatively flat topography in Fig. 11d for the polished specimen presents a low average roughness (ra) of 106 nm. A severely corroded appearance can be observed in Fig. 11b, revealing the deterioration of the C-steel surface caused by the continuous attack of the corrosive solution. Accordingly, an extremely rugged topography can be observed in Fig. 11e, yielding a substantially increased ra (737 nm). Owing to the corroded surface, the water contact angle of the uninhibited specimen decreased to 15.3°. In contrast to Fig. 11b, the minimal morphological variation can be seen in Fig. 11c for C-steel after 24 h immersion in the inhibition solution. Besides, the partial scratches caused by mechanical polishing can be clearly distinguished. An elevated water contact angle (52.9°) was obtained for the sample after immersion in HCl solution with 800 mg L−1 SPRE due to the adsorption of the inhibitor. This intuitively indicates that the adsorption of SPRE isolated C-steel from direct contact with the aggressive species, and thus mitigated the dissolution of C-steel in the corrosive medium. The favorable protection capacity of SPRE resulted in a slight increase in ra (281 nm, Fig. 11e) compared to that in Fig. 11d.
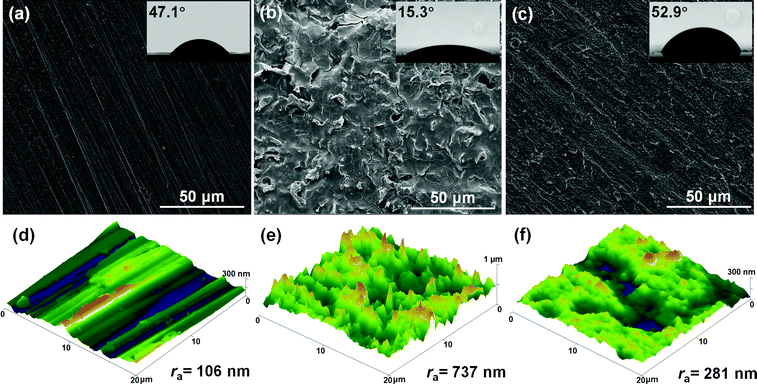 |
| | Fig. 11 Surface morphologies (a–c), wettability (inset) and topographies (d–f) of freshly polished C-steel specimen (left), specimen after 24 h immersion in 1 M HCl solution without (middle) and with 800 mg L−1 SPRE (right) at 328 K. | |
3.5 Adsorption isotherm and thermodynamic parameters
Considering that the anticorrosive effect of SPRE arises from efficient adsorption, several isotherms such as the Langmuir, Freundlich, Temkin and Flory–Huggins models were evaluated to clarify the nature of the interaction between SPRE and the C-steel surface. Notably, ηw acquired from the weight loss measurements was employed to calculate the surface coverage (θ) as follows:
Among the tested isotherms, the Langmuir model yielded the best fit (Fig. 12a), which can be expressed by the equation:
| |
 | (8) |
where
CSPRE (mg L
−1) is the concentration of SPRE, and
Kads is the adsorption equilibrium constant. As shown in
Fig. 12a, the regression coefficients (
r2) close to unity imply the validity and feasibility of the Langmuir isotherm.
35 Furthermore, the best fit of the Langmuir model also reveals that the active sites on the metal surface are energetically equivalent, and the adsorption of SPRE follows monolayer adsorption.
47 Kads provides the adsorption strength for the inhibitor on the metal surface, which can be derived from the intercept of the fitted lines in
Fig. 12a. Moreover, the thermodynamic parameters for SPRE adsorption, including the standard Gibbs free energy (Δ
Gads, kJ mol
−1), change in enthalpy (Δ
Hads, kJ mol
−1) and entropy (Δ
Sads, J (mol K)
−1), were obtained using the following expression:
48| |
ΔGads = −RT![[thin space (1/6-em)]](https://www.rsc.org/images/entities/char_2009.gif) ln(1000·Kads) = ΔHads − TΔSads ln(1000·Kads) = ΔHads − TΔSads
| (9) |
where
R is the universal gas constant;
T is the temperature in Kelvin; and 1000 (mg L
−1) denotes the mass concentration of water. Based on the relationship between Δ
Gads and
T, a linear fit was obtained, as shown in
Fig. 12b, from which the Δ
Hads and Δ
Sads values were acquired. The calculated Δ
Gads values are −25.32, −25.53, −25.99, and −26.40 kJ mol
−1 for SPRE adsorption on C-steel surface at 298, 308, 318 and 328 K, respectively. The negative sign of Δ
Gads signifies that SPRE spontaneously adsorbs on the C-steel surface.
49 Generally, physisorption (electrostatic interaction) of an inhibitor on a metal surface is identified when Δ
Gads is over −20 kJ mol
−1, while it can be considered as chemisorption (involving charge transfer) when Δ
Gads is more negative than −40 kJ mol
−1.
50 Particularly, the obtained Δ
Gads values are in the range of −20 and −40 kJ mol
−1, revealing that the adsorption of SPRE on the C-steel surface involves both physisorption and chemisorption.
3 Further inspection of Δ
Gads indicates that the absolute value increases with an increase in temperature. This may be attributed to the enhanced bonding strength due to the chemisorption moiety of SPRE on the C-steel surface.
51 However, as evidenced by the weight loss and electrochemical measurements, a small quantity of physically adsorbed SPRE may be detached from the metal surface at high temperatures, which generates a value of Δ
Gads close to −20 kJ mol
−1.
37 The Δ
Hads value was calculated to be −14.23 kJ mol
−1, indicating an exothermic process for SPRE adsorbed on the C-steel surface. Keleş
et al.52 also observed the physicochemical adsorption of an inhibitor on the surface of steel, with the absolute Δ
Hads value ranging from 10 to 140 kJ mol
−1. A positive value of Δ
Sads (37.38 J (mol K)
−1) was found for the adsorption process. As is known, Δ
Sads can be roughly deemed as the algebraic sum of the contributions from inhibitor adsorption and desorption of water molecules.
50 Therefore, the positive Δ
Sads reveals that the regularity of the assembled SPRE constituents is inferior to the irregularity caused by the desorption water molecules. Furthermore, the negative Δ
Hads and positive Δ
Sads are typical characteristics for a spontaneous reaction,
29 which are consistent with the analysis of Δ
Gads.
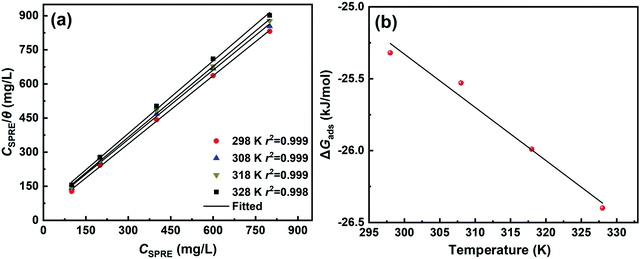 |
| | Fig. 12 Langmuir isotherms at pre-set temperatures (a) and plot of ΔGads versus temperature (b) for SPRE adsorbed on C-steel surface. | |
3.6 Corrosion kinetic parameters
The corrosion kinetics of C-steel in 1 M HCl solution without and with SPRE was also clarified by probing the activation parameters. The corrosion process for metals in aggressive media can be described by the Arrhenius and transition state equations as follows:| |
 | (10a) |
| |
 | (10b) |
where v (mm/a) is the corrosion rate obtained from the weight loss method; A is the pre-exponential factor; Ea (kJ mol−1) is the apparent activation energy representing the minimum energy to overcome the barrier for initiating corrosion; N is Avogadro's number; ℏ is Planck's constant; ΔH* (kJ (mol K)−1) is the activation enthalpy and ΔS* (J (mol K)−1) is the activation entropy. Fig. 13a and b display the Arrhenius and transition state plots for C-steel in HCl solution without and with different concentrations of SPRE, and the relevant kinetic parameters are compiled in Table 5. As observed, an increase in A occurred with an increase in the concentration of SPRE, indicating that adsorption was dominant, rather than desorption of the inhibitor on the C-steel surface.53 The value of Ea was 58.89 kJ mol−1 for the uninhibited system, which is similar to the previously reported eigenvalue.52 By contrast, Ea increased as the SPRE concentration increased, and reached 88.92 kJ mol−1 with 800 mg L−1 SPRE. The increase in Ea may be correlated with the initial physical adsorption, and subsequent chemisorption of SPRE on the C-steel surface. Moreover, the high Ea value indicates that the deterioration of the surface was kinetically hindered by the insulating adsorption layer.7 The positive sign of ΔH* for the system without and with SPRE coincides well with the endothermic nature of C-steel dissolution in acidic media.54 Besides, the consistent variation in Ea and ΔH* agrees with the correlated expression (ΔH* = Ea − RT). The negative sign of ΔS* in the uninhibited and inhibited systems reveals that the formation of the activated complex during the adsorption of SPRE in the rate-determining step involves association rather than dissociation.55 Notably, the decrease in ΔS* with an increase in the concentration of SPRE verifies that an ordered state of the system was progressively established due to the well-aligned adsorption of the inhibitor molecules.56
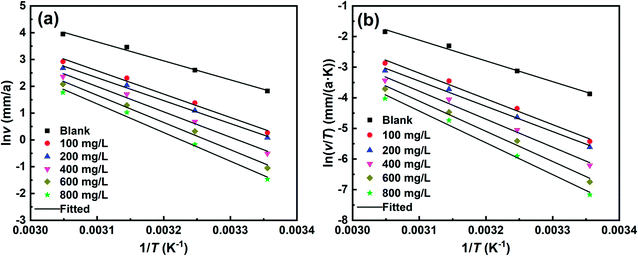 |
| | Fig. 13 Arrhenius (a) and transition state (b) plots for C-steel in 1 M HCl solution without and with different concentrations of SPRE. | |
Table 5 Kinetic parameters for C-steel in 1 M HCl solution without and with different concentrations of SPRE
| CSPRE (mg L−1) |
A |
Ea (kJ mol−1) |
ΔH* (kJ (mol K)−1) |
ΔS* (J (mol K)−1) |
| 0 |
25.62 |
58.89 |
56.29 |
−40.63 |
| 100 |
29.61 |
71.08 |
68.49 |
−33.22 |
| 200 |
28.83 |
72.47 |
69.88 |
−22.41 |
| 400 |
31.29 |
78.57 |
75.97 |
−13.95 |
| 600 |
33.20 |
84.57 |
81.97 |
−7.47 |
| 800 |
34.51 |
88.92 |
86.32 |
−6.52 |
3.7 Theoretical simulation
3.7.1 DFT calculation. It has been established that the anticorrosive potency of an inhibitor is strictly related to its global and local reactive descriptors.8 Hence, multi-scale calculations were performed to shed further light on the protective mechanism of the specific constituents in SPRE for C-steel in 1 M HCl solution. Noteworthily, a microspecies analysis should be preferentially performed before the formal DFT calculations, and subsequently, the specific molecular state clarified for each constituent of SPRE in the acidic medium. Fig. S4† (ESI) shows the results of the microspecies analyses for CTM, ATC, ATA and CCA at the full pH range. Obviously, the four constituents maintain the neutral state at pH = 1 (theoretical value of the employed medium), indicating that the harsh acidic medium may not be detrimental to the chemical state of the SPRE constituents. Consequently, neutral CTM, ATC, ATA and CCA were utilized to complete the DFT calculations. In addition, the ion–dipole interaction between the target inhibitor and water molecules was considered by implementing the dominant solvent model; thereupon, the calculated descriptors accurately reflect the electron-structure properties.Fig. 14 displays the global reactive descriptors of the four constituents under the dominant solvent model, namely, the optimized configuration, HOMO, LUMO and ESP. According to the frontier molecular orbital theory,48 the HOMO contour indicates the electron donation region, while the LUMO reflects the electron acceptance capacity of a compound using the anti-bond orbital. For the ground-state configuration of CTM (Fig. 14a1), both the HOMO (Fig. 14b1) and LUMO (Fig. 14c1) are distributed along the phenol, conjugated double bonds and quinone moieties, which may be the pronounced active region for reacting with the metal surface. The ESP mapping of CTM, as shown in Fig. 14d1, disclosed that most of the molecular surface is slightly positively charged and only small portion, i.e., hydroxyls on the tetrahydropyran moiety, is negatively charged. In the case of ATC, both the HOMO (Fig. 14b2) and LUMO (Fig. 14c2) are spread over the main molecular backbone except the hydroxyl-substituted pyran ring. The ESP mapping given in Fig. 14d2 reveals that the negative charge is concentrated on the phenol portion, while the other part of ATC is positively charged. In Fig. 14b3, the HOMO of ATA is mainly distributed on the pyrone and anisole moieties, and the distribution of the LUMO, as shown in Fig. 14c3, transfers to the pyrone and phenol parts. It can be seen in Fig. 14d3 that the negative charge is concentrated on the carbonyl group and positive charge is located on most of the molecular surface of ATA. In the case of CCA, the HOMO distribution, as shown in Fig. 14b4, is delocalized along the whole backbone, whereas the LUMO is primarily concentrated on the catechol moiety.
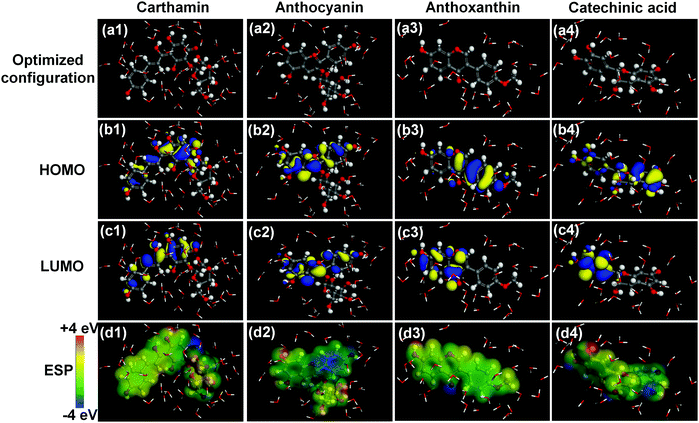 |
| | Fig. 14 Optimized configuration (a1–a4), HOMO (b1–b4), LUMO (c1–c4) and ESP mapping (d1–d4) of the different constituents in SPRE. | |
As evidenced by other reports,8,26,32 the concentrated distribution of the frontier orbitals (CTM and ATC) is conductive for the rapid charge interaction of an inhibitor with the metal surface; meanwhile, the polarized distribution of the frontier orbitals (ATA and CCA) favors the parallel adsorption configuration of an inhibitor. Furthermore, the four SPRE constituents exhibit a surface electron density with a prominent positive charge; consequently, these molecules preferentially adsorb on the C-steel surface via the binding bridge with pre-adsorbed chloride ions (i.e., physisorption).34 Although the electrostatic interaction between SPRE and the C-steel surface results in rapid corrosion mitigation, the adsorption strength of partial molecules may be unsatisfactory. This explains the desorption behavior of SPRE at high temperatures observed in the weight loss, electrochemical and thermodynamic analyses.
Local reactive descriptors, i.e., Fukui indices (fk+ and fk−), were also acquired to in detail to survey the specific adsorption sites. As the first derivative of electronic density against total electron numbers, fk+ and fk− can be expressed as follows:48
| | |
fk+ = qk(M + 1) − qk(M) nucleophilic attack
| (11a) |
| | |
fk− = qk(M) − qk(M − 1) electrophilic attack
| (11b) |
where
qk(
M + 1),
qk(
M) and
qk(
M − 1) are the atomic charge of atom k in the
M + 1,
M and
M − 1 electron systems, respectively. Considering the symmetry of electron spin, an atom can simultaneously gain nucleophilic and electrophilic propensities.
53 Thereby, the dual Fukui descriptor (Δ
fk) was employed herein to elucidate the primary local activity for SPRE, which can be defined as follows:
57
According to the basic concept, a positive Δfk denotes that an atom behaves as an electrophilic center, while a negative value denotes that an atom acts as a nucleophilic center. After comparing the projected fk+ and fk− shown in Fig. 15b1–b4 and c1–c4, the values of Δfk for the condensed atoms on CTM, ATC, ATA and CCA were calculated, as illustrated in Fig. 15d1–d4, respectively.
In Fig. 15d1, C8, C10, C12 and O21 on the quinone ring and C17 on phenol ring of CTM exhibit predominantly nucleophilic capacity, which mainly accept electrons escaped from the C-steel surface. C15, C17–18 and O16 on the conjugated system are the electrophilic center for donating electrons to the empty 3d hybrid orbitals of the Fe atom. The reactive centers for electron-donation and acceptance of CTM coincide well with its concentrated distribution of HOMO and LUMO displayed in Fig. 14. For the Δfk of ATC given in Fig. 15d2, C1, C4–5, C12–13 and O6 have negative values, implying the nucleophilic reaction tendency; by contrast, C2–3, C11 and C14 own positive values, corresponding to electrophilic activity. Similar to the HOMO and LUMO distributions, the local reactive sites of ATC are also spread over its main backbone except the hydroxyl-substituted pyran moiety. As shown in Fig. 15d3, the nucleophilic and electrophilic sites on ATA are distributed separately on its two terminals. In detail, the Δfk values of C1–3, C5–7, C9, O10–11 and O18 are positive, corresponding with the electrophilic reaction, which are consistent with the electron donation (HOMO) region of ATA depicted in Fig. 14b3. Meanwhile, C12–17 and O19 have negative Δfk values (nucleophilic reactivity of electron acceptance), which are also in accord with the LUMO distribution of ATA shown in Fig. 14c3. For the Δfk of CCA in Fig. 15d4, C1–6, O10–13 and O20 are the significant centers for nucleophilic attack (electron acceptance), while C14–15 and C17–18 are deemed as the active sites for the electrophilic center (electron donation). As expected, the region of reactive centers for CCA agree well with its HOMO and LUMO distributions.
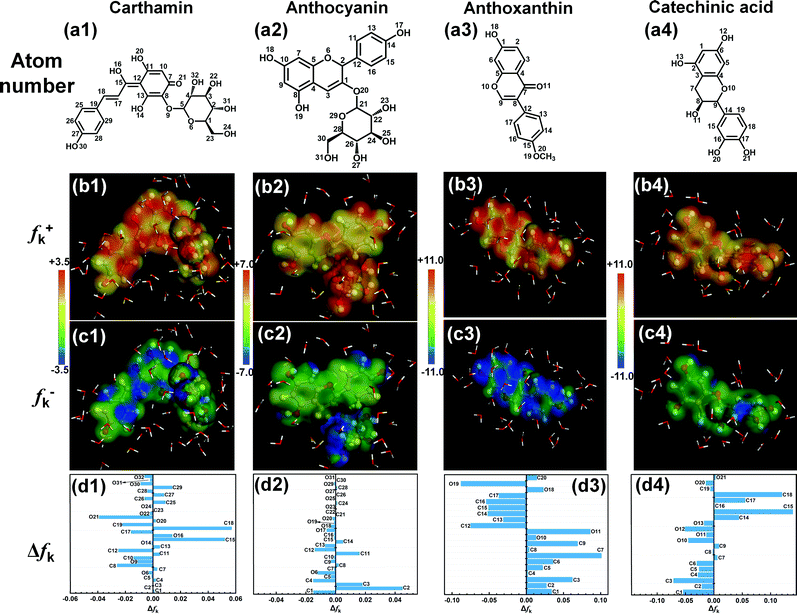 |
| | Fig. 15 Atom number (a1–a4), project of Fukui indices for nucleophilic (fk+, b1–b4) and electrophilic (fk−, c1–c4) centers on total electron density together with the values of Δfk (d1–d4). | |
Further, the comparison of the Δfk values for the different SPRE constituents in Fig. 15d1–d4 indicates that the magnitudes of the local electron densities for ATA and CCA are larger than that for CTM and ATC. Therefore, ATA and CCA may be more favorable to interact with the Fe atoms, and subsequently, the formation of stable adsorption layers on the C-steel surface.
3.7.2 Molecular dynamics simulation. The adsorption processes of CTM, ATC, ATA and CCA on the Fe (100) plane were simulated on the atomic scale to elucidate their interaction mechanism. Fig. S5 (ESI†) presents the equilibrium of temperature and energies as a function of time for the different constituents. Clearly, all the systems can be regarded as essentially stable during the simulation process. The final snapshots for the adsorption of the different constituents on the Fe (100) plane in the top and side views are shown in Fig. 16. In a general view, CTM, ATC, ATA and CCA are inclined to adsorb on the Fe (100) plane in a parallel manner, as displayed in Fig. 16a1, b1, c1 and d1, respectively. Adsorption following the parallel orientation favors the inhibitor to cover the exposed anodic and/or cathodic sites on metal surface to the utmost extent.9 Particularly, some hydroxyls on the pyran ring of CTM project outward into the bulk solution (Fig. 16a1), which may be ascribed to its inertia, as hinted by the global and local quantum chemical descriptors (Fig. 14 and 15). Additionally, the stable chair conformation of the pyran structure also drives certain substituents to be detached away from the Fe (100) surface.58 Similarly, in Fig. 16b1, the hydroxyl-substituted pyran moiety on ATC hardly contacts the iron surface. On the contrary, for the adsorption of ATA and CCA shown in Fig. 16c1 and d1, respectively, a nearly flat configuration can be observed for both constituents. The separated distribution of frontier molecular orbits and local reactive sites should account for the parallel adsorption of ATA and CCA on the Fe (110) surface.36
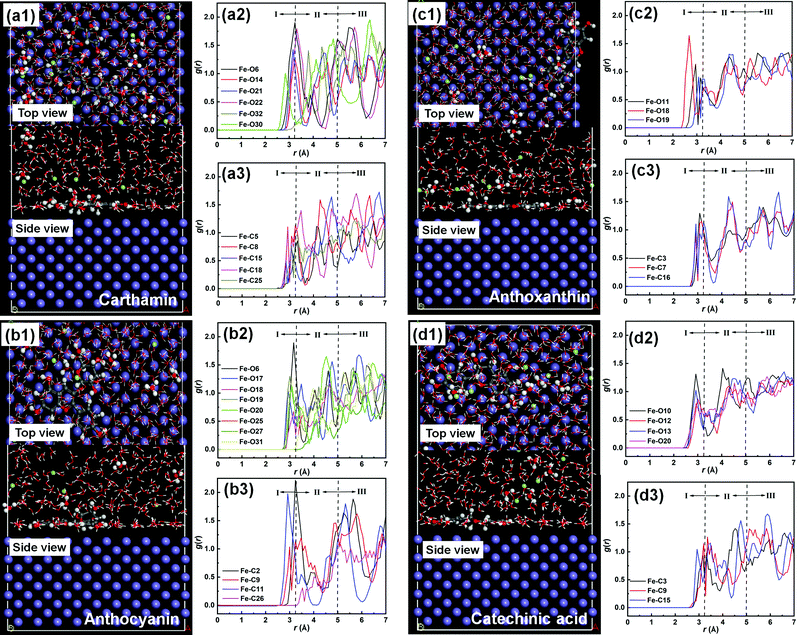 |
| | Fig. 16 Equilibrium configurations in the top and side snapshots of the main constituents in SPRE adsorbed on the Fe (100) plane (a1, b1, c1 and d1) together with the corresponding radial distribution functions for the typical Fe–O (a2, b2, c2 and d2) and Fe–C (a3, b3, c3 and d3) interactions. | |
The radial distribution function (RDF), as defined by Hansen and McDonald,57 was introduced to distinguish the specific interaction strength between the reactive sites on the SPRE constituents and Fe (100) plane, which can be described as follows:
| |
 | (13) |
where 〈
ρB〉
loc denotes the probability density of particle B averaged over all shells around particle A. The typical condensed atoms (
i.e., active C and O) on the four constituents were selected to complete the RDF analysis, and the results are summarized in
Fig. 16a2, a3, b2, b3, c2, c3, d2 and d3. Notably, a series of interaction peaks emerged in the RDF curves, indicating the unoriented adsorption of SPRE on the Fe (100) plane.
59 As is known, a chemical or hydrogen bond can be confirmed as the initial RDF peak up to 3.2 Å, strong physical interaction occurs for an initial peak located between 3.2 and 5.0 Å, and weak van der Waals force corresponds to an initial RDF peak over 5.0 Å.
60 The bond lengths of Fe–O6, Fe–O14, Fe–O21 and Fe–O30 shown in
Fig. 16a2 are less than 3.2 Å, revealing that the relevant heteroatoms on CTM chemically adsorb on the iron surface. However, the first RDF peaks for Fe–O22 and Fe–O32 are identified in the region of strong physical interaction, which suggests the physisorption nature of the hydroxyls grafted on the pyran ring. Accordingly, C5 on pyran ring exhibits the physical interaction, as presented in
Fig. 16a3, for the large bond length (over 3.2 Å). In contrast, the C atoms (C8, C15, C18 and C25) in the vicinity of the strongly bonded O heteroatoms also possess bond lengths of less than 3.2 Å with the Fe atoms. Referring to the RDF results for ATC (
Fig. 16b2–b3), chemisorption is preferred for the typical O heteroatoms (O6 and O17–20) except those on the hydroxyls grafted on the pyran ring (O25, O27 and O31). The adjacent C2, C9 and C11 on ATC also tend to be chemically bonded on the iron surface, with their initial RDF peaks emerging with a distance of up to 3.2 Å. By comparison, the first RDF peak of Fe–C26 lies between 3.2 and 5.0 Å, implying the physisorption of a partial pyran ring on the Fe (100) plane. The RDF results for the adsorption processes of CTM and ATC indicate that the pyran moiety on their structures inferiorly contributes to the firm bonding of their molecules on the Fe (100) surface.
The RDF analyses for ATA adsorption on the Fe (100) plane are shown in Fig. 16c2 and c3. It can be deduced from Fig. 16c2 that the bond lengths between the typical O heteroatoms (O11 and O18–19) and Fe atom are all less than 3.2 Å. Similarly, for the typical C atoms on ATA, the initial RDF peaks of Fe–C3, Fe–C7 and Fe–C16 are located with a distance of up to 3.2 Å. These results feature the strong anchoring of ATA on the Fe (100) plane, resulting from its parallel adsorption orientation. Fig. 16d2 and d3 illustrate the RDF curves for CCA adsorption on the iron surface focusing on the O and C atoms, respectively. Similar to that of ATA, the typical O (O10, O12–13 and O20) and C (C3, C9 and C15) atoms exhibit a chemisorption propensity on the Fe (100) surface given that all the initial RDF peaks are up to 3.2 Å. Therefore, CCA is also firmly anchored on the iron surface via chemisorption. Moreover, the intensified bonding sites for ATA and CCA toward Fe atoms are consistent with the analyses of the quantum chemical descriptors in Fig. 14 and 15, in which ATA and CCA possess symmetric or uniform reactive sites, facilitating the parallel adsorption of the inhibitor on the C-steel surface.
To quantitatively clarify the adsorption strength, the interaction (Einter) and binding (Ebind) energies of the four constituents adsorbed on the Fe (100) plane were calculated according to the following equations:
| | |
Einter = Etotal − (Esurf+sol + Einh) = −Ebind
| (14) |
where
Etotal (kJ mol
−1) is the total energy of the system;
Esurf+sol (kJ mol
−1) is the energy of the Fe (100) plane and solution; and
Einh (kJ mol
−1) is the energy of the specific constituent. The acquired
Einter and
Ebind values are tabulated in
Table 6. It is noteworthy that the adsorption of SPRE on the C-steel surface requires the initially existing water molecules to be replaced with time as follows:
| | |
SPREsol + xH2Oads → SPREads + xH2Osol
| (15) |
where
x is the number of replaced water molecules. It has been reported that
Ebind of a single water molecule on the Fe (100) surface reaches 24.64 kJ mol
−1.
33 Hence, the binding energy (
Ewater-equiv.) of the molecular weight-equivalent water molecules on the Fe (100) plane for each SPRE constituent is also given in
Table 6 for comparison. Negative values of
Einter were obtained for the SPRE constituents, implying that the adsorption of the four substances on the Fe (100) surface is spontaneous. This coincides well with the thermodynamic analysis in Section 3.5. High
Ebind values of 1688.16, 1593.07, 1518.55 and 1499.71 kJ mol
−1 were observed for CTM, ATC, ATA and CCA, respectively, which are greater than the corresponding
Ewater-equiv. values. Consequently, water molecules can be readily displaced by the four SPRE constituents on the C-steel surface. Another aspect deserving attention is that the
Ebind values of CTM and ATC are comparable with that of ATA and CCA, albeit the former compounds possess a higher molecular weight and surface area. The inadequate parallel adsorption of CTM and ATC may be responsible for their inappropriate
Ebind values. On the contrary, the comparable
Ebind values indirectly confirm the strong adsorption of ATA and CCA on the C-steel surface.
Table 6 Interaction and binding energies of main constituents in SPRE adsorbed on the Fe (100) plane together with the equivalent interaction energies of water molecules
| Constituent |
Einter (kJ mol−1) |
Ebind (kJ mol−1) |
Ewater-equiv. (kJ mol−1) |
| CTM |
−1688.16 |
1688.16 |
616.55 |
| ATC |
−1593.07 |
1593.07 |
594.65 |
| ATA |
−1518.55 |
1518.55 |
367.23 |
| CCA |
−1499.71 |
1499.71 |
397.35 |
3.8 Corrosion inhibition mechanism of SPRE
According to the aforementioned experimental and theoretical analyses, the proposed corrosion inhibition mechanism of SPRE for C-steel in 1 M HCl solution is illustrated in Fig. 17. As is known, Cl− can adsorb on the metal surface upon the immersion of C-steel in HCl solution, resulting in a negatively charged layer.33 Precisely, electrostatic attraction drives CTM, ATC, ATA and CCA to migrate from the bulk solution toward the steel surface due to their moderately positive charged surface. Meanwhile, by virtue of their high molecular weight and affinity, the SPRE constituents repel the pre-adsorbed water molecules and corrosive species, and ultimately adsorb on the C-steel surface, shielding both the cathodic and anodic sites. In particular, the CTM and ATC compounds possess a pyran structure, which favors the chair conformation in the ground state. Thus, this moiety hardly poses a strong interaction with the C-steel surface due to its spatial orientation (i.e., physisorption). However, on the other parts of CTM and ATC molecules, the O heteroatoms and conjugated system can donate lone pair electrons to the unoccupied d-orbit of the Fe atom; simultaneously, the electron-deficient region (e.g., aromatic ring) accepts electrons escaping from the metal surface via back-donation. Consequently, chemisorption via charge transfer occurs between the reactive regions of CTM and ATC. It is probably due to the weak adsorption portion that the desorption phenomenon was observed experimentally for SPRE at a high temperature. On the contrary, the consecutive distribution of reactive sites over the whole backbone of ATA and CCA resulted in their parallel adsorption configuration with strong binding energy, which can cover most of the active regions on the C-steel surface. Owing to the effective adsorption of SPRE, the corrosion rate of C-steel is prominently decelerated in HCl solution. Compared with other polyphenol-/flavonoid-based phytochemicals reported in the literature (summarized in Table S2, ESI†), the corrosion inhibition efficiency of SPRE is superior for C-steel in acidic medium. Consequently, SPRE can be reasonably deemed an efficient corrosion inhibitor for C-steel in HCl solution.
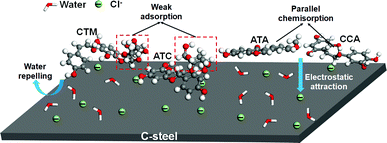 |
| | Fig. 17 Corrosion inhibition mechanism of the constituents of SPRE for C-steel in 1 M HCl solution. | |
4. Conclusions
The active components of SPRE, namely carthamin (CTM), anthocyanin (ATC), anthoxanthin (ATA) and catechinic acid (CCA), were evaluated as efficient corrosion inhibitors for C-steel in 1 M HCl solution through experimental and theoretical approaches. The main conclusions are as follows.
● Dynamic weight loss measurements indicated that the anticorrosion effect of SPRE was concentration- and temperature-dependent, where an increase in the concentration of SPRE favored the corrosion inhibition efficacy at a constant temperature; on the contrary, an increase in temperature impaired the anticorrosive effect with a fixed inhibitor concentration. The ηw value reached 96.2% for C-steel in HCl solution with 800 mg L−1 SPRE at 298 K.
● The presence of SPRE enhanced Eocp and simultaneously restrained the anodic and cathodic reactions on the C-steel surface, which could be categorized as a mixed-type inhibitor with a predominant anodic effect. The icorr-P value decreased with an increase in the concentration of SPRE, similar to the variation in icorr-E. The Rct value at the steel/electrolyte interface progressively increased as the SPRE concentration increased together with an attenuated Cdl value due to inhibitor adsorption.
● SPRE spontaneously adsorbed on the C-steel surface following the Langmuir isotherm, which was deemed physicochemical adsorption. Analysis of the global and local reactive descriptors disclosed that the hydroxyl-substituted pyran ring may hardly be involved in the chemisorption of CTM and ATC on the C-steel surface; in contrast, all the condensed atoms on ATA and CCA seemed to exhibit strong binding with the Fe atoms. Owing to the inert nature of the pyran moiety, CTM and ATC exhibited an imperfect parallel orientation adsorbed on the Fe (100) plane; while a parallel adsorption configuration was featured for ATA and CCA on the metal surface.
Conflicts of interest
There are no conflicts to declare.
Acknowledgements
This work was supported by Beijing Municipal Natural Science Foundation (2192016), National Natural Science Foundation of China (21606005), Support Project of High-level Teachers in Beijing Municipal Universities in the Period of 13th Five-year Plan (CIT&TCD201904042).
References
- M. E. H. Naghi Tehrani, P. Ghahremani, M. Ramezanzadeh, G. Bahlakeh and B. Ramezanzadeh, J. Environ. Chem. Eng., 2021, 9, 105256 CrossRef CAS.
- M. H. Shahini, M. Ramezanzadeh, G. Bahlakeh and B. Ramezanzadeh, J. Mol. Liq., 2021, 332, 115876 CrossRef CAS.
- T. W. Quadri, L. O. Olasunkanmi, E. D. Akpan, A. Alfantazi, I. B. Obot, C. Verma, A. M. Al-Mohaimeed, E. E. Ebenso and M. A. Quraishi, RSC Adv., 2021, 11, 2462–2475 RSC.
- X. Li, D. Zhang, Z. Liu, Z. Li, C. Du and C. Dong, Nature, 2015, 527, 441–442 CrossRef CAS PubMed.
- B. M. Fan, H. Hao, A. R. Guo and R. P. Yang, J. Water Reuse Desalin., 2016, 6, 399–412 CrossRef CAS.
- S. Z. Salleh, A. H. Yusoff, S. K. Zakaria, M. A. A. Taib, A. Abu Seman, M. N. Masri, M. Mohamad, S. Mamat, S. Ahmad Sobri, A. Ali and P. T. Teo, J. Cleaner Prod., 2021, 304, 127030 CrossRef CAS.
- A. Nahle, R. Salim, F. El Hajjaji, M. R. Aouad, M. Messali, E. Ech-chihbi, B. Hammouti and M. Taleb, RSC Adv., 2021, 11, 4147–4162 RSC.
- C. T. Ser, P. Žuvela and M. W. Wong, Appl. Surf. Sci., 2020, 512, 145612 CrossRef.
- Y. C. Ma, B. M. Fan, H. Hao, J. Y. Lu, Y. H. Feng and B. Yang, Chem. J. Chin. Univ., 2019, 40, 96–107 CAS.
- S. A. Umoren, M. M. Solomon, I. B. Obot and R. K. Suleiman, J. Ind. Eng. Chem., 2019, 76, 91–115 CrossRef CAS.
- S. H. Alrefaee, K. Y. Rhee, C. Verma, M. A. Quraishi and E. E. Ebenso, J. Mol. Liq., 2021, 321, 114666 CrossRef CAS.
- B. M. Fan, Z. Liu, X. Zhao, H. Liu, G. Fan and H. Hao, Colloids Surf., A, 2021, 629, 127434 CrossRef CAS.
- M. M. Solomon, S. A. Umoren, I. B. Obot, A. A. Sorour and H. Gerengi, ACS Appl. Mater. Interfaces, 2018, 10, 28112–28129 CrossRef CAS PubMed.
- R. Haldhar, D. Prasad, N. Mandal, F. Benhiba, I. Bahadur and O. Dagdag, Colloids Surf., A, 2021, 614, 126211 CrossRef CAS.
- A. Jmiai, A. Tara, S. El Issami, M. Hilali, O. Jbara and L. Bazzi, J. Mol. Liq., 2021, 322, 114509 CrossRef CAS.
- X. H. Li, S. D. Deng, G. B. Du and X. G. Xie, J. Taiwan Inst. Chem. Eng., 2020, 114, 263–283 CrossRef CAS.
- M. HosseinpourRokni, R. Naderi, M. Soleimani, A. R. Jannat, M. Pourfath and M. Saybani, J. Ind. Eng. Chem., 2021, 102, 327–342 CrossRef CAS.
- M. A. Benghalia, C. Fares, A. Khadraoui, M. H. Meliani, R. K. Suleiman, A. A. Sorour, I. M. Dmytrakh and Z. Azari, Environ. Eng. Manage. J., 2019, 18, 2009–2021 CrossRef CAS.
- A. Kouache, A. Khelifa, H. Boutoumi, S. Moulay, A. Feghoul, B. Idir and S. Aoudj, J. Adhes. Sci. Technol., 2021, 1–29, DOI:10.1080/01694243.2021.1956215.
- D. K. Verma, R. Aslam, J. Aslam, M. A. Quraishi, E. E. Ebenso and C. Verma, J. Mol. Struct., 2021, 1236, 130294 CrossRef CAS.
- N. Palaniappan, I. Cole, F. Caballero-Briones, S. Manickam, K. R. Justin Thomas and D. Santos, RSC Adv., 2020, 10, 5399–5411 RSC.
- A. Kokalj, M. Lozinšek, B. Kapun, P. Taheri, S. Neupane, P. Losada-Pérez, C. Xie, S. Stavber, D. Crespo, F. U. Renner, A. Mol and I. Milošev, Corros. Sci., 2021, 179, 108856 CrossRef CAS.
- N. Ratanasumarn and P. Chitprasert, Int. J. Biol. Macromol., 2020, 153, 138–145 CrossRef CAS PubMed.
- N. Asem, N. A. Abdul Gapar, N. H. Abd Hapit and E. A. Omar, J. Apic. Res., 2020, 59, 437–442 CrossRef.
- H. Liu, B. M. Fan, G. F. Fan, X. Q. Zhao, Z. N. Liu, H. Hao and B. Yang, J. Alloys Compd., 2021, 872, 159752 CrossRef CAS.
- H. Liu, B. M. Fan, G. F. Fan, Y. C. Ma, H. Hao and W. Zhang, J. Mater. Sci. Technol., 2021, 72, 202–216 CrossRef.
- G. F. Fan, H. Liu, B. M. Fan, Y. C. Ma, H. Hao and B. Yang, J. Mol. Liq., 2020, 311, 113302 CrossRef CAS.
- W. Zhao-yu, Z. Wen-jing, B. Yan-hong, C. Xue-wen, Y. Rong-ling and Z. Jun, Food Ferment. Technol., 2017, 55–59 Search PubMed.
- S. Abdelaziz, M. Benamira, L. Messaadia, Y. Boughoues, H. Lahmar and A. Boudjerda, Colloids Surf., A, 2021, 619, 126496 CrossRef CAS.
- M. Faiz, A. Zahari, K. Awang and H. Hussin, RSC Adv., 2020, 10, 6547–6562 RSC.
- B. M. Fan, H. Hao, B. Yang and Y. Li, Res. Chem. Intermed., 2018, 44, 5711–5736 CrossRef CAS.
- A. Farhadian, A. Rahimi, N. Safaei, A. Shaabani, E. Sadeh, M. Abdouss and A. Alavi, ACS Appl. Mater. Interfaces, 2021, 13, 3119–3138 CrossRef CAS PubMed.
- D. L. Wang, Y. M. Li, B. Chen and L. Zhang, Chem. Eng. J., 2020, 402, 126219 CrossRef CAS.
- A. E.-A. S. Fouda, S. A. Abd el-Maksoud, E. H. El-Sayed, H. A. Elbaz and A. S. Abousalem, RSC Adv., 2021, 11, 19294–19309 RSC.
- M. Abdallah, K. A. Soliman, A. S. Al-Gorair, A. Al Bahir, J. H. Al-Fahemi, M. S. Motawea and S. S. Al-Juaid, RSC Adv., 2021, 11, 17092–17107 RSC.
- Y. C. Ma, B. M. Fan, M. M. Wang, B. Yang, H. Hao, H. Sun and H. J. Zhang, Chem. J. Chin. Univ., 2019, 40, 1706–1716 CAS.
- A. Farhadian, A. Rahimi, N. Safaei, A. Shaabani, M. Abdouss and A. Alavi, Corros. Sci., 2020, 175, 108871 CrossRef CAS.
- A. E.-A. S. Fouda, S. A. Abd El-Maksoud, E. H. El-Sayed, H. A. Elbaz and A. S. Abousalem, RSC Adv., 2021, 11, 13497–13512 RSC.
- A. Dehghani, G. Bahlakeh and B. Ramezanzadeh, J. Hazard. Mater., 2020, 398, 122962 CrossRef CAS PubMed.
- K. R. Ansari, D. S. Chauhan, M. A. Quraishi, M. A. J. Mazumder and A. Singh, Int. J. Biol. Macromol., 2020, 144, 305–315 CrossRef CAS PubMed.
- U. Carragher and C. B. Breslin, Electrochim. Acta, 2018, 291, 362–372 CrossRef CAS.
- E. Berdimurodov, A. Kholikov, K. Akbarov, L. Guo, A. M. Abdullah and M. Elik, J. Mol. Liq., 2021, 328, 115475 CrossRef CAS.
- K. R. Ansari, D. S. Chauhan, M. A. Quraishi and T. A. Saleh, J. Colloid Interface Sci., 2020, 564, 124–133 CrossRef CAS PubMed.
- H. M. Elabbasy and H. S. Gadow, J. Mol. Liq., 2021, 321, 114918 CrossRef CAS.
- M. A. Mostafa, A. M. Ashmawy, M. A. M. A. Reheim, M. A. Bedair and A. M. Abuelela, J. Mol. Struct., 2021, 1236, 130292 CrossRef CAS.
- S. Pareek, D. Jain, S. Hussain, A. Biswas, R. Shrivastava, S. K. Parida, H. K. Kisan, H. Lgaz, I.-M. Chung and D. Behera, Chem. Eng. J., 2019, 358, 725–742 CrossRef CAS.
- K. A. Alamry, M. A. Hussein, A. Musa, K. Haruna and T. A. Saleh, RSC Adv., 2021, 11, 7078–7095 RSC.
- B. M. Fan, Y. C. Ma, M. M. Wang, H. Hao, B. Yang, J. Y. Lv and H. Sun, J. Mol. Liq., 2019, 292, 111446 CrossRef CAS.
- Y. C. Ma, B. M. Fan, T. T. Zhou, H. Hao, B. Yang and H. Sun, Polymers, 2019, 11, 635 CrossRef PubMed.
- K. Kousar, M. S. Walczak, T. Ljungdahl, A. Wetzel, H. Oskarsson, P. Restuccia, E. A. Ahmad, N. M. Harrison and R. Lindsay, Corros. Sci., 2021, 180, 109195 CrossRef CAS.
- L. O. Olasunkanmi and E. E. Ebenso, J. Colloid Interface Sci., 2020, 561, 104–116 CrossRef CAS PubMed.
- H. Keleş, M. Keleş and K. Sayın, Corros. Sci., 2021, 184, 109376 CrossRef.
- Y. C. Ma, T. T. Zhou, W. Q. Zhu, B. M. Fan, H. Liu, G. F. Fan, H. Hao, H. Sun and B. Yang, J. Mol. Model., 2020, 26, 81 CrossRef CAS PubMed.
- B. M. Fan, G. Wei, Z. Zhang and N. Qiao, Corros. Sci., 2014, 83, 75–85 CrossRef CAS.
- S. Varvara, G. Caniglia, J. Izquierdo, R. Bostan, L. Găină, O. Bobis and R. M. Souto, Corros. Sci., 2020, 165, 108381 CrossRef CAS.
- M. M. Wang, B. M. Fan, B. Y. Wen and C. Jiang, Sci. China Technol. Sci., 2020, 63, 2098–2112 CrossRef CAS.
- H. Lgaz, S. K. Saha, A. Chaouiki, K. S. Bhat, R. Salghi, Shubhalaxmi, P. Banerjee, I. H. Ali, M. I. Khan and I.-M. Chung, Constr. Build. Mater., 2020, 233, 117320 CrossRef CAS.
- D. W. Kang, D. K. Yoon and C. H. Kwon, Phys. Chem. Chem. Phys., 2020, 22, 27673–27680 RSC.
- R. Lotfi, M. Naguib, D. E. Yilmaz, J. Nanda and A. C. T. van Duin, J. Mater. Chem. A, 2018, 6, 12733–12743 RSC.
- Z. Wang, T. T. Wang, J. B. Zhu, L. P. Wei, Y. Z. Shen, N. Li and J. Hu, Colloids Surf., A, 2019, 563, 246–254 CrossRef CAS.
Footnotes |
| † Electronic supplementary information (ESI) available. See DOI: 10.1039/d1ra04976c |
| ‡ Siguang Meng and Zining Liu equally contributed to this paper. |
|
| This journal is © The Royal Society of Chemistry 2021 |
Click here to see how this site uses Cookies. View our privacy policy here.  Open Access Article
 *a,
Hao Liua,
Mao Guoa and
Hua Haob


![[double bond, length as m-dash]](https://www.rsc.org/images/entities/char_e001.gif) O on flavonoids can be identified at 1731 cm−1.2 While, another featured vibration for flavonoid is recognized at 1625 cm−1 (aromatic oxide).30 The peak located at 1415 cm−1 corresponds to the stretching vibration of C–O–C.1 The shoulder peak at 1053 cm−1 is the characteristic adsorption of the glycosidic structure.13 The presence of substituted glucopyranose is confirmed by the peaks at 923 and 870 cm−1.23 Closer inspection of the spectra in Fig. 2 reveals that both bathochromic and hypochromatic shifts occurred for the characteristic adsorption of SPRE compared to that of SPR. This may be due to the purification of the main constituents after ethanolic extraction. According to the FTIR analysis, the oxygen heteroatoms, aromatic rings and conjugated unsaturated bonds in SPRE can behave as active sites for adsorption on the C-steel surface, and thus inhibit dissolution of the metal in aggressive media.31
O on flavonoids can be identified at 1731 cm−1.2 While, another featured vibration for flavonoid is recognized at 1625 cm−1 (aromatic oxide).30 The peak located at 1415 cm−1 corresponds to the stretching vibration of C–O–C.1 The shoulder peak at 1053 cm−1 is the characteristic adsorption of the glycosidic structure.13 The presence of substituted glucopyranose is confirmed by the peaks at 923 and 870 cm−1.23 Closer inspection of the spectra in Fig. 2 reveals that both bathochromic and hypochromatic shifts occurred for the characteristic adsorption of SPRE compared to that of SPR. This may be due to the purification of the main constituents after ethanolic extraction. According to the FTIR analysis, the oxygen heteroatoms, aromatic rings and conjugated unsaturated bonds in SPRE can behave as active sites for adsorption on the C-steel surface, and thus inhibit dissolution of the metal in aggressive media.31
![[thin space (1/6-em)]](https://www.rsc.org/images/entities/char_2009.gif) f vs. log
f vs. log![[thin space (1/6-em)]](https://www.rsc.org/images/entities/char_2009.gif) |Z| approached −1 with an increase in the concentration of SPRE concentration, suggesting the favorable capacitive characteristic at the steel/electrolyte interface.38
|Z| approached −1 with an increase in the concentration of SPRE concentration, suggesting the favorable capacitive characteristic at the steel/electrolyte interface.38


![[thin space (1/6-em)]](https://www.rsc.org/images/entities/char_2009.gif) ln(1000·Kads) = ΔHads − TΔSads
ln(1000·Kads) = ΔHads − TΔSads


