 Open Access Article
Water absorption dependence of the formation of poly(vinyl alcohol)-iodine complexes for poly(vinyl alcohol) films†
Yingxu Song,
Sumei Zhang,
Jian Kang ,
Jinyao Chen
 * and
Ya Cao
State Key Laboratory of Polymer Materials Engineering, Polymer Research Institute of Sichuan University, Sichuan University, Chengdu 610065, China. E-mail: chenjinyao@scu.edu.cn; Tel: +86-28-8540-6333
First published on 26th August 2021
Abstract
Poly(vinyl alcohol) (PVA) films annealed at different temperatures are used to explore the effects of the water absorption on the formation of PVA–iodine complexes. It's found that the higher the annealing temperature, the stronger the interaction force between PVA segments, and the smaller the free volume of the PVA films. These mainly lead to the reduction of the amount of PVA segments with a moderate degree of hydration (i.e., PVA segments with moderate mobility), which are the major segments participating in the formation of PVA–iodine complexes. Therefore, PVA films with higher water absorption not only possess faster complexation speed and form more PVA–iodine complexes, but also increase the proportion of polyiodide ions with a longer length. Moreover, the complexation restricts the PVA segments with high mobility, resulting in the formation of the intermolecular ordered structure. The water absorption dependence may guide the dyeing process to obtain PVA polarizers with excellent optical performance.
1. Introduction
Poly(vinyl alcohol) (PVA) possesses outstanding chemical properties because of a large number of hydroxyl groups, which could act as active sites for chemical modification or cross-linking.1 Since being synthesized by Herrmann and Haehnel in 1924,2 PVA has been widely applied in many fields, such as fibers, gel materials, water treatment, and so on.3–6 Especially, PVA is extremely suited for the application of polarizing films used as the key functional layer for liquid crystal displays (LCDs) to produce polarized light,7–9 due to the strong complexation with iodide ions. PVA polarizing film plays the role of optical switches in LCDs, and its quality determines the display performance. With the popularity of telecommuting, there is a huge demand for high-quality polarizers in the flat panel display industry recently.Currently, the mainstream process of commercial polarizers can be divided into four steps, which influence each other.10–14 Generally speaking, the swelling process promotes the tensile properties of the PVA base-films; the dyeing process produces PVA–iodine complexes; the stretching process orients the dichroic materials (i.e., PVA–iodine complexes) along the PVA molecular chains; the fixing process improves the durability by immersing the polarized films in boric acid solution. Therefore, PVA–iodine complexes resulted from the absorbed iodide ions are one-dimensionally aligned along the highly oriented PVA chains finally, leading to excellent dichromatic performance. Based on these processes, lots of work had been carried out on the factors affecting the formation of PVA–iodine complexes and the strain-induced structural evolutions of PVA films at various conditions.15–35
As for the formation of PVA–iodine complexes, from the proven helix model of the amylose–iodine complex in solution, Zwick15 proposed the helix model where polyiodide ions were surrounded by helical PVA chains. However, Rundle et al.16–18 and Tebelev et al.19 suggested the aggregation model in which polyiodide ions were surrounded by several extended PVA segments. The latter was more reasonable and supported by Kojima's work,20 i.e., the extended conformation induced by stretching the PVA films promoted the complex formation. Meanwhile, Choi et al.21–24 systematically investigated the dependence of PVA–iodine complexes on the concentration of iodine/potassium iodide (I2/KI) solution. They concluded that the complexes mainly formed in amorphous regions of PVA films at a low concentration of I2/KI solution, but iodide ions penetrated into crystalline regions at a higher concentration. On the other hand, they also found that the higher concentration of I2/KI solution, the more PVA–iodine complexes formed. Furthermore, Oishi et al.25,26 explored the effects of the water absorption of PVA films on the formation of PVA–iodine complexes, and revealed that the amount of complex increased with water absorption rising. Thus, many researchers27–29 tried to modify PVA films with plasticizers (such as pentaerythritol, boric acid and so on) to promote the formation of PVA–iodine complexes and the tensile properties. However, the above works only focused on the factors influencing the formation of PVA–iodine complexes, and did not point out which state of PVA segments in the swollen films was the most conducive to the formation of PVA–iodine complexes.
On the other hand, Miyazaki et al.30 quantitatively analyzed the evolution of the condensed structure of PVA films stretching in water and I2/KI solution with the help of small- and wide-angle X-ray scattering (SAXS and WAXS), and they concluded that the PVA–iodine complexes could act as junction points in the microfibrillar network and resulted in the more efficient extension of PVA chains during the stretching process. Subsequent studies31,32 indicated that PVA films drawn in water above 50 °C induced inefficient extension of PVA chains. Recently, Li et al.33–35 also systematically studied the influence of the concentration of I2/KI solution and water temperatures on the stretch-induced structural evolution of PVA films, and their results agreed with Miyazaki's work well. They also concluded that at 40 °C (below 50 °C) the stretch-induced recrystallization occurring in the strain hardening stage could stabilize the nanofibrils. These indicate that both PVA–iodine complexes and water absorption are closely related to the orientation of PVA chains during the stretching process. Especially, the water absorption of PVA films is a key factor affecting both the formation and orientation of PVA–iodine complexes, and determines the final optical performance.
In the present study, we monitored the swelling and dyeing processes of PVA films in real-time via the time-resolved ATR-FTIR, and the variation of states of water in PVA films before and after the dyeing process was quantitatively analyzed by DSC. We conclude that the annealing treatment changes the microstructure of PVA films, leading to the difference of water absorption and the obvious distinctions in the complexation reaction with iodide ions. Besides, a bridge between the PVA segmental mobility close related to the water absorption and the formation of PVA–iodine complexes is also established. This work will be significantly helpful to understand the formation mechanism of complexes at the molecular level when PVA films are dyed in I2/KI aqueous solution.
2. Experimental section
2.1. Materials and sample preparation
Commercial PVA films with a thickness of about 75 μm, were provided by Kuraray Co., Ltd. (Japan). The degree of polymerization is 2400, and the degree of saponification is larger than 99 mol%. The triad tacticity (mm = 0.21, mr = 0.43, rr = 0.36) was estimated by means of Fourier transform infrared spectroscopy (FTIR) (As shown in Fig. S1†) according to the Kenney method.36 Both I2 and KI purchased from Chengdu Chron Chemicals Co., Ltd. (China), were analytical grade. All these chemicals were used directly without further purification.To obtain samples with different swelling properties, PVA films were annealed at 50, 80, 100, 120 and 130 °C for 2 h in the oven. Samples in the equilibrium swelling state were produced by immersing in 30 °C deionized water for 2 h, followed by soaking in I2/KI solution 20 min to get equilibrium-dyeing PVA films. The concentration of I2/KI solution was 0.002 mol L−1 with a constant molar ratio of I2/KI = 1/4. Different PVA films were named PVA-X, X meant the annealing temperature. For example, the sample of PVA-50 represented PVA films were annealed at 50 °C.
2.2. Fourier transform infrared spectroscopy (FTIR)
Attenuated total reflectance Fourier transform infrared (ATR-FTIR) spectroscopy (Frontier FT-IR Spectrometer, PerkinElmer Co., Ltd., USA) was used to examine samples with the resolution of 4 cm−1 and accumulation of 16 scans.Both the water diffusion into PVA films during the swelling process and the formation of PVA–iodine complexes during the dyeing process, were measured by the time-resolved ATR-FTIR instrument equipped with a LiTaO3 detector and a ZnSe internal reflection element ATR cell at room temperature. The schematic device was shown in Fig. 2a. The dry or the equilibrium-swelling PVA film with the size of 2 cm × 2 cm and the thickness of 75 μm, was placed on the ZnSe cell, and then a hydrophilic poly(tetrafluoroethylene) (PTFE) filter paper with the size of 1 cm × 1 cm was put above it. Since the penetration depth of the infrared light (IR) in the samples is about 0.5 μm (less than 75 μm) and the diffusion speed of water in filter paper is much faster than that in samples, we thought that the diffusion of water molecules in the thickness direction of PVA films was uniform.
For the diffusion experiments, dry PVA films were used, and after deionized water was injected into PTFE filter paper, spectra were collected every 2 min with the resolution of 4 cm−1 and accumulation of 16 scans until spectra unchanged. For the formation of PVA–iodine complex tests, PVA films in the equilibrium swelling state were used, and after I2/KI solution was injected into PTFE filter paper, spectra were obtained every 0.5 min with the resolution of 4 cm−1 and accumulation of 8 scans until spectra were unchanging.
2.3. X-ray diffractometer (XRD)
The crystalline structure of heat-treated samples was measured by using the X-ray diffractometer (Ultima IV, Rigaku Co., Japan). The Cu Kα X-ray radiation (λ = 0.154 nm) was used, the operating voltage and current were 40 kV and 40 mA, respectively. The scanning range was from 10° to 50° with a speed of 10° min−1. The crystallinity (XXRD) was calculated by the following equation:
 | (1) |
2.4. Swelling behavior
The water absorption of various PVA films annealed was evaluated by the immersion method. Samples were immersed in distilled water at 30 °C for 2 h to reach the equilibrium swelling state, and then dried in the oven at 130 °C for 10 h to remove water. The weight reduction means the absolute weight of absorbed water. Hence, the water absorption (A (%)) could be calculated by the formula:
 | (2) |
2.5. Differential scanning calorimetry (DSC)
The contents of water in different states in swollen or dyed PVA films were determined by differential scanning calorimetry (DSC 1, Mettler Toledo Co., Switzerland). Temperature and heat flow scales were corrected by using highly-purified indium and zinc as the standard. Samples with the nominal weight of 2–5 mg, were cooled from 20 °C to −40 °C at a cooling rate of 5 °C min−1, lasted 3 min at −40 °C, and then heated to 20 °C at a heating rate of 2 °C min−1. The testing program was shown in Fig. S2.†After scanned, the samples were dried for over 10 h at 130 °C, and then weighted to determine the true water absorption (A (%)). Moreover, the melting enthalpies of the absorbed water in different states could be obtained by integration and normalization from the DSC endothermic curves of samples (shown in Fig. S3†). Therefore, the ratios of the weight of absorbed water in different states to the weight of dry PVA film (wfbw-I for freezable bound water I, wfbw-II for freezable bound water II, wfw for free water, and wnfbw for non-freezable bound water), could be analyzed quantitatively through the following equations:37–39
 | (3) |
 | (4) |
 | (5) |
| wnfbw (%) = A − wfbw-I − wfbw-II − wfw | (6) |
 corresponding to the melting enthalpy of ice with the imperfect crystal structure is 288.7 J g−1, and
  representing that of ice with the perfect crystal structure is 333.5 J g−1.40
2.6. Raman spectroscopy
To distinguish the species of iodide ions in the samples, Raman spectroscopy was carried out by Raman imaging microscope (DXRxi, Thermo Fisher Scientific Co., Ltd., USA) with an excitation laser radiation of 532 nm wavelength.2.7. Ultraviolet-visible spectroscopy (UV-vis)
Ultraviolet-visible spectroscopy (UV-1800, Shimadzu Co., Japan) was used to detect the formation of the PVA–iodine complex. Dyed PVA films were dried at room temperature and then tested at a wavelength range from 200 to 800 nm.3. Results and discussion
3.1. Structure and swelling properties of annealed PVA samples
The FTIR spectra of PVA films annealed at various temperatures are shown in Fig. 1a. It is obvious that with the annealing temperature increasing, the absorbance of intermolecular order (i.e., crystal-sensitive band, 1142 cm−1) of PVA41,42 becomes more intense slightly, while the stretching vibration of C–O (ν(C–O)) at 1046 cm−1 is fading, these phenomena mean that the annealing treatment enhances the interaction between PVA molecular segments. There still exist weak peaks of the bending vibration of hydroxyl (δ(–OH, H2O)) at 1660 cm−1 related to bound water in all samples undergone heat treatment, which suggests the residual bound water cannot be removed completely. Compared with the other samples, PVA annealed at 130 °C appears an obvious characteristic peak of the conjugated double bonds (C![[double bond, length as m-dash]](https://www.rsc.org/images/entities/char_e001.gif) C) at 1560 cm−1, indicating the occurrence of the thermal degradation.43 Moreover, when the annealing temperature increases, the crystalline peak at 2θ = 19.57° corresponding to the (10
C) at 1560 cm−1, indicating the occurrence of the thermal degradation.43 Moreover, when the annealing temperature increases, the crystalline peak at 2θ = 19.57° corresponding to the (10![[1 with combining macron]](https://www.rsc.org/images/entities/char_0031_0304.gif) ) (101) doublet44 shifts to a higher Bragg angle gradually (as shown in Fig. 1b), which manifests the perfection of PVA crystal structure. The dependence of crystallinity and water absorption of PVA films on the annealing temperature shows in Fig. 1c. With the increase of annealing temperature, the crystallinity of PVA increases while the water absorption decreases remarkably. However, Kojima45 systematically investigated the permeability of water in the casting PVA films annealed, and found that the crystallinity of dry PVA membranes was not affected by the annealing treatment, whereas the degree of hydration changed significantly. Therefore, the effects of the pre-annealing treatment on the water absorption and the formation of PVA–iodine complexes will be discussed in detail in the next sections. Considering the chemical structure stability and the water absorption of samples, PVA films annealed at 50, 100, and 120 °C were selected for further study.
) (101) doublet44 shifts to a higher Bragg angle gradually (as shown in Fig. 1b), which manifests the perfection of PVA crystal structure. The dependence of crystallinity and water absorption of PVA films on the annealing temperature shows in Fig. 1c. With the increase of annealing temperature, the crystallinity of PVA increases while the water absorption decreases remarkably. However, Kojima45 systematically investigated the permeability of water in the casting PVA films annealed, and found that the crystallinity of dry PVA membranes was not affected by the annealing treatment, whereas the degree of hydration changed significantly. Therefore, the effects of the pre-annealing treatment on the water absorption and the formation of PVA–iodine complexes will be discussed in detail in the next sections. Considering the chemical structure stability and the water absorption of samples, PVA films annealed at 50, 100, and 120 °C were selected for further study.
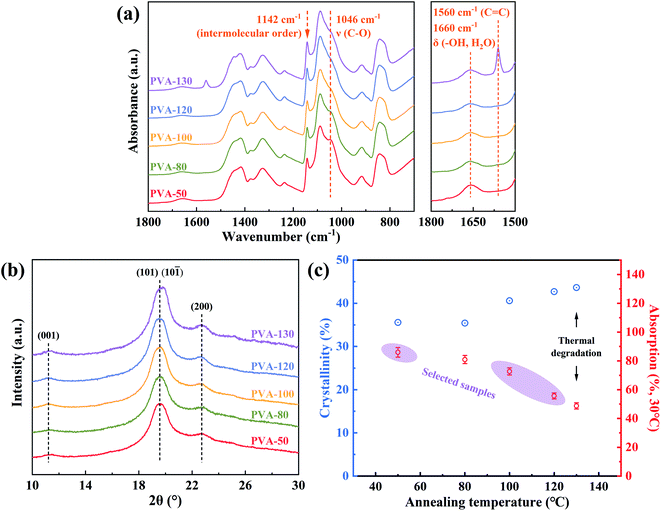 | ||
| Fig. 1 (a) FTIR spectra and (b) XRD patterns of PVA films annealed at different temperatures; (c) effects of the annealing treatment on crystallinity and water absorption. | ||
3.2. Diffusion of water molecules into the PVA films
By means of the time-resolved ATR-FTIR instrument (illustrated in Fig. 2a), the diffusion behavior of water molecules into the annealed PVA films was conducted to explain that samples with higher annealing temperatures possess lower water absorption. Fig. 2b shows that I2/KI solution has the same characteristic peaks as deionized water, which suggests that the effects of I2 and KI on bulk water molecules are minimal. Meanwhile, the bands presenting in the range of 3750–2950 cm−1 are assigned to the coupling bands of stretching vibration of hydroxyl groups in PVA and water, while 1750–1500 cm−1 represents δ(–OH, water). All IR bands were listed in Table S3,† and the peaks belonging to PVA at 1141 cm−1 and 916 cm−1 (i.e., inter- and intramolecular order) were of major concern in this experiment.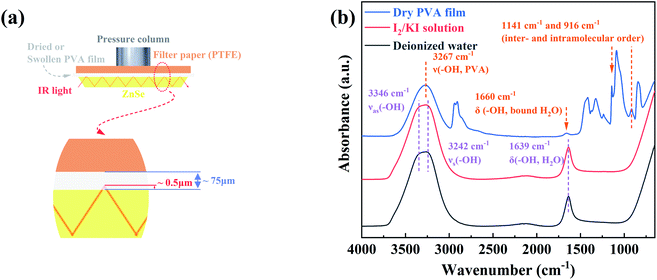 | ||
| Fig. 2 (a) The schematic device of the time-resolved ATR-FTIR instrument; (b) FTIR spectra of deionized water, I2/KI solution, and dry PVA film. | ||
As shown in Fig. 3a–c, the time-resolved ATR-FTIR spectra of PVA films annealed at different temperatures shows the same trend during the water diffusion. With the diffusion time increasing, the absorbance of 1141 cm−1 and 916 cm−1 decreased, while that in the range of 3750–2950 cm−1 and 1750–1500 cm−1 increased significantly. This result suggests that water molecules penetrate into the microvoids of PVA films,46 and then interact with the hydroxyl groups in PVA chains. Finally, the strong interaction between PVA segments is destroyed, which results in the enhancive freedom of PVA chains and the decrease of the inter- and intramolecular ordered structures remarkably. Besides, the peak at 1660 cm−1 corresponding to δ(–OH, water) shifts to lower wavenumber, indicating the increase of free water molecules with weak hydrogen bonds in the final equilibrium state. To further distinguish the stages of water molecules diffusion clearly, we directly employed the contour maps to describe the absorbance (Fig. 3a′–c′). According to the variation of absorbance, the diffusion time was divided into three regions with the blue dashed lines as boundaries. Because the penetration depth of IR incident light (∼0.5 μm) is much less than the thickness of samples (75 μm, as shown in Fig. 2a), Region I is defined as the diffusion of water molecules outside the detection range, which is proved by the unchanged signal intensity of water. Drastic variation in absorbance suggests that Region II represents the diffusion process of water within the detection range. The absorbance of Region III keeps the same, which is a symbol of diffusion equilibrium.
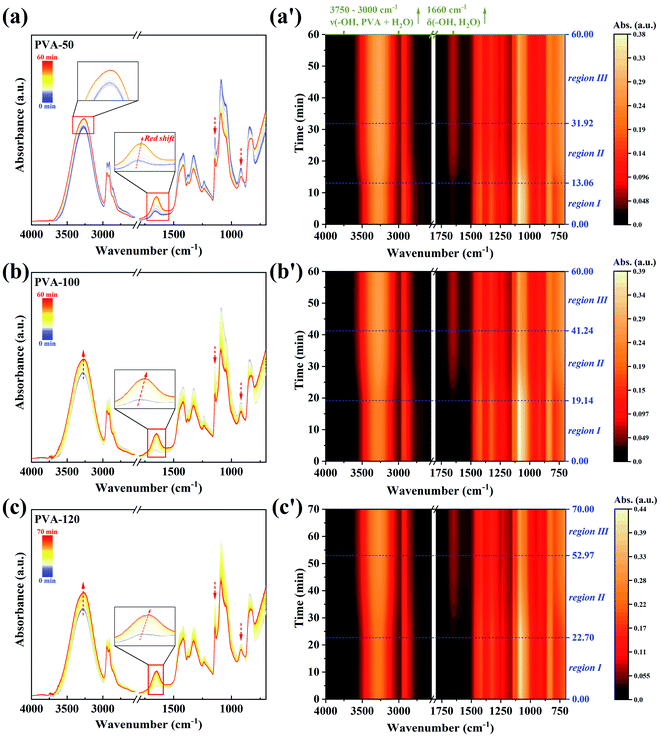 | ||
| Fig. 3 Time-resolved ATR-FTIR spectra and the corresponding contour maps during water diffusion into PVA films, (a) and (a′) for PVA-50; (b) and (b′) for PVA-100; (c) and (c′) for PVA-120. | ||
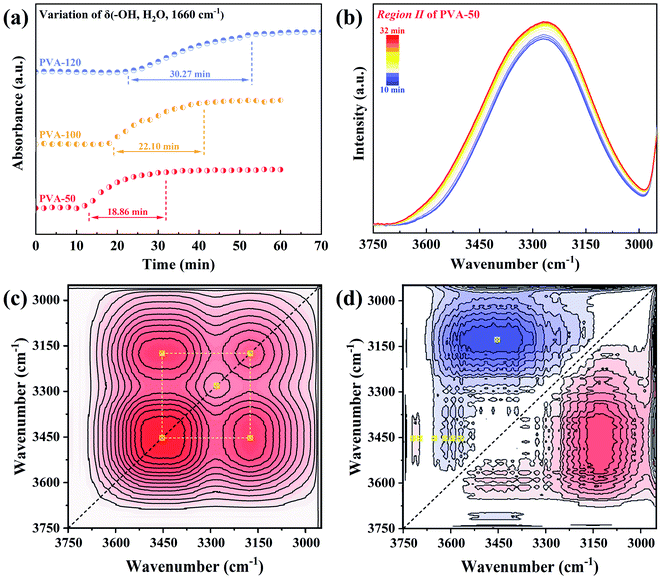
The time dependence of the absorbance of δ(–OH, H2O, 1639 cm−1) for all samples is presented in Fig. 4a, and show that the time of both Region I and Region II rises with the pre-annealing temperature increasing. Herein, to better understand the interactions between PVA and water molecules during the water diffusion, two-dimensional correlation spectroscopy (2DCOS) with enhancing spectral resolution was conducted.46–48 The range of 3750–2950 cm−1 in Region II was selected for 2D correlation analysis, and the results of PVA-50 are represented in Fig. 4c and d (the others are shown in Fig. S4†). From the asynchronous contour maps, we determined that the broad peak ν(–OH, PVA + H2O) in the 1D ATR-FTIR spectra is overlapped by eight single bands. According to the Noda rules,49,50 we conclude that the specific sequence orders of bands mentioned above is 3698, 3719 > 3128 > 3453 > 3569, 3593, 3618, and 3651 cm−1 (the detailed analysis shown in Fig. S4†). Therefore, the process of water diffusion into PVA films can be described as following (the schematic mechanism shown in Fig. S5†): free water molecules with very weak hydrogen bonds first enter the PVA matrix, and then bulk water with strong hydrogen bonds penetrates into microvoids (i.e., the free volume) of the PVA matrix. With time increasing, the confined bulk water splits into smaller water clusters, and the clusters interact with hydroxyls in the PVA chains, resulting in the weakening of not only the hydrogen bonds between water molecules but also the interaction between PVA segments. The PVA films finally reach a diffusion equilibrium state.
Based on the diffusion mechanism, we can draw the following conclusion that the time of Region I and Region II is determined by the free volume and intermolecular forces of the PVA matrix together. Therefore, Fig. 4a indicates that PVA films annealed at the higher temperatures possess the smaller free volume and the stronger interaction (i.e., intermolecular hydrogen bonds interaction) between PVA chains, which leads to the longer time of Region I and Region II. Moreover, these will result in the poor water absorption and mobility of PVA segments in the equilibrium swelling state.
3.3. Formation of PVA–iodine complexes during the dyeing process
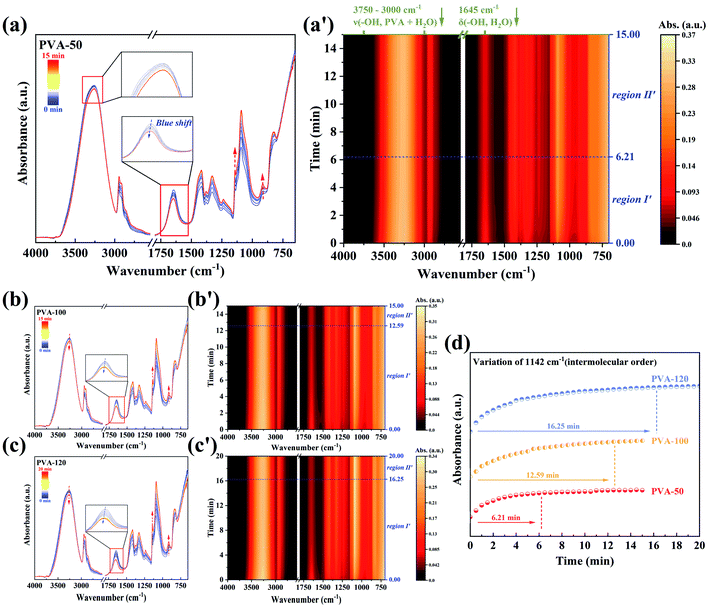
The spectral variation during the dyeing process was recorded by the time-resolved ATR-FTIR spectra (Fig. 5a–c). It is obvious that the spectra of different samples have the same trend during dyeing, but the trend is opposite to that of water diffusion into the PVA matrix (Fig. 3a–c). Since there is no difference between the FTIR spectra of water and I2/KI solution (Fig. 2b), the changing of spectra is attributed to the formation of PVA–iodine complexes. The absorbance of 1141 cm−1 and 916 cm−1 increase while that in the range of 3750–2950 cm−1 and 1750–1500 cm−1 decrease with the dyeing time rising. These results suggest that iodide ions diffused into the PVA matrix interact with the hydroxyl groups in PVA chains, and participate in the formation of PVA–iodine complexes. The PVA–iodine complex formed induces the decrease of the freedom of PVA segments, which is in line with the increase of the absorbance of the inter- and intramolecular ordered structures of PVA. Moreover, the peak at 1645 cm−1 assigned to δ(–OH, water) shifts to a higher wavenumber, suggesting that the content of bound water is increasing gradually with the formation of PVA–iodine complexes.With the help of the corresponding contour maps of the time-resolved ATR-FTIR spectra, we define two regions with the blue dashed lines as boundaries as illustrated in Fig. 5a′–c′. The absorbance of Region I′ changes with time significantly, while that of Region II′ remains unchanged. Hence, Region I′ is defined as the formation of PVA–iodine complexes, and Region II′ is a symbol of the equilibrium dyeing state. After I2/KI solution was injected into PTFE filter paper placed above the equilibrium-swelling PVA film, the absorbance of the sample changed immediately, which indicates the thickness of PVA film has little effect on the diffusion of iodide ions. Therefore, we think that the water which permeated into the PVA matrix might act as the diffusion channels of iodide ions. Furthermore, the absorbance of 1142 cm−1 (intermolecular order) (Fig. 5d) takes more time to reach the equilibrium state for the sample annealed at a higher temperature. In other words, the higher pre-annealing temperature, the worse water absorption and ability to form PVA–iodine complexes, which is consistent with Miyasaka' conclusions.25,26,51 Obviously, there must be a relationship between the segmental mobility of PVA chains in the equilibrium swelling state and the formation of PVA–iodine complexes, and it will be proven in the next section.
3.4. States of water in the swollen and dyed PVA films
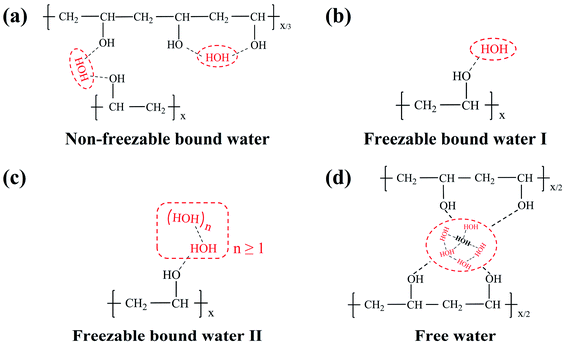
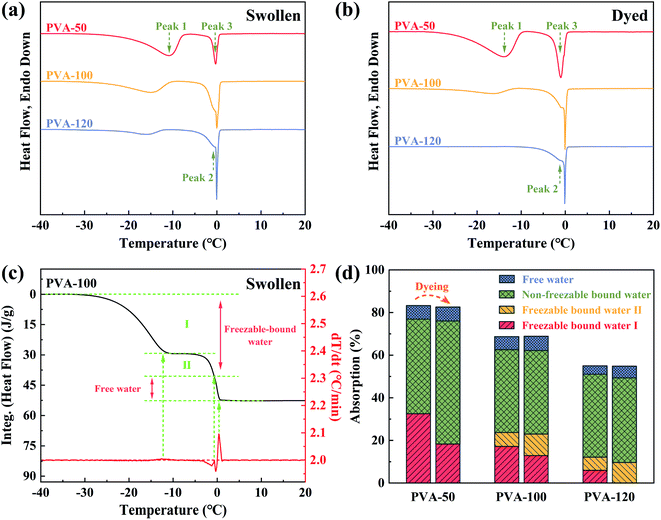
According to the theory of three water states,52 states of water in the polymer matrix are classified by hydrogen bonds. Non-freezable bound water (Fig. 6a) represents the restricted water molecules bonded with hydroxyl groups through strong hydrogen bonds, while freezable bound water (Fig. 6b and c) is the molecules that weakly interact with hydroxyl groups and ambient water molecules, and the others are defined as free water (Fig. 6d) possessing the same structure and freedom as bulk water. Thus, the mobility of PVA segments can be estimated by the hydration degree of hydroxyl groups in PVA chains, i.e., the mobility of PVA segments corresponding to free water, freezable bound water, and non-freezable bound water are the strongest, middle, and worst, respectively. These provide us a method to quantitatively analyze the mobility of PVA segments.There are three peaks in the DSC ice-melting curves as shown in Fig. 7a and b, and the melting-peak temperature depends on the perfection of ice crystal structure (i.e., the states of water in the PVA matrix). Therefore, Peak 1, Peak 2, and Peak 3 are assigned to freezable bound water I, freezable bound water II, and free water, respectively. The heating curves of PVA films in the equilibrium swelling and equilibrium dyeing states show the same trend. When the pre-annealing temperature rises, Peak 1 (lower than −10 °C) moves to a lower temperature and a shoulder Peak 2 (lower than Peak 3) splits away from Peak 3 (around 0 °C). Since PVA films annealed at higher temperatures possess stronger intermolecular interaction and smaller free volume, the water molecules in the PVA matrix become more restricted and form more imperfect ice crystal structures. This results in the decrease of Peak 1 and the split of Peak 3. More interestingly, compared with the swollen samples (Fig. 7a), the samples after the dyeing process (Fig. 7b) show an apparent decrease of Peak 1, and Peak 1 of the dyed PVA-120 film even disappears. This is attributed to the formation of PVA–iodine complexes, which increases the interaction of PVA segments and results in the reduction of the number of water molecules in freezable bound water I (shown in Fig. 6b).
Furthermore, the weight ratios between absorbed water in different states and dry PVA film could be calculated quantitatively (an example is shown in Fig. 7c, and the detailed descriptions are shown in Fig. S3†), and the results are presented in Fig. 7d. It is clear that bound water (especially non-freezable bound water) is the major state of water existing in all samples, and the amount of free water is only about 5 wt% of the dry PVA film. This is ascribed to a large number of hydroxyl groups in the PVA matrix that can form strong hydrogen bonds with water molecules. More importantly, the amount of non-freezable bound water in equilibrium-swelling PVA films is stable around 40 wt% of the dry PVA film, which indicates that it is not dependent on the water absorption. And the differences in water absorption are mainly reflected in the content of freezable bound water.
After dyeing, although the total water absorption of sample changes just a little, the existing states of water in the PVA matrix have obviously changed (Fig. 7d). For PVA-50, the transition from freezable bound water I to non-freezable bound water mainly took place. However, freezable bound water I was mainly transformed into freezable bound water II for PVA-100 and PVA-120, and non-freezable bound water increased just a little. It's also important to note that the higher water absorption, the more the reduction of freezable bound water I after the dyeing process. Hence, we conclude that compared with PVA segments representing freezable bound water II and free water, PVA segments corresponding to freezable bound water I have the strongest ability to form PVA–iodine complexes. And PVA-50 with the highest water absorption could produce the largest amount of PVA–iodine complexes. Besides, PVA segments assigned to non-freezable bound water do not participate in the complexation with iodide ions because of the strong hydrogen bonds (Fig. 6a), which is proved by the remarkable increase of the amount of non-freezable bound water after the dyeing process. It's obvious that PVA segments with moderate hydration (Fig. 6b) are the most conducive to the formation of PVA–iodine complex. Thus, we think that the formation of PVA–iodine complexes is formed by several adjacent PVA chains surrounding iodide ions, and the iodide ions act as the junction points restricting the mobility of PVA segments. This result supports the aggregation model proposed by Rundle.16–18
3.5. Chemical species produced by iodine in dyed PVA films
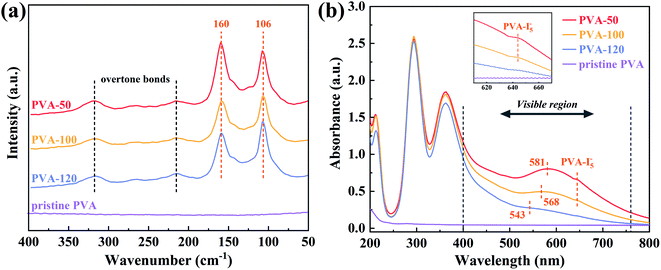
There are four peaks exhibited at Raman spectra (Fig. 8a), and the peaks located at 215 cm−1 and 318 cm−1 are the overtone bands of 106 cm−1 and 160 cm−1, respectively.25,53,54 The two strong scattering peaks suggest that iodine elements mainly exist in the forms of I3− (106 cm−1) and I5− (160 cm−1) in the dyed PVA films. Interestingly, the relative intensity between I3− and I5− changes with the decrease of water absorption, indicating the major existing form of iodine elements is greatly dependent on the states of PVA segments. In other words, PVA films annealed at higher temperature possess the worse mobility of segments in the swollen states, and iodine elements mainly form I3− ions. Moreover, UV-vis spectroscopy was used to detect the chemical species produced from the complexation of PVA and iodide ions.55–57 In the UV region of Fig. 8b, three absorption peaks appearing at 213, 295, and 362 nm represent the free I−, I3−, and I2·I3−, respectively, and there are no significant differences. Whereas in the visible region, due to the gradual reduction of the relative proportion of the PVA–I5− complex, the wavelength of the maximum absorption peak (λmax) shifts from 581 nm to 543 nm, and this conclusion is consistent with Raman spectra. On the other hand, the absorbance of λmax and 645 nm (PVA–I5− complex) decreases remarkably, revealing the total amount of PVA–iodine complexes reduced. These results agree with the DSC testing, and further demonstrate that both the total amount and the forms of PVA–iodine complex are affected by water absorption.3.6. Discussion
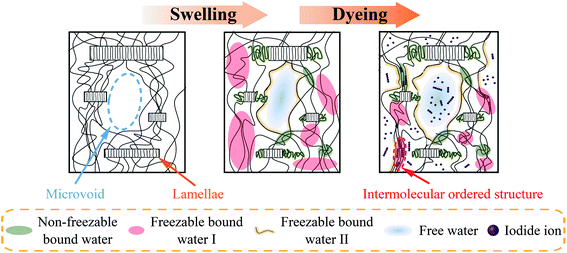
Based on the results in previous sections, it's proved that the formation of PVA–iodine complexes is related to the water absorption of PVA films strongly. Besides, PVA films with different water absorption are obtained by annealing treatment, and the process of water molecules diffusion into the PVA matrix is observed by the time-resolved ATR-FTIR (shown in Fig. S5†). These suggest that water absorption is reduced with the annealing temperature rising, resulting from the stronger interaction force (i.e., intermolecular hydrogen bonds) and smaller free volume (i.e., microvoids). For the convenience to describe these relationships, the schematic mechanism of the swelling and dyeing processes for dry PVA films is shown in Fig. 9.For the double network model of PVA films referring to polymer chain network and fibrillar network,30–32,51 we propose that both the entangled PVA chains in the amorphous region and the tightly packed chains in the lamellae gradually become relaxed during the swelling process,58 which is ascribed to the interaction between water molecules penetrating into the PVA matrix and the hydroxyl groups of PVA. As shown in Fig. 9, free water mainly occupies microvoids in the PVA matrix, and the others are assigned to PVA segments with various degrees of hydration. It's interesting that the amount of non-freezable bound water in equilibrium-swelling PVA films is not dependent on the water absorption because of a large number of hydroxyl groups, and the difference in water absorption is mainly reflected in the content of freezable bound water (especially freezable bound water I). These are attributed to the stronger interaction force and smaller free volume of PVA samples with higher annealing temperature. Namely, the difference of PVA samples with different water absorption is mainly the amount of PVA segments with a moderate degree of hydration corresponding to freezable bound water I.
In the dyeing process, iodide ions penetrate into the swollen PVA matrix, followed by the transformation from the loosely hydrated PVA segments to the intermolecular ordered structure. DSC testing shows that the formation of PVA–iodine complexes mainly results in the reduction of freezable bound water I, revealing these corresponding segments are the major segments participating in the complexation. Thus, the swollen PVA films with higher water absorption (i.e., the larger amount of freezable bound water I) need less time to reach the equilibrium dyeing states, and produce more proportion of polyiodide with longer length, and also form more PVA–iodine complexes.
4. Conclusions
In present work, the swelling properties of PVA films were controlled by annealing treatment, and the effects of the water absorption on the formation of PVA–iodine complexes were investigated in detail. The swelling process of PVA films monitored by the time-resolved ATR-FTIR, reveals that the higher annealing temperature, the stronger intermolecular hydrogen bonds interaction between PVA segments, and the smaller free volume of the PVA matrix. This results in the decrease of water absorption, and DSC further proves that the amount of freezable bound water is mainly reduced. At the same time, the variation of states of water in PVA films before and after the dyeing process suggests the major PVA segments participating in the complexation are the moderately hydrated segments, and the swelling and dyeing processes induce the increase and decrease of the freedom of PVA chains, respectively. What's more, PVA films with higher water absorption have faster complexation speed and produce more proportion of polyiodide with longer length, and also form more PVA–iodine complexes. These are attributed to the strong segmental mobility of PVA films with high water absorption. Therefore, it's feasible to adjust the water absorption (i.e., the segmental mobility) to control the formation of PVA–iodine complexes in the industrial production of PVA polarizers with outstanding optical performance.Author contributions
Jinyao Chen and Yingxu Song conceived the idea of the study together. Yingxu Song carried out the experiments with the help of Sumei Zhang, and wrote the original manuscript. Jinyao Chen reviewed and edited this. Jian Kang, Ya Cao, and Ming Xiang provided the resources needed. All authors discussed the results and approved the final version of the manuscript.Conflicts of interest
The authors declare that they have no known competing financial interests or personal relationships that could have appeared to influence the work reported in this paper.Acknowledgements
This work is supported by the National Natural Science Foundation of China (NSFC 51890873).References
- B. Bolto, T. Tran, M. Hoang and Z. L. Xie, Crosslinked Poly(vinyl alcohol) Membranes, Prog. Polym. Sci., 2009, 34(9), 969–981 CrossRef CAS.
- W. O. Herrmann and W. Haehnel, Über den Oly-vinylalkohol, Ber. Dtsch. Chem. Ges., 1927, 60(7), 1658–1663 CrossRef.
- T. Y. Liu, D. D. Chen, Y. Cao, F. Yang, J. Y. Chen, J. Kang, R. Z. Xu and M. Xiang, Construction of a Composite Microporous Polyethylene Membrane with Enhanced Fouling Resistance for Water Treatment, J. Membr. Sci., 2021, 618, 118679 CrossRef CAS.
- Z. W. Wang, H. Zheng, Q. Chen, S. M. Zhang, F. Yang, J. Kang, J. Y. Chen, Y. Cao and M. Xiang, Preparation and Characterization of PVA Proton Exchange Membranes Containing Phosphonic Acid Groups for Direct Methanol Fuel Cell Applications, J. Polym. Res., 2019, 26(8), 200–209 CrossRef.
- Q. Wu, N. Chen, L. Li and Q. Wang, Structure Evolution of Melt-spun Poly(vinyl alcohol) Fibers during Hot-drawing, J. Appl. Polym. Sci., 2012, 124(1), 421–428 CrossRef CAS.
- Y. Q. Meng, X. W. Zhao and L. Ye, Construction of Dual Orientation Crystalline Structure in Poly(vinyl alcohol)/Graphene Oxide Nano-Composite Hydrogels and Reinforcing Mechanism, Ind. Eng. Chem. Res., 2019, 58(25), 10908–10921 CrossRef CAS.
- J. Ma, X. Ye and B. Jin, Structure and Application of Polarizer Film for Thin-Film-Transistor Liquid Crystal Displays, Displays, 2011, 32(2), 49–57 CrossRef CAS.
- K. H. Kim and J. K. Song, Technical Evolution of Liquid Crystal Displays, NPG Asia Mater., 2009, 1(1), 29–36 CrossRef.
- M. C. Choi, Y. Kim and C. S. Ha, Polymers for Flexible Displays: From Material Selection to Device Applications, Prog. Polym. Sci., 2008, 33(6), 581–630 CrossRef CAS.
- B. S. Lee, S. H. Nam and K. I. Rah, Method for Manufacturing Nearly-natural Black Polarizing Plate and Polarizing Plate Manufactured Thereby, US Pat., No. 10201943, 2019 Search PubMed.
- H. Yoshimi, Polarizing Plate Exhibiting a High Contrast Ratio and Liquid Crystal Display Apparatus, US Pat., No. 8917376, 2014 Search PubMed.
- T. Kitagawa, T. Mori, Y. Miyaki, S. Goto, M. Miyatake and T. Kamijo, Polarizing Film for an Organic Electroluminescent (EL) Display, A Method of Making the Same and An Organic EL Display Device Having the Polarizing Film, US Pat., No. 8411360, 2013 Search PubMed.
- C.-h. Tsai, Method of Making a Polarizing Sheet, US Pat., No. 20070107834, 2007 Search PubMed.
- W. L. Kausch, B. H. Williams and W. W. Merrill, Dichroic Polarizing Film and Optical Polarizer Containing the Film, US Pat., No. 6335051, 2000 Search PubMed.
- M. M. Zwick, Poly(vinyl alcohol)–Iodine Complexes, J. Appl. Polym. Sci., 1965, 9(7), 2393–2424 CrossRef CAS.
- R. E. Rundle, J. F. Foster and R. R. Baldwin, On the Nature of the Starch-Iodine Complex, J. Am. Chem. Soc., 1944, 66(12), 2116–2120 CrossRef CAS.
- R. E. Rundle and D. French, The Configuration of Starch and the Starch-Iodine Complex. II. Optical Properties of Crystalline Starch Fractions, J. Am. Chem. Soc., 1943, 65(4), 558–561 CrossRef CAS.
- R. E. Rundle and R. R. Baldwin, The Configuration of Starch and the Starch-Iodine Complex. I. The Dichroism of Flow of Starch-Iodine Solutions, J. Am. Chem. Soc., 1943, 65(4), 554–558 CrossRef CAS.
- L. G. Tebelev, G. F. Mikul'skii, Y. P. Korchagina and S. A. Glikman, Spectrophotometric Analysis of the Reaction of Iodine with Solutions of Polyvinyl alcohol, Polym. Sci. U.S.S.R., 1965, 7(1), 132–138 CrossRef.
- Y. Kojima, K.-I. Furuhata and K. Miyasaka, Sorption and Permeation of Iodine in WaterSwollen Poly(vinyl Alcohol) Membranes and Iodine Complex Formation, J. Appl. Polym. Sci., 1985, 30(4), 1617–1628 CrossRef CAS.
- Y.-S. Choi and K. Miyasaka, Structure and Properties of Poly(vinyl alcohol) -Iodine Complex Formed in the Crystal Phase of Poly( vinyl alcohol) Films, J. Appl. Polym. Sci., 1994, 51(4), 613–618 CrossRef CAS.
- Y. S. Choi and K. Miyasaka, Structure of Poly(vinyl alcohol)-Iodine Complex Formed in the Amorphous Phase of Poly(vinyl alcohol) Films, J. Appl. Polym. Sci., 1993, 48(2), 313–317 CrossRef CAS.
- Y. S. Choi and K. Miyasaka, X-Ray Study on the Structure of the Poly(vinyl alcohol)-Iodine Complex, Polym. J., 1991, 23(8), 977–981 CrossRef CAS.
- Y. S. Choi, Y. Oishi and K. Miyasaka, Change of Poly(vinyl alcohol) Crystal-Lattice by Iodine Sorption, Polym. J., 1990, 22(7), 601–608 CrossRef CAS.
- Y. Oishi, H. Yamamoto and K. Miyasaka, Structure of Poly(vinyl alcohol)-Iodine Complex in Water Swollen Film, Polym. J., 1987, 19(11), 1261–1268 CrossRef CAS.
- Y. Oishi and K. Mlyasaka, Effects of the Degree of Hydration of Water Swollen Poly(vinyl alcohol) Films on Their Iodine Complexation, Polym. J., 1986, 18(4), 307–313 CrossRef CAS.
- E. J. Shin, W. S. Lyoo and Y. H. Lee, Effect of Boric Acid Treatment Method on the Characteristics of Poly(vinyl alcohol)/Iodine Polarizing Film, J. Appl. Polym. Sci., 2012, 123(2), 672–681 CrossRef CAS.
- E. J. Shin, W. S. Lyoo and Y. H. Lee, Effect of Boric Acid and Heat Treatment for the Formation of Poly(vinyl alcohol)/Iodine Complex Films Iodinated at Solution Before Casting, J. Appl. Polym. Sci., 2011, 120(4), 1950–1956 CrossRef CAS.
- S. M. Zhang, H. Y. Yu, Q. Chen, H. T. Hu, Y. X. Song, J. Y. Chen, Y. Cao and M. Xiang, Influence of Pentaerythritol on the Properties of Polyvinyl alcohol Films for the Polarizers, J. Polym. Res., 2020, 27(2), 31 CrossRef CAS.
- T. Miyazaki, S. Katayama, E. Funai, Y. Tsuji and S. Sakurai, Role of Adsorbed Iodine into Poly(vinyl alcohol) Films Drawn in KI/I2 Solution, Polymer, 2005, 46(18), 7436–7442 CrossRef CAS.
- T. Miyazaki, A. Hoshiko, M. Akasaka, M. Sakai, Y. Takeda and S. Sakurai, Structure Model of a Poly(vinyl alcohol) Film Uniaxially Stretched in Water and the Role of Crystallites on the Stress−Strain Relationship, Macromolecules, 2007, 40(23), 8277–8284 CrossRef CAS.
- T. Miyazaki, A. Hoshiko, M. Akasaka, T. Shintani and S. Sakurai, SAXS Studies on Structural Changes in a Poly(vinyl alcohol) Film during Uniaxial Stretching in Water, Macromolecules, 2006, 39(8), 2921–2929 CrossRef CAS.
- K. Ye, Y. H. Li, W. W. Zhang, W. Chen, Q. L. Zhang, D. L. Wang and L. B. Li, Stretch-induced Structural Evolution of Dichromatic Substance with Poly(vinyl alcohol) at Different Concentrations of Boric Acid: An In-situ Synchrotron Radiation Small- and Wide-angle X-ray Scattering Study, Polymer, 2021, 212, 123297 CrossRef CAS.
- R. Zhang, Q. Zhang, Y. Ji, F. Su, L. Meng, Z. Qi, Y. Lin, X. Li, X. Chen, F. Lv and L. Li, Stretch-induced Complexation Reaction between Poly(vinyl alcohol) and Iodine: An In Situ Synchrotron Radiation Small- and Wide-angle X-ray Scattering Study, Soft Matter, 2018, 14(13), 2535–2546 RSC.
- Q. L. Zhang, R. Zhang, L. P. Meng, Y. X. Ji, F. M. Su, Y. F. Lin, X. Y. Li, X. W. Chen, F. Lv and L. B. Li, Stretch-induced Structural Evolution of Poly(vinyl alcohol) Film in Water at Different Temperatures: An In-situ Synchrotron Radiation Small- and Wide-angle X-ray Scattering Study, Polymer, 2018, 142, 233–243 CrossRef CAS.
- J. F. Kenney and G. W. Willcockson, Structure-Property Relationships of Poly(vinyl alcohol). III. Relationships between Stereo-regularity, Crystallinity, and Water Resistance in Poly(vinyl alcohol), J. Polym. Sci., Part A-1: Polym. Chem., 1966, 4(3), 679–698 CrossRef CAS.
- W. B. Li, F. Xue and R. S. Cheng, States of Water in Partially Swollen Poly(vinyl alcohol) Hydrogels, Polymer, 2005, 46(25), 12026–12031 CrossRef CAS.
- T. Hatakeyama, A. Yamauchi and H. Hatakeyama, Effect of Thermal Hysteresis on Structural Change of Water Restrained in Poly(vinyl alcohol) Pseudo-gel, Eur. Polym. J., 1987, 23(5), 361–365 CrossRef CAS.
- T. Hatakeyema, A. Yamauchi and H. Hatakeyema, Studies on Bound Water in Poly(vinyl alcohol) Hydrogel by DSC and FT-NMR, Eur. Polym. J., 1984, 20(1), 61–64 CrossRef CAS.
- W.-I. Cha, S.-H. Hyon and Y. Ikada, Microstructure of Poly(vinyl alcohol) Hydrogels Investigated with Differential Scanning Calorimetry, Die Makromolekulare Chemie, 1993, 194(9), 2433–2441 CrossRef CAS.
- V. N. Nikitin and B. Z. Volchek, Influence of Intermolecular and Intramolecular Order on the Infrared Absorption Spectra of Polymers, Russ. Chem. Rev., 1968, 37(3), 225–242 CrossRef.
- H. Tadokoro, Crystallization-Sensitive Band of Polyvinyl Alcohol, Bull. Chem. Soc. Jpn., 1959, 32(12), 1334–1339 CrossRef CAS.
- H. Yang, S. Xu, L. Jiang and Y. Dan, Thermal Decomposition Behavior of Poly(vinyl alcohol) with Different Hydroxyl Content, J. Macromol. Sci. B, 2011, 51(3), 464–480 CrossRef.
- H. E. Assender and A. H. Windle, Crystallinity in Poly(vinyl alcohol). 1. An X-ray Diffraction Study of Atactic PVOH, Polymer, 1998, 39(18), 4295–4302 CrossRef CAS.
- Y. Kojima, K. Furuhata and K. Miyasaka, Hydraulic Permeability of Water in Poly(vinyl Alcohol) Membranes as a Function of the Degree of Hydration, J. Appl. Polym. Sci., 1983, 28(7), 2401–2410 CrossRef CAS.
- Y. Peng, P. Wu and H. W. Siesler, Two-Dimensional/ATR Infrared Correlation Spectroscopic Study on Water Diffusion in a Poly(ε-caprolactone) Matrix, Biomacromolecules, 2003, 4(4), 1041–1044 CrossRef CAS PubMed.
- M. Wang and P. Wu, Reconsideration of the Results of the Two Dimensional Correlation Infrared Spectroscopic Study on Water Diffusion Process in Poly(ε-caprolactone) Matrix, Polymer, 2011, 52(3), 769–777 CrossRef CAS.
- C. Sammon, C. Mura, J. Yarwood, N. Everall, R. Swart and D. Hodge, FTIR-ATR Studies of the Structure and Dynamics of Water Molecules in Polymeric Matrixes. A Comparison of PET and PVC, J. Phys. Chem. B, 1998, 102(18), 3402–3411 CrossRef CAS.
- I. Noda, A. E. Dowrey, C. Marcott, G. M. Story and Y. Ozaki, Generalized Two-Dimensional Correlation Spectroscopy, Appl. Spectrosc., 2000, 54(7), 236a–248a CrossRef CAS.
- T. Zhou, A. Zhang, C. S. Zhao, H. W. Liang, Z. Y. Wu and J. K. Xia, Molecular Chain Movements and Transitions of SEBS above Room Temperature Studied by Moving-Window Two-Dimensional Correlation Infrared Spectroscopy, Macromolecules, 2007, 40(25), 9009–9017 CrossRef CAS.
- K. Miyasaka, PVA–Iodine Complexes – Formation, Structure, and Properties, Adv. Polym. Sci., 1993, 108, 91–129 CrossRef CAS.
- Y. Liu, X. Liu, B. Duan, Z. Yu, T. Cheng, L. Yu, L. Liu and K. Liu, Polymer-Water Interaction Enabled Intelligent Moisture Regulation in Hydrogels, J. Phys. Chem. Lett., 2021, 12(10), 2587–2592 CrossRef CAS.
- A. Sengupta, M. Holtz and E. L. Quitevis, Temperature-dependent Resonance Raman Study of Iodine-doped Poly(vinyl alcohol) Films, Chem. Phys. Lett., 1996, 263(1–2), 25–32 CrossRef CAS.
- F. Inagaki, I. Harada, T. Shimanouchi and M. Tasumi, The Resonance Raman Spectrum of the Poly(vinyl alcohol)-Iodine Complex, Bull. Chem. Soc. Jpn., 1972, 45(11), 3384–3388 CrossRef CAS.
- S. M. Saharin, T. Takahama, S. Nonogaki, K. Saito and K. Tashiro, Effect of OH Segmental Length on the Iodine Complex Formation of Ethylene–Vinyl Alcohol Random Copolymers, Macromolecules, 2015, 48(24), 8867–8876 CrossRef CAS.
- H. Takamiya, Y. Tanahashi, T. Matsuyama, T. Tanigami, K. Yamaura and S. Matsuzawa, On the Poly(vinyl alcohol)–Iodine Complexes, J. Appl. Polym. Sci., 1993, 50(10), 1807–1813 CrossRef CAS.
- H. Djojosubroto, Y. Tanizaki and T. Hoshi, Chemical Species Produced from Iodine in Stretched PVA Sheets, Bull. Chem. Soc. Jpn., 1970, 43(10), 3025–3028 CrossRef CAS.
- S. K. Mallapragada and N. A. Peppas, Dissolution Mechanism of Semicrystalline Poly(vinyl alcohol) in Water, J. Polym. Sci., Part B: Polym. Phys., 1996, 34(7), 1339–1346 CrossRef CAS.
Footnote |
| † Electronic supplementary information (ESI) available: Estimation of the triad tacticity of PVA films; program of DSC testing; the calculation of the amount of water in different states; the analysis of 2DCOS; the schematic mechanism of water diffusion into PVA matrix. See DOI: 10.1039/d1ra04867h |
| This journal is © The Royal Society of Chemistry 2021 |

