 Open Access Article
Creative Commons Attribution 3.0 Unported Licence
Eco-friendly estimation of isosorbide dinitrate and hydralazine hydrochloride using Green Analytical Quality by Design-based UPLC Method
Hemanth Kumar Chanduluru and
Abimanyu Sugumaran *
*
SRM College of Pharmacy, SRM Institute of Science and Technology, Kattankulathur- 603203, India. E-mail: abipharmastar@gmail.com; abimanys@srmist.edu.in; Tel: +917904062599
First published on 7th September 2021
Abstract
Isosorbide dinitrate (ISD) and hydralazine hydrochloride (HDZ) are critical drugs for the treatment of heart failure. Currently, no available analytical method for the determination of ISD and HDZ exists as per the literature that combines UPLC and Green Analytical Quality by Design, which is critical for designing a method that is sustainable for long-term use. This study proposes an eco-friendly determination of isosorbide dinitrate (ISD) and hydralazine hydrochloride (HDZ) using a Green Analytical Quality by Design-based UPLC Method. The developed technique is capable of separating ISD and HDZ, as well as their degradation products, using a Phenomenex C18 (50 × 2.1 mm, 2 μm) column containing ethanol and 0.1% trifluoroacetic acid (60![[thin space (1/6-em)]](https://www.rsc.org/images/entities/char_2009.gif) :
:![[thin space (1/6-em)]](https://www.rsc.org/images/entities/char_2009.gif) 40% v/v) at a flow rate of 0.5 mL min−1. This technique was validated and established a linearity range of 10–60 μg mL−1 and 18.75–112.5 μg mL−1, with R2 of 0.9998 and 0.9992 for ISD and HDZ, respectively along with accuracy, reproducibility, and selectivity. The new approach was further evaluated using five different assessment techniques such as National Environmental Methods Index, Analytical Eco-Scale, Green Analytical Procedure Index, Analytical Method Greenness Score, and Analytical GREEnness Metrics, and was determined to be environmentally benign. Based on these results, we have concluded that the developed UPLC technique with the combined approach of Green Analytical Quality by Design for determining stability might benefit in the creation of novel pharmaceutical products such as isosorbide dinitrate and hydralazine.
40% v/v) at a flow rate of 0.5 mL min−1. This technique was validated and established a linearity range of 10–60 μg mL−1 and 18.75–112.5 μg mL−1, with R2 of 0.9998 and 0.9992 for ISD and HDZ, respectively along with accuracy, reproducibility, and selectivity. The new approach was further evaluated using five different assessment techniques such as National Environmental Methods Index, Analytical Eco-Scale, Green Analytical Procedure Index, Analytical Method Greenness Score, and Analytical GREEnness Metrics, and was determined to be environmentally benign. Based on these results, we have concluded that the developed UPLC technique with the combined approach of Green Analytical Quality by Design for determining stability might benefit in the creation of novel pharmaceutical products such as isosorbide dinitrate and hydralazine.
1. Introduction
Liquid chromatography requires solvents with a combination of organic modifiers and pH enhancers to develop a stable analytical method. The most frequently used organic modifiers are acetonitrile, methanol, n-hexane, and tetrahydrofuran. These solvents have substantial impact on analytical chemistry due to their advantages of compatibility with most chemical compounds and drugs with low signal-to-noise ratio but have a notorious effect on the environment and analyst.1 Green analytical chemistry (GAC) has mainly focused on developing analytical methods that are safe for the environment and the analyst. GAC works on 12 principles2–6 that mainly focus on reducing solvent usage, replacing toxic chemicals, reusing the generated waste, and avoiding unnecessary steps.Hence, there is a need to establish the analytical method based on GAC principles. However, liquid chromatographic methods may follow 11 out of 12 principles.7 The reduction of solvent usage may be achieved with the help of miniaturization. The use of UPLC instead of HPLC reduces the waste generated and the time of analysis due to high pressure and low particle-sized short columns. This is a positive effect over the generation of low waste by UPLC technique within a quick run time. Replacement of more hazardous solvents with the help of eco-friendly solvents needs to be considered by the analysts. Selection of suitable eco-friendly solvents could be achieved with the help of several solvent selection guidelines proposed by different companies, such as Sanofi's Solvent Selection Guide,8 GSK Solvent Selection Guide,9 and SmithKline Beecham Solvent Selection.10 Most of the guidelines categorize the solvents based on environmental hazard safety (EHS) and net cumulative energy demand (CED).
Very few solvents were available as eco-friendly with low CED values, but these solvents cannot be used directly as an organic modifier in the analysis of drugs due to their disadvantages such as high noise in the instrument, and poor compatibility with all the drugs. By considering this fact, we have considered that ethanol was a green solvent, which is the perfect alternative for hazardous methanol and propylene carbonate for acetonitrile.
Application of Analytical Quality by Design (AQbD) in analytical methods11 helps to enhance the principles of GAC. The use of AQbD in the development of a method has many advantages: (i) it saves time and waste, (ii) revalidation is not required, (iii) the method can be transferred directly to other systems, and (iv) regulatory compliances.
Combining these three principles is innovative and essential in developing a stable method for long-term usage. Application of AQbD nullifies revalidation and enhances GAC principles. UPLC helps in reducing waste generation and supports GAC principles. Finally, the AQbD-based method in UPLC is always a robust method. Hence, this tri-combination is considered complementary to each other, and enhances the importance of analytical development.
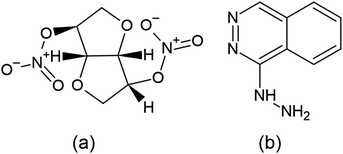
Isosorbide dinitrate (ISD) is chemically (3R,3aS,6S,6aS)-hexa hydrofuro-[3,2-b]-furan-3,6-diyldinitrate12 (Fig. 1), which is soluble in alcohols and sparingly soluble in water. Guanylate cyclase is an essential enzyme activated by nitric oxide once ISD reaches the systemic circulation. This guanylate cyclase enzyme elevates the concentration of cyclic guanosine-3′,5′-monophosphate (cGMP), which activates protein kinases and triggers a sequence of phosphorylation feedbacks, leading to dephosphorylation of smooth muscle fiber myosin light chains. Eventually, calcium ions are released and induce vasodilation, and cause smooth muscle relaxation. It mainly targets and antagonizes atrial and brain natriuretic peptide receptors, which are effective vasoactive hormones.
Hydralazine hydrochloride (HDZ) is chemically (1E)-1-hydrazono-1,2-dihydro phthalazine hydralazine13 (Fig. 1), and may relax the arteriolar smooth muscle and lower blood pressure by interfering with calcium transport in the vascular smooth muscle by an unknown mechanism. Calcium transport may be disrupted by preventing calcium influx into the cells, suppressing calcium release via intracellular compartments, acting directly on actin and myosin, or a combination of these processes. Increased stroke volume, cardiac output, and heart rate result from a decrease in the vascular resistance.
The HDZ drug comes under the Biopharmaceutical Classification System (BSC) class III with high solubility and low permeability. However, ISD also comes under class I due to its high permeability in the oral, rather than the gastrointestinal tract.
The US Food and Drug Administration has approved the combination of ISD and HDZ for the use of African American patients, in addition to standard heart failure medications.14–16 When related to conventional treatment alone, this mixture has been shown to advance survival, sustain the value of life, and help to reduce the risk of the first hospitalization for heart failure.
Several methods are available to analyze these drugs individually and in combined dosage form using UV,17 HPLC,18–22 and LCMS.23 However, so far, no single method was developed using GAC principles or using a robust AQbD24-based UPLC method.
Furthermore, no article has been published to explore the ISD and HDZ using this triple combination (GAC, AQbD, and UPLC). This study aimed to develop a simple, sensitive, fast, reliable, environmentally friendly, and specific UPLC method for determining ISD and HDZ simultaneously. The method validation is carried out under the ICH Q2 guidelines (R1).
2. Experimental
2.1. Chemicals and reagents
ISD and HDZ were obtained as a gift sample from Glenmark formulations (Mumbai, India). Union pharmaceuticals and chemicals (Mumbai, India) supplied HPLC grade organic phase ethanol. Merck (Mumbai, India) supplied analytical grade trifluoracetic acid, hydrochloric acid (HCl), sodium hydroxide (NaOH), orthophosphoric acid, and 30% hydrogen peroxide. Purified water for HPLC was produced using a Milli-Q filter system.2.2. Equipment and software
The development of the liquid chromatography (LC) analytical technique was carried out using an Agilent UPLC (Santa Clara, California, USA) integrated with a binary solvent controller, an automated sampler, a photodiode array detector (PDA), and temperature-controlled column compartments. The pH of the solutions was determined using a Systronics Digital pH Meter 802 (Gujarat-India). Unichrome ultrasonic baths were utilized to degas the solvents. Phenomenex (C18, 50 × 2.1 mm, 2 μm) (Phenomenex, Torrance, CA, USA) columns were used for trails to determine ISD and HDZ. Agilent LC systems were integrated with the chromatography data management software Empower 3. AQbD was carried out using Design-Expert® trailed version 12 (Stat-Ease Inc., Minneapolis-USA).2.3. Final conditions for the UPLC method
The final proposed technique constraints within the working point were Phenomenex C18 (50 × 2.1 mm, 2 μm) column; mobile phase A (0.1% trifluoracetic acid); B (HPLC grade ethanol); strong needle wash = HPLC grade ethanol; 0.5 mL min−1 used as the rate of pump flow; injection volume 5 μL; column temperature 35 °C ± 1; detection wavelength 270 nm.2.4. Preparation
![[thin space (1/6-em)]](https://www.rsc.org/images/entities/char_2009.gif) :
:![[thin space (1/6-em)]](https://www.rsc.org/images/entities/char_2009.gif) 40 v/v). The purity of the ISD and HDZ drug substances utilized was 98.0 to 102% for both drugs. Three replicates of a sample solution containing a defined concentration of ISD and HDZ were produced to determine the linearity. They were diluted to the concentrations of about 10, 20, 30, 40, 50, and 60 μg mL−1 for ISD and 18.75, 37.5, 56.25, 75, 93.75, and 112.5 μg mL−1 for HDZ. A concentration range (between 40 and 75 μg mL−1) was chosen based on the marketed formulation within the range, and solutions for accuracy and precision were developed (80, 100, and 120% target concentration). The accuracy and repeatability accessed using the solutions derived from linearity were applied (three replicates).
40 v/v). The purity of the ISD and HDZ drug substances utilized was 98.0 to 102% for both drugs. Three replicates of a sample solution containing a defined concentration of ISD and HDZ were produced to determine the linearity. They were diluted to the concentrations of about 10, 20, 30, 40, 50, and 60 μg mL−1 for ISD and 18.75, 37.5, 56.25, 75, 93.75, and 112.5 μg mL−1 for HDZ. A concentration range (between 40 and 75 μg mL−1) was chosen based on the marketed formulation within the range, and solutions for accuracy and precision were developed (80, 100, and 120% target concentration). The accuracy and repeatability accessed using the solutions derived from linearity were applied (three replicates).3. Results and discussion
Developing an analytical method by keeping intact GAC principles was a revolutionary ideology for a sustainable, eco-friendly method. However, the development of a green analytical method without applying the AQbD approach may suffer from method performances and needs revalidation. Application of these principles together in the UPLC method helps to enhance the method stability, along with sustainability. So, we have combined these three combinations of approaches to develop an eco-friendly and robust method. The whole process of developing this innovative method is as follows.3.1. Selection of solvent
During the method development phase, the preparation of samples has proved to be a significant stumbling block. ISD and HDZ are soluble in a wide variety of solvents often used in reverse phase liquid chromatography (RPLC) sample preparation, including methanol (MeOH), acetone, ether, chloroform acetonitrile (ACN), and water. However, employing these hazardous solvents leads to environmental complexities and impairs the principles of green analytical chemistry, so the solvent used in the approach was limited to the less hazardous organic solvent ethanol. The initial attempt made to dissolve ISD and HDZ with 100% ethanol as a solvent showed a complete solubility of the two drugs, and we intended to optimize the water content of the solvent to decrease organic solvent wastage, which is another GAC principle. 50% ethanol was utilized as a solvent, but failed to solubilize these drugs. However, ISD and HDZ dissolved well when we added 70% ethanol to the flask, even at high concentrations of 4 mg mL−1. Subsequently, certain solubility issues were observed with 70% ethanol as a solvent. After a week at ambient temperature, crystals began to form. Additional solvent testing was conducted using ethanol and buffer (the same one used in UPLC), rather than water. Initially, ethanol-0.1% TFA (40![[thin space (1/6-em)]](https://www.rsc.org/images/entities/char_2009.gif) :
:![[thin space (1/6-em)]](https://www.rsc.org/images/entities/char_2009.gif) 60, v/v) was employed as a mobile phase, but this was altered to ethanol-0.1% TFA (60
60, v/v) was employed as a mobile phase, but this was altered to ethanol-0.1% TFA (60![[thin space (1/6-em)]](https://www.rsc.org/images/entities/char_2009.gif) :
:![[thin space (1/6-em)]](https://www.rsc.org/images/entities/char_2009.gif) 40, v/v) due to observation of noise in the chromatogram.
40, v/v) due to observation of noise in the chromatogram.
3.2. Method scouting
Even though there are few existing HPLC17,18,20,21 methods for ISD and HDZ as in the literature, they frequently fail for method adoption due to the need for continuous revalidation, and thus are not environmentally sustainable due to the usage of MeOH and ACN as a mobile phase. The first time, we have developed an environmentally friendly method, and conducted a few preliminary experiments to determine the viability of the method's development and its application to the evaluation of these pharmaceuticals. Different one-factor-at-a-time (OFAT) studies were used as part of the technique scouting. The RP-LC method was chosen due to the molecule's properties and structure. The method was developed with the following parameters: mobile phase A is 0.1% orthophosphoric acid (v/v); mobile phase B is ethanol (60![[thin space (1/6-em)]](https://www.rsc.org/images/entities/char_2009.gif) :
:![[thin space (1/6-em)]](https://www.rsc.org/images/entities/char_2009.gif) 40 v/v); Kinetex phenyl hexyl (50 × 4.6 mm, 2.6 μm) column; column temperature set to 50 °C; flow rate 0.7 mL min; detection wavelength 270 nm; isocratic elution. It shows an improper peak shape, resolution with substantial fronting and also lacks reproducibility. For LC, a single ionized state is required at the set pH to avoid tailing/fronting, which may happen if the molecule shifted between a single ionized state to another type when the set mobile phase pH and substances, due to ionization affecting the substance's retention upon stationary phase.
40 v/v); Kinetex phenyl hexyl (50 × 4.6 mm, 2.6 μm) column; column temperature set to 50 °C; flow rate 0.7 mL min; detection wavelength 270 nm; isocratic elution. It shows an improper peak shape, resolution with substantial fronting and also lacks reproducibility. For LC, a single ionized state is required at the set pH to avoid tailing/fronting, which may happen if the molecule shifted between a single ionized state to another type when the set mobile phase pH and substances, due to ionization affecting the substance's retention upon stationary phase.
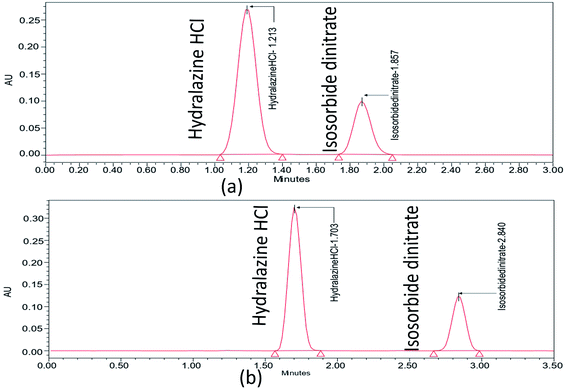
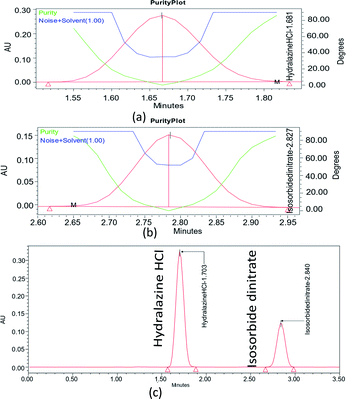
Further choosing trifluoroacetic acid as the buffer, as part of a trial based on the literature with no pictograms and being a more environmentally friendly option, is the isocratic procedure that was expanded to ascertain the organic phase concentration in the mobile phase at which ISD and HDZ elute. The ISD and HDZ substances' peak shapes were significantly enhanced. Additionally, the degradation peaks were successfully isolated from the ISD and HDZ peaks. At this point, a stationary phase, Phenomenex C18 (50 × 2.1 mm, 2 μm), was also tested with a smaller particle size. It was chosen to continue analyzing the separation of ISD and HDZ from the previous one (Fig. 2). It produced sharp peaks and also gave a better resolution between ISD and HDZ in similar conditions. We further evaluated the method utilizing the degraded samples from the degradation trials from the ISD and HDZ drug solution, with the primary goal of increasing the selectivity between ISD and HDZ, its degradation products. Two columns were used to test the degradation samples: Kinetex phenyl hexyl and Phenomenex C18.
The form of the ISD and HDZ peaks appeared to be improved when utilizing a Phenomenex C18 column, and the separation of various degradation products appeared to be improved. Certain peaks eluted very early, with little retention, but a better ratio factor based on the properties of degraded peaks. The effect of the composition of the mobile phase was examined. Ethanol increased the peak shape of the substances and the separation of active pharmaceutical ingredients from degraded products. The pump flow and column temperature at start-up were fairly high (0.7 mL min−1 and 50 °C, respectively). A high temperature can significantly shorten the column's lifespan. As a result, the pumping flow rate and the temperature were reduced to increase the column lifetime (0.5 mL min−1 and 35 °C, respectively). Temperature changes have an effect on the optimization data. The procedure duration was increased to sufficiently elute all degradation products, but was kept at 3.5 minutes to minimize solvent wastage.
3.3. Identification of the analytical target profile
The Analytical Target Profile (ATP) summarizes the estimation criteria for quality attributes to meet by an analytical method. The elements of ATP for the present method were set, as determining ISD and HDZ simultaneously in the bulk and tablet dosage form using UPLC-PDA was set as a target analyte, and the stability-indicating assay method with green analytical principles was set as target method application. Finally, the UPLC approach with PDA detection was selected as the analytical technique based on ATP. The Critical Material Attributes (CMA) were chosen as the resolution, theoretical plates, and second peak retention time.3.4. Preliminary risk assessment
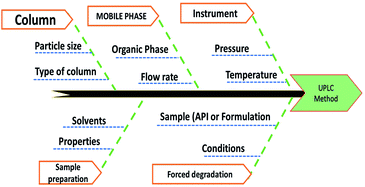
Method risk assessment was characterized based on the “Ishikawa” fishbone diagram (Fig. 3). The following CMPs were defined as having an impact on the CMAs![[thin space (1/6-em)]](https://www.rsc.org/images/entities/char_2009.gif) :
:![[thin space (1/6-em)]](https://www.rsc.org/images/entities/char_2009.gif) organic modifier concentration in the mobile phase, sample solvent, column temperature, and mobile phase flow rate. The sample solvent was vital because an accurate determination of the drug substances depends on its total solubility warranted. Nevertheless, it was tested independently of the LC method development, resulting in the used solvent that was suitable regardless of composition variation. As a consequence, it was omitted from the AQbD procedure. Although the temperature of the column has minimal effect; nonetheless, it is not negligible. Regarding its impact on the method efficiency, it might vary significantly. We found that the knowledge about the parameter interactions would be beneficial, and thus designated the column temperature as potentially essential for further study. Generally, the pump flow is closely restricted and therefore is not considered essential. It may, however, exhibit substantial parameter interaction when combined with the percentage of organic modifiers in the mobile process. As such, it was incorporated into the CMPs that were chosen. Finally, the percentage of organic modifiers in the mobile phase, the column temperature, and the flow rate all significantly impact the method's output (CMAs) in terms of the resolutions, HDZ theoretical plates, and ISD retention time.
organic modifier concentration in the mobile phase, sample solvent, column temperature, and mobile phase flow rate. The sample solvent was vital because an accurate determination of the drug substances depends on its total solubility warranted. Nevertheless, it was tested independently of the LC method development, resulting in the used solvent that was suitable regardless of composition variation. As a consequence, it was omitted from the AQbD procedure. Although the temperature of the column has minimal effect; nonetheless, it is not negligible. Regarding its impact on the method efficiency, it might vary significantly. We found that the knowledge about the parameter interactions would be beneficial, and thus designated the column temperature as potentially essential for further study. Generally, the pump flow is closely restricted and therefore is not considered essential. It may, however, exhibit substantial parameter interaction when combined with the percentage of organic modifiers in the mobile process. As such, it was incorporated into the CMPs that were chosen. Finally, the percentage of organic modifiers in the mobile phase, the column temperature, and the flow rate all significantly impact the method's output (CMAs) in terms of the resolutions, HDZ theoretical plates, and ISD retention time.
3.5. Method optimization
The risk assessment method identified the optimal organic phase concentration (60%), a flow rate of 0.5 min mL−1, and temperature of 35.07 ± 1 °C as the most promising with Phenomenex C18 (50 × 2.1 mm, 2 μm), column; and a mobile phase composition of 0.1% TFA and ethanol (40![[thin space (1/6-em)]](https://www.rsc.org/images/entities/char_2009.gif) :
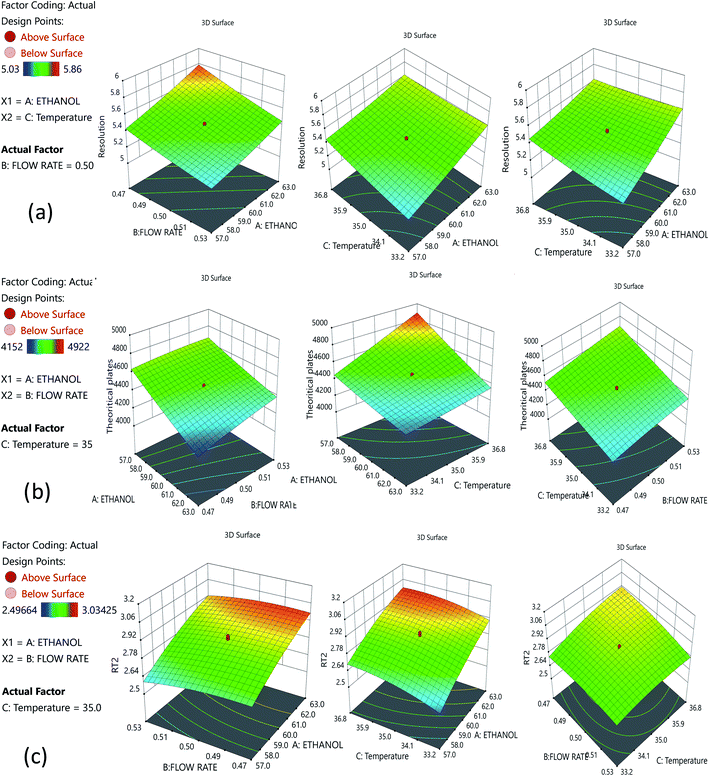
:![[thin space (1/6-em)]](https://www.rsc.org/images/entities/char_2009.gif) 60). A reduced run time results in reduced mobile phase usage, improved laboratory time management, and waste management in adherence with GAC principles, enabling higher efficiency of analysis. Following that, we used DoE that included all of the relevant CMPs, and tracked their outcome solely on CMAs in order to analyze the required method model equations. A rotatable central composite design with a quadratic design model was used. The following parameters were chosen for the DoE analysis built on the initial method risk assessment; percentage of ethanol, column temperature (32–38 °C), and flow rate (0.45–0.55 mL min−1). The following parameters were chosen: resolution between two drugs >1.5; theoretical plates of the HDZ more than 3000; and retention time of the second drug. The process model equations were estimated and statistically validated using ANOVA based on the DoE results (Table 1) with each model coefficient evaluated. The model coefficients used in this portion are statistically significant (P values < 0.0001). Additionally, the F-ratios indicate the importance of each coefficient in the model. Higher R2 values and low lack-of-fit (LOF) values indicate a well-fitting model, whereas higher F-ratios indicate statistical significance for the analytical model equation. The contour plots for the A, B, and C interactions are depicted in Fig. 4.
60). A reduced run time results in reduced mobile phase usage, improved laboratory time management, and waste management in adherence with GAC principles, enabling higher efficiency of analysis. Following that, we used DoE that included all of the relevant CMPs, and tracked their outcome solely on CMAs in order to analyze the required method model equations. A rotatable central composite design with a quadratic design model was used. The following parameters were chosen for the DoE analysis built on the initial method risk assessment; percentage of ethanol, column temperature (32–38 °C), and flow rate (0.45–0.55 mL min−1). The following parameters were chosen: resolution between two drugs >1.5; theoretical plates of the HDZ more than 3000; and retention time of the second drug. The process model equations were estimated and statistically validated using ANOVA based on the DoE results (Table 1) with each model coefficient evaluated. The model coefficients used in this portion are statistically significant (P values < 0.0001). Additionally, the F-ratios indicate the importance of each coefficient in the model. Higher R2 values and low lack-of-fit (LOF) values indicate a well-fitting model, whereas higher F-ratios indicate statistical significance for the analytical model equation. The contour plots for the A, B, and C interactions are depicted in Fig. 4.
| Critical material attributes | Coefficient of the coded equation | P-Value | F-Value | Fit statistics |
|---|---|---|---|---|
| Resolution | +5.4399 | <0.0001 | 181.59 | R2 = 0.9939 |
| 0.15286 (A) | <0.0001 | 695.20 | Adjusted R2 = 0.9884 | |
| −0.14315 (B) | <0.0001 | 609.73 | Predicted R2 = 0.9682 | |
| 0.06989 (C) | <0.0001 | 145.36 | Std. Dev. = 0.0214 | |
| −0.02720 (A × B) | 0.0049 | 12.90 | Mean = 5.47 | |
| −0.06672 (A × C) | <0.0001 | 77.59 | C.V.% = 0.3916 | |
| 0.06577 (B × C) | <0.0001 | 75.40 | Lack of fit | |
| 0.01602 (A2) | 0.0176 | 8.06 | P = 0.3211 | |
| 0.01248 (B2) | 0.0514 | 4.89 | F = 1.55 | |
| 0.01659 (C2) | 0.0148 | 8.64 | ||
| Theoretical plates for HDZ | 4472.3271 | <0.0001 | 441.32 | R2 = 0.9975 |
| −183.4680 (A) | <0.0001 | 2180.97 | Adjusted R2 = 0.9952 | |
| 59.01978 (B) | <0.0001 | 225.70 | Predicted R2 = 0.9877 | |
| 135.7003 (C) | <0.0001 | 1193.14 | Std. Dev. = 14.52 | |
| 42.94543 (A × B) | <0.0001 | 70.00 | Mean = 4472.56 | |
| −84.0680 (A × C) | <0.0001 | 268.24 | C.V.% = 0.3246 | |
| 18.2892 (B × C) | 0.0052 | 12.70 | Lack of fit | |
| 9.93163 (A2) | 0.0266 | 6.74 | P = 0.4068 | |
| −12.988 (B2) | 0.0068 | 11.53 | F = 1.25 | |
| 3.40244 (C2) | 0.3945 | 0.7915 | ||
| The retention time of ISD | 2.8565 | <0.0001 | 354.75 | R2 = 0.9969 |
| 0.1589 (A) | <0.0001 | 2461.24 | Adjusted R2 = 0.9941 | |
| −0.0348 (B) | <0.0001 | 118.67 | Predicted R2 = 0.9946 | |
| 0.05409 (C) | <0.0001 | 285.15 | Std. Dev. = 0.0118 | |
| 0.00609 (A × B) | 0.1758 | 2.12 | Mean = 2.79 | |
| −0.01127 (A × C) | 0.0225 | 7.26 | C.V.% = 0.4236 | |
| −0.03642 (B × C) | <0.0001 | 75.74 | Lack of fit | |
| −0.03183 (A2) | <0.0001 | 104.21 | P = 0.9973 | |
| −0.02509 (B2) | <0.0001 | 64.74 | F = 0.051 | |
| −0.0342 (C2) | <0.0001 | 120.30 |
3.6. Method operable design region
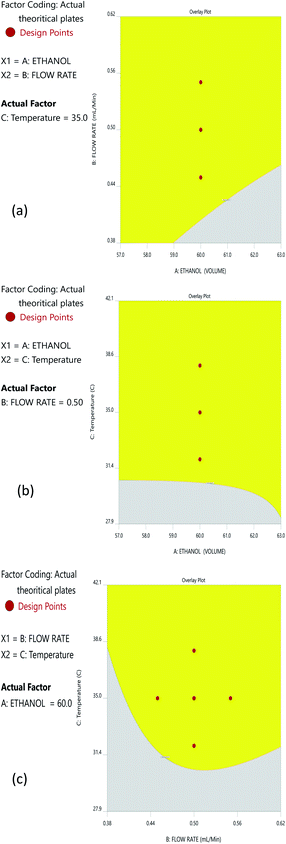
The Method Operable Design Region (MODR), alternatively referred to as the control space, was developed using CMA models and robustness simulations. Fig. 5 portrays the contour plots for various combinations of CMAs in the DoE region for the optimized method, which can also be called a desirability region. MODR values for robustness are as follows: flow rate at 0.45 to 0.55 mL min; column temperature at 32–38 °C. The optimal variance in the mobile phase percentage is ±5%. Within MODR, an optimal working point was selected, which is as follows: flow rate is 0.5 mL min; column temperature at 34.609 °C. At the working period, the projected CMAs were Rs is 5.425, N is 4442, and RT2 is 2.843. At the practically executed, the real CMAs were Rs at 5.413, N is 4429, and RT2 at 2.84. The overlay plots for the optimized plots indicate that the yellow region is the range that does not require any revalidation further with each interaction, and is depicted in Fig. 6.3.7. Method validation
The accuracy, precision, linearity, and repeatability of the developed method were tested at the chosen working point by assessing the stability of ISD and HDZ. The method was validated in accordance with the ICH Q2 (R1) guidelines. Validation for the ISD and HDZ solutions was prepared in the manner defined in Section 2.4.2.| Parameter | ISD | HDZ |
|---|---|---|
| Concentration (μg mL−1) | 10 to 60 | 18.75 to 112.5 |
| Regression equation | 26![[thin space (1/6-em)]](https://www.rsc.org/images/entities/char_2009.gif) 411.1886x + 442.4000 411.1886x + 442.4000 |
31![[thin space (1/6-em)]](https://www.rsc.org/images/entities/char_2009.gif) 588.4617x + 602.5333 588.4617x + 602.5333 |
| R2 | 0.9998 | 0.9992 |
| Sample size | 6 | 6 |
| LOD (μg mL−1) | 0.923112691 | 0.549820152 |
| LOQ (μg mL−1) | 2.797311184 | 1.666121672 |
The correlation coefficient (R2) should not be less than 0.998 to define the criterion of linearity. Correlation coefficients (R2) greater than 0.998 were observed in Fig. 8. As a result, the analytical procedure was linear over this concentration range.
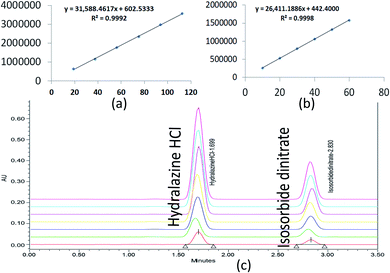 | ||
| Fig. 8 Linearity graphs for ISD (a), HDZ (b), and chromatographic overlay plot for ISD and HDZ in various linear concentrations. | ||
3.7.2.1. Limit of quantification and detection (LOQ and LOD). ISD and HDZ LOQ and LOD values were calculated using a signal-to-noise ratio approach in accordance with ICH guidelines, and practically executed LOQ and LOQ solutions in the UPLC.
| Drug | Amount | Amt found | % Recovery | Mean | Repeatability % RSD |
|---|---|---|---|---|---|
| ISD | 20 | 20.32 | 101.6 | 100.85 ± 0.901 | 0.893 |
| 20 | 19.97 | 99.85 | |||
| 20 | 20.22 | 101.1 | |||
| 40 | 40.37 | 100.93 | 101.27 ± 0.507 | 0.501 | |
| 40 | 40.74 | 101.85 | |||
| 40 | 40.41 | 101.03 | |||
| 60 | 60.96 | 101.6 | 99.89 ± 1.638 | 1.6407 | |
| 60 | 59.84 | 99.73 | |||
| 60 | 59 | 98.33 | |||
| HDZ | 37.5 | 37.8 | 100.8 | 100.54 ± 1.444 | 1.436 |
| 37.5 | 38.19 | 101.84 | |||
| 37.5 | 37.12 | 98.99 | |||
| 75 | 75.66 | 100.88 | 100.52 ± 1.046 | 1.0408 | |
| 75 | 74.51 | 99.35 | |||
| 75 | 76.01 | 101.35 | |||
| 112.5 | 112.67 | 100.15 | 99.40 ± 0.992 | 0.998 | |
| 112.5 | 112.25 | 99.78 | |||
| 112.5 | 110.56 | 98.28 |
The system, intermediate, and method precision results indicated that the method is accurate within reasonable limits for both solutions. The tailing factor, % RSD, and a number of theoretical plats were calculated; all of the outcomes were within acceptable limits. Table 3 shows that the acceptable precision for the RSD was less than 2.0%.
3.8. Forced degradation of ISD and HDZ
Forced degradation tests were undertaken on the ISD and HDZ drug combinations. The 0.1 M NaOH, 0.1 M HCl, 0.3% H2O2, and UV light were picked as a primary stress condition. This gave reliable information regarding the stability of ISD and HDZ. No drug was degraded instantly after adding the acid, base, or peroxide, allowing it to stand for 1, 3, and 6 h. The study report after 1 and 3 h has not shown a noticeable degradation, and thus the samples were allowed to stand for 6 h. It was found that the drugs tend to degrade at this time, and the results and the degradation peaks are portrayed in Table 4 and Fig. 9.| Conditions | Drug area | % Drug recovery | % Drug degradation | |||
|---|---|---|---|---|---|---|
| ISD | HDZ | ISD | HDZ | ISD | HDZ | |
| Acid | 1![[thin space (1/6-em)]](https://www.rsc.org/images/entities/char_2009.gif) 251 251![[thin space (1/6-em)]](https://www.rsc.org/images/entities/char_2009.gif) 843 843 |
2![[thin space (1/6-em)]](https://www.rsc.org/images/entities/char_2009.gif) 234 234![[thin space (1/6-em)]](https://www.rsc.org/images/entities/char_2009.gif) 263 263 |
99.434 | 86.462 | 0.5654 | 13.53 |
| Alkali | 1![[thin space (1/6-em)]](https://www.rsc.org/images/entities/char_2009.gif) 087 087![[thin space (1/6-em)]](https://www.rsc.org/images/entities/char_2009.gif) 853 853 |
2![[thin space (1/6-em)]](https://www.rsc.org/images/entities/char_2009.gif) 185 185![[thin space (1/6-em)]](https://www.rsc.org/images/entities/char_2009.gif) 874 874 |
86.408 | 84.587 | 13.591 | 15.412 |
| Peroxide | 1![[thin space (1/6-em)]](https://www.rsc.org/images/entities/char_2009.gif) 042 042![[thin space (1/6-em)]](https://www.rsc.org/images/entities/char_2009.gif) 272 272 |
2![[thin space (1/6-em)]](https://www.rsc.org/images/entities/char_2009.gif) 125 125![[thin space (1/6-em)]](https://www.rsc.org/images/entities/char_2009.gif) 988 988 |
82.788 | 82.270 | 17.21 | 17.729 |
| Photo | 1![[thin space (1/6-em)]](https://www.rsc.org/images/entities/char_2009.gif) 148 148![[thin space (1/6-em)]](https://www.rsc.org/images/entities/char_2009.gif) 252 252 |
2![[thin space (1/6-em)]](https://www.rsc.org/images/entities/char_2009.gif) 217 217![[thin space (1/6-em)]](https://www.rsc.org/images/entities/char_2009.gif) 951 951 |
91.206 | 85.828 | 8.793 | 14.171 |
| Control | 1![[thin space (1/6-em)]](https://www.rsc.org/images/entities/char_2009.gif) 258 258![[thin space (1/6-em)]](https://www.rsc.org/images/entities/char_2009.gif) 962 962 |
2![[thin space (1/6-em)]](https://www.rsc.org/images/entities/char_2009.gif) 584 584![[thin space (1/6-em)]](https://www.rsc.org/images/entities/char_2009.gif) 152 152 |
100 | 100 | 0 | 0 |
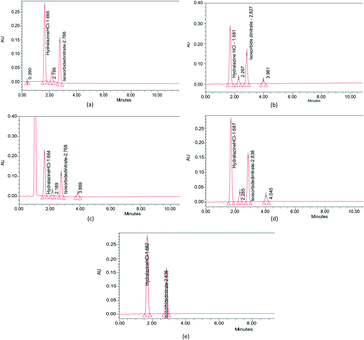 | ||
| Fig. 9 Forced degradation studies of ISD and HDZ in (a) 0.1 M HCl, (b) 0.1 M NaOH, (c) 3% H2O2, (d) photodegradation in UV light, and (e) control without any stress. | ||
3.9. Assay of marketed formulation
As shown in Table 5, the test results indicated an optimum percentage of ISD and HDZ in the Isolazine tablets. This demonstrates the selectivity of the technique for determining ISD and HDZ in tablets, where the results were good and achieved without any detected interference from the excipients. Additionally, the result was compared to the developed HPLC technique using the student t- and F-tests, and was determined to have the best results. The suggested approach is successfully used to determine the presence of ISD and HDZ in the tablets.| t-Test: two-sample assuming unequal variances | ||||
|---|---|---|---|---|
| ISD | HDZ | |||
| Variable 1 | Variable 2 | Variable 1 | Variable 2 | |
| Mean | 99.70666 | 99.1733 | 99.91 | 99.053 |
| Variance | 0.1132 | 0.02003 | 0.0997 | 0.0305 |
| Observations | 3 | 3 | 3 | 3 |
| Hypothesized mean difference | 0 | 0 | ||
| df | 3 | 3 | ||
| t stat | 2.5304 | 4.1116 | ||
| P(T ≤ t) one-tail | 0.04269 | 0.01302 | ||
| t critical one-tail | 2.35336 | 2.35336 | ||
| P(T ≤ t) two-tail | 0.08539 | 0.02605 | ||
| t critical two-tail | 3.18244 | 3.1824 | ||
| F-Test two-sample for variances | ||||
|---|---|---|---|---|
| Mean | 99.70666667 | 99.173 | 99.91 | 99.0533 |
| Variance | 0.113233333 | 0.02003 | 0.0997 | 0.03053 |
| Observations | 3 | 3 | 3 | 3 |
| df | 2 | 2 | 2 | 2 |
| F | 5.6522 | 3.2652 | ||
| P(F ≤ f) one-tail | 0.15032 | 0.23445 | ||
| F critical one-tail | 19 | 19 | ||
3.10. Wastage recycling
Method development and validation have utilized an enormous amount of solvent and generated waste, approximately 500 mL, including the mobile phase for analysis, washing the column, and solvents used for other purposes of analysis. Among this, the major part of the generated waste is around 70% ethanol, 0.1% TFA, and remaining water. So, we aimed to recycle this wasted ethanol by using a simple distillation process and regenerated the waste, and helped Mother Earth from further pollution. Although ethanol falls under the category of a bio-degradable solvent, wastage recycling is a fundamental principle in the GAC principles. The distilled ethanol was further cross-checked for its purity by using the UV spectrophotometry across the UV region (200–400 nm) using HPLC grade ethanol as a blank (Fig. 10). With the help of UPLC, we also found no impurities in the distilled ethanol, which was further marked and utilized for the analysis of drugs.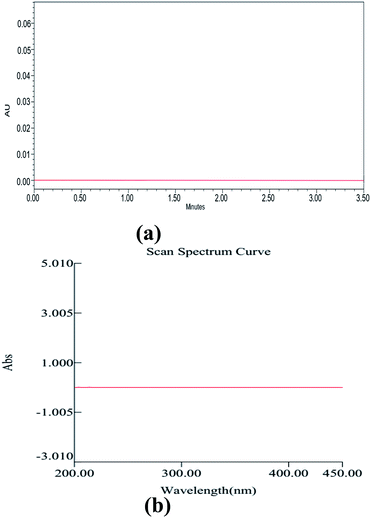 | ||
| Fig. 10 UPLC chromatogram (a) and UV spectrum of ethanol after distillation using HPLC grade ethanol as a blank. | ||
3.11. Green assessment for the developed method
The method combines tri-combinations for the analysis of two drugs. Among these three, every aspect has its equal importance in method development. In this contest, a developed method simply cannot claim it as eco-friendly without evaluation using proper assessment tools. Here, the method was evaluated by using 5 assessment tools called the National Environmental Methods Index (NEMI), Eco-scale Assessment (ESA), Green Analytical Procedure Index (GAPI), Analytical Method Greenness Score (AMGS), and Analytical GREEnness Metric (AGREE), and assessed the method greenness. Each tool has its own set of benefits, drawbacks, and evaluation process. The final data acquired from each evaluation tool may lead to a different conclusion on which approach is the greenest, and choosing which evaluation technique to use. However, although different tools were used in this method assessment process, all of the tools showed their results in a single path that is eco-friendly and greenest. The evaluation of the method was done as follows:NEMI is a classical qualitative assessment tool developed for evaluating green chemistry. Initially, it is the only tool used for the evaluation of the GAC methods. Although new assessment tools were developed for the GAC, NEMI has its advantages in assessing the green analytical method. NEMI is represented by a color-coding (green and colorless) circular pictogram, which is divided into four quadrants. Each quadrant has its own assessing criteria, like quadrant one deals with the list of chemicals issued by the Environmental Protection Agency's (EPA) Toxic Regulatory Inventory25 (TRI) list of Persistent Bioaccumulative Toxic (PBT) chemicals. The chemicals used in this method have not been listed in PBT, so this quadrant is coded as a green color. The second quadrant deals with hazardous chemicals, which are under the Resource Conservation and Recovery Act26 (RCRA) by EPA.
In the same way, the chemicals listed in the RCRA list were present in this method, so the second quadrant is coded with a green color. The third quadrant deals with the pH of the solutions used for analysis, which should be between 2 and 12 to make this quadrant green, and the mobile phase pH used in the method was under the range, so the third quadrant was coded as a green color. Finally, the fourth quadrant deals with wastage, as the total wastage should be less than 50 g or mL. In this method, the wastage is negligible due to incorporating the recycling procedure, so the third quadrant was coded as a green color. The overall NEMI pictogram of the method is depicted in Fig. 11.
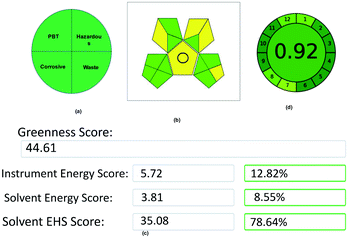 | ||
| Fig. 11 Green assessment results for the proposed method: (a) NEMI, (b) GAPI, (c) AMGS, and (d) AGREE metrics. | ||
| Solvent energy calculation | ||||
|---|---|---|---|---|
| Solvents | Pictogram | GSH signal word | Amount of solvent | subtotal |
| Ethanol | 2 | Danger | 10–100 mL | 4 |
| TFA | 0 | 0 | 1 | 0 |
| Water | 0 | 0 | 0 | 0 |
| Instrumental PP calculation | ||||
| Energy | For UPLC ≤ 0.1 kW h per sample | 0 | ||
| Occupational hazard (OH) | No OH due to use of bio solvent and hermitization process | 0 | ||
| Wastage and recycling | 0–10 mL | 0 | ||
| Total PP | 4 | |||
| AES | 96 | |||
Although five assessment tools used different strategies or procedures for assessing the method greenness, the overall goal was to determine the method's sustainability. All of the methods, irrespective of their strategies, suggested that this method is eco-friendly and adaptable for future green analysis without any hurdles by their results.
4. Conclusion
The study's primary objective was to develop a GAC-based stability-indicating RP-UPLC technique to detect ISD and HDZ in the bulk and pharmaceutical dosage forms. To achieve this, AQbD was applied to develop a method that can be used for long-term utility without further revalidation. By the MODR, a resilient method area was proposed with a flow rate at 0.45–0.55 mL min−1, column temperature at 32–38 °C, and ethanol variation of 5%. By the mathematical model, we acquired a deeper grasp of the implications of the method parameters on the results. When executed, the developed method found the shortest runtime of 3.5 min and good resolution between the two drugs by 5.4. The degradation peaks generated after forced degradation studies also show a better resolution, and separation of ISD and HDZ from the degradation products using the proposed LC technique. The devised analytical technique was verified in terms of the reproducibility, accuracy, sensibility, and linearity at the designated working point, and found to be within limits. Finally, the method was validated using five green assessment tools called NEMI, GAPI, Analytical Eco-Scale (96), AMGS (44.61), and AGREE metrics (0.92), and found to have the best eco-friendly results. The application of waste recycling makes this method stands alone due to zero wastage of the organic phase, and helps the environment from further damage. This method shall also help the quality control departments in the industries and commercial labs in adopting and analyzing these combinations in the bulk and tablet dosage forms. The future prospects of this study may dominate the scientific community to adopt and develop such eco-friendly robust AQbD-based methods for analyzing various chemical substances using green solvents.Conflicts of interest
There are no conflicts to declare.References
- R. A. Sheldon, Chem. Soc. Rev., 2012, 41, 1437–1451 RSC.
- B. V. Badami, Resonance, 2008, 13, 1041–1048 CrossRef CAS.
- P. T. Anastas and J. C. Warner, Green chemistry: theory and practice, Oxford University Press, Oxford, England, New York, 1998 Search PubMed.
- M. Tobiszewski and J. Namieśnik, Current Opinion in Green and Sustainable Chemistry, 2017, 5, 1–4 CrossRef.
- N. Winterton, Green Chem., 2001, 3, G73–G81 RSC.
- P. T. Anastas, Crit. Rev. Anal. Chem., 1999, 29, 167–175 CrossRef CAS.
- J. Płotka, M. Tobiszewski, A. M. Sulej, M. Kupska, T. Górecki and J. Namieśnik, J. Chromatogr. A, 2013, 1307, 1–20 CrossRef PubMed.
- D. Prat, O. Pardigon, H.-W. Flemming, S. Letestu, V. Ducandas, P. Isnard, E. Guntrum, T. Senac, S. Ruisseau, P. Cruciani and P. Hosek, Org. Process Res. Dev., 2013, 17, 1517–1525 CrossRef CAS.
- C. M. Alder, J. D. Hayler, R. K. Henderson, A. M. Redman, L. Shukla, L. E. Shuster and H. F. Sneddon, Green Chem., 2016, 18, 3879–3890 RSC.
- A. D. Curzons, D. C. Constable and V. L. Cunningham, Clean Products and Processes, 1999, 1, 82–90 Search PubMed.
- S. Beg, J. Haneef, M. Rahman, R. Peraman, M. Taleuzzaman and W. H. Almalki, in Handbook of Analytical Quality by Design, Academic Press, 2021, pp. 1–14 Search PubMed.
- The merck index online, Isosorbide dinitrite, https://www.rsc.org/Merck-Index/monograph/m6541?q=unauthorize.
- The merck index online, Hydralazine, https://www.rsc.org/Merck-Index/monograph/m6072?q=unauthorize.
- R. T. Cole, A. P. Kalogeropoulos, V. V. Georgiopoulou, M. Gheorghiade, A. Quyyumi, C. Yancy and J. Butler, Circulation, 2011, 123, 2414–2422 CrossRef PubMed.
- A. L. Taylor, S. Ziesche, C. Yancy, P. Carson, R. J. D'Agostino, K. Ferdinand, M. Taylor, K. Adams, M. Sabolinski, M. Worcel and J. N. Cohn, N. Engl. J. Med., 2004, 351, 2049–2057 CrossRef CAS PubMed.
- P. Khazanie, L. Liang, L. H. Curtis, J. Butler, Z. J. Eapen, P. A. Heidenreich, D. L. Bhatt, E. D. Peterson, C. W. Yancy, G. C. Fonarow and A. F. Hernandez, Circ.: Heart Failure, 2016, 9, e002444 CAS.
- T. A. S. S. K. Mastannama, Res. J. Pharm. Technol., 2015, 8, 59 CrossRef.
- G. Santhosh, G. Nagasowjanya, A. Ajitha and V. UmaMaheshwaraRao, Int. J. Pharm. Res. Biomed. Anal., 2014, 4, 307–311 Search PubMed.
- E. R. S. Mastanamma, P. Saidulu and A. Sravanthi, SciFed Journal of Chemical Research, 2017, 1, 141–148 Search PubMed.
- S. Kassey, R. P. Pulla and K. V. Prakash, Indo Am. J. Pharm. Sci., 2014, 1, 219–229 CAS.
- K. Neelima and Y. R. Prasad, Int. J. Pharma Sci. Res., 2021, 5, 1290–1294 Search PubMed.
- L. M. Pola and S. D. Gowri, World J. Pharm. Pharm. Sci., 2015, 4, 1154–1169 CAS.
- Y. Zhou, A. Liu, R. Jia, M. Wu, N. Wu, C. Liu, Z. Han, H. Hu, H. Wang and Q. He, J. Anal. Methods Chem., 2020, 2020, 1753265 Search PubMed.
- N. Žigart and Z. Časar, ACS Omega, 2020, 5, 17726–17742 CrossRef PubMed.
- US EPA, 2011, 2011, 1–21.
- US EPA, US EPA O. Hazardous Waste, accessed 6 April 2021, https://www.epa.gov/hw.
- NFPA, List of Nfpa codes and standards, accessed 6 April 2021, https://www.nfpa.org/Codes-and-Standards/All-Codes-and-Standards/List-of-Codes-and-Standards.
- J. Płotka-Wasylka, Talanta, 2018, 181, 204–209 CrossRef PubMed.
- A. Gałuszka, Z. M. Migaszewski, P. Konieczka and J. Namieśnik, TrAC, Trends Anal. Chem., 2012, 37, 61–72 CrossRef.
- M. B. Hicks, W. Farrell, C. Aurigemma, L. Lehmann, L. Weisel, K. Nadeau, H. Lee, C. Moraff, M. Wong, Y. Huang and P. Ferguson, Green Chem., 2019, 21, 1816–1826 RSC.
- F. Pena-Pereira, W. Wojnowski and M. Tobiszewski, Anal. Chem., 2020, 92, 10076–10082 CrossRef CAS PubMed.
- K. S. Kokilambigai and K. S. Lakshmi, Green Chem. Lett. Rev., 2021, 14, 99–107 CrossRef CAS.
| This journal is © The Royal Society of Chemistry 2021 |

