 Open Access Article
Electrochemical characterization of and theoretical insight into a series of 2D MOFs, [M(bipy)(C4O4)(H2O)2]·3H2O (M = Mn (1), Fe (2), Co (3) and Zn (4)), for chemical sensing applications†
Yi-Ting Hsieh *a,
Ssu-Chia Huanga,
Shih-I. Lu*a,
Hsiao-Hsun Wanga,
Tsai-Wen Changa,
Chih-Chieh Wang
 *a,
Gene-Hsiang Leeb and
Yu-Chun Chuangc
aDepartment of Chemistry, Soochow University, Taipei, Taiwan. E-mail: ccwang@scu.edu.tw
bInstrumentation Center, National Taiwan University, Taipei, 10617, Taiwan
cNational Synchrotron Radiation Research Center, Hsinchu, 30076, Taiwan
First published on 2nd August 2021
Abstract
The electrochemical sensing applications of a series of water-stable 2D metal–organic framework (MOF)-modified screen-printed carbon electrodes (SPCEs) are reported. The MOF materials in this study are [M(bipy)(C4O4)(H2O)2]·3H2O, in which bipy = 4,4′-bipyridine and M = Mn, Fe, Co and Zn. The MOF materials are characterized by scanning electron microscopy (SEM) and transmission electron microscopy (TEM), showing that the MOFs have a layer-by-layer rod structure with a smooth surface. We use the nitrofurazone molecule as a probe to investigate the influence of the metal ions of MOFs on electrochemical sensing ability. Cyclic voltammetry demonstrated that the Mn-MOF electrode of interest delivered stronger signals than that of other electrodes. Through first-principles calculations, we also revealed that the change in the spin polarization of divalent metal ions passing from the free ion state to the MOF environment appeared to be significantly correlated with the enhancement in the peak response current. The theoretical and experimental results consistently indicate that Mn-MOF has the smallest bandgap and good sensitivity among these MOF materials. Accordingly, we proposed a simple model to illustrate this observation and disclosed the importance of the electron configuration of the transition metal constructing the MOF materials used in improving electrochemical sensing applications.
Introduction
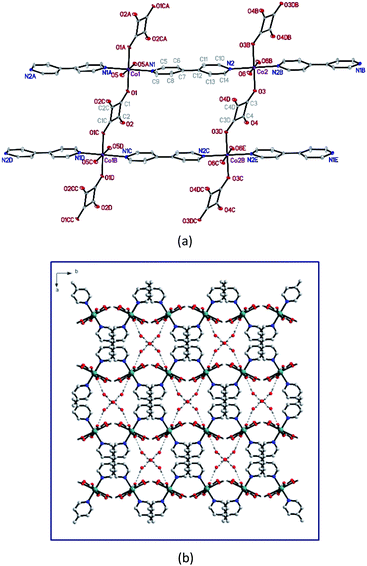
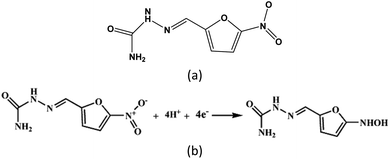
Metal–organic framework (MOF) materials are a class of porous materials consisting of inorganic nodes connected by organic linkers through self-assembled processes.1–3 Electrochemical sensing, such as of pesticides, H2O2 and heavy metal ions,4–6 is a promising application, benefiting from the diversity of structures and constituents of the MOF materials.7,8 However, low quality in both electrical conductivity and mechanical stability in aqueous solution prevented pure MOF materials from being used in the fabrication of electrochemical sensors. Hence, to our knowledge, the MOF materials usually incorporated other functional materials,9–12 such as conducting polymers, metals particles, and reduced graphene oxide (rGO). In these cases, the functional materials increase electrical conductivity, while the organic linkers in the MOFs accumulate the analyte molecules by intermolecular hydrogen bonding and/or π–π interaction.13–15 Nitrofurazone (NFZ) belongs to the family of nitrofurans, which are broad-spectrum antibiotics widely used in animal husbandry and aquaculture. Research has revealed that nitrofurans and their metabolites can cause severe diseases, such as pulmonary fibrosis, hepatic, arthralgia, and hemolysis diseases, after long-term intake. Thus, European Union, the USA and many countries have forbidden the usage of the NFZ. Due to the good curative effect and low cost of nitrofurazone, there is illegal use to treat animal diseases, and drinking water.16–19 Gan et al.16 fabricated the hierarchical hollow cages chromium(III) terephthalate MOF (MIL-101) as an electrochemical sensor to determine the NFZ. Due to the huge specific surface area and adsorptive properties of MIL-101, this material was developed for the highly selective and sensitive determination of NFZ. Wang17 and his co-worker synthesize the zirconium-based metal–organic frameworks (DUT-67) with tubular polypyrrole (T-PPY) and DUT-67/T-PPY MOF composites to sensing the NFZ. The cross-linked network of T-PPY improves the conductivity of the composites, weakens the accumulation of the DUT-67, and exposes more active sites of DUT-67, which increased electrocatalytic activity toward the reduction of nitrofurazone. As mentioned above, these materials show good sensitivity and low detection limit on the electrochemical sensing on NFZ. By contrast, the effect coming from different metal ions got few attentions. Here, we utilized nitrofurazone molecule (Fig. 4(a)) as a model probe to assess the electrocatalytic activity of MOFs. We investigated MOFs-modified electrodes built out of a series of two-dimensional (2D) layered MOF materials of [M(II)(bipy)(C4O4)(H2O)2]·3H2O (designated as Mn-MOF, Fe-MOF, Co-MOF and Zn-MOF, respectively), in which bipy = 4,4′-bipyridine, C4O42− (squarate) = dianion of squric acid and M = Mn, Fe, Co and Zn,20 through electrochemical experiments and first principle calculations. The M(II) in the MOF are distorted octahedrally coordinated by two squarate, two bipy ligands and two water molecules. Each pair of ligands is in trans orientation. The 3D supramolecular networks in the series of the MOFs are assembled by the 2D layered constructors in combined parallel and mutually interpenetrated manners (shown in Fig. 1).20 The four MOFs were constructed from the same organic linkers and crystallized in very similar way. This provides an appropriate testbed to investigate the effect of 3d transition metal ions with inherently different electron configuration on the MOF-modified electrode for electrochemical sensing of aqueous analytes. The series of MOFs are immobilized onto the screen-printed carbon electrode (SPCE) by drop-casting method, and then the response current for the electrochemical reduction of NFZ for the prepared modified electrode are measured through cyclic voltammetry (CV), and differential pulse voltammetry (DPV). At last, we carried out density functional theory (DFT) calculations to investigate the variation of the current response among the four MOFs.Results and discussion
The series of [M(II)(bipy)(C4O4)(H2O)2]·3H2O (designated as Mn-MOF, Fe-MOF, Co-MOF and Zn-MOF, respectively) are iso-structural, in which their 3D supramolecular architectures are constructed via the assembled of 2D layered MOFs M(II) ions bridged by bipy and C4O4− ligands shown in Fig. 1(a) with Co-MOF as the example, in a combined parallel and mutually interpenetrated manners with guest water molecules being intercalated into the 1D channels via the hydrogen bonding interactions among the host frameworks and water molecules (as shown in Fig. 1(b)).20The surface morphologies and the structures of as-synthesized MOF materials in this study were characterized using scanning electron microscopy (SEM) and transmission electron microscopy (TEM), shown in Fig. 2. SEM images showed the layer-by-layer rod structures, revealing that the four MOFs have the same surface construction. For the TEM images of the MOFs, regular rods with good crystallinity were observed, which is consistent with the PXRD powder patterns obtained in previous studies.20
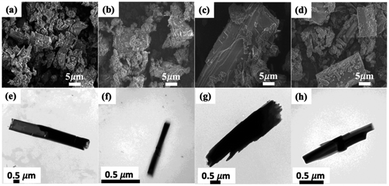 | ||
| Fig. 2 SEM (a–d) and TEM (e–h) images of the as-prepared MOFs. (a and e) Mn-MOF, (b and f) Fe-MOF, (c and g) Co-MOF, (d and h) Zn-MOF. | ||
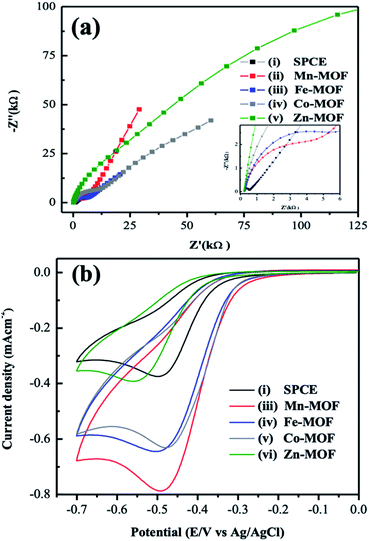
Electrochemical properties of the MOF-modified electrodes of the study were examined by electrochemical impedance spectroscopy (EIS). Results in the solution of 5 mM [Fe(CN)6]3−/4− with 0.1 M KCl were given in Fig. 3. The semicircle diameter is a critical parameter for measuring the charge-transfer resistance (Rp) of the materials, and the [Fe(CN)6]3−/4− complex ion is often as an electron-transfer rate probe to characterize the electrode's surface. The smaller diameter indicates the MOF has low charge-transfer resistance. The diameter is in the order of Zn-MOF SPCE > Co-MOF SPCE > Fe-MOF SPCE > Mn-MOF SPCE > bare SPCE. Because of their low electrical conductivity, the Rp of all MOFs is larger than the bare SPCE (315 Ω). It is interesting to note that the SPCE modified by the Mn-MOF (6.27 kΩ) has smaller Rp compared to others modified electrodes. The relative equivalent circuit of these modified electrodes are added in Fig. S1.† The results indicate that the metal ion of the MOFs has a great influence on the conductivity.
Then the CV measurement was employed to study the electrochemical property of these MOF-modified electrodes toward the reduction of NFZ molecule (Fig. 4(a)) in an aqueous solution. Fig. 3(b) showed the CV curves of as-prepared MOF-modified electrodes. For those recorded on these electrodes, the irreversible reduction peak around −0.5 V came from the reduction of the nitro group (R–NO2) to hydroxylamine (R–NHOH) of the NFZ molecule with four electrons and four protons, shown in Fig. 4(b). Additionally, the CV response on SPCE in PB solution (pH 7) in the absence of NFZ was measured in Fig. S2(a).† No wave related to NFZ reduction is observed, indicating that the obtained cathodic peak arises from NFZ. Though the MOFs appeared poor electrical conductivity demonstrated by the EIS results, as shown in Fig. 3(a), all the MOF-modified electrodes presented a significantly stronger reduction peak between −0.47 and −0.55 V compared to that obtained at a bare SPCE. Relevant experimental data of the CV measurements are listed in Table S1.†
The Mn-MOF-modified SPCE displays the best performance in electrocatalytic activity toward the aqueous NFZ molecule with the largest peak current density of −0.78 mA cm−2. The peak current density coming from the electrodes of study is in the sequence of bare SPCE < Zn-MOF SPCE < Co-MOF SPCE ≈ Fe-MOF SPCE < Mn-MOF SPCE. This inferred the necessary transmission pathways in promoting the rate of electron transfer between the NFZ molecule and the electrode surface is not the only crucial role for a suitable electrochemical sensor. The other possible source of contribution in increasing the CV current response could come from the microporosity of the MOF materials, acting as the so-called microreactors to improve the adsorption of NFZ molecules. However, a comparison of the sizes of NFZ molecule and pore of the MOF rules out this possibility.
It is also possible to attribute the enhancement in peak current to explicit accumulation of the NFZ molecules on the surface of the MOF-modified electrode by hydrogen bonding and/or π–π interactions. Nevertheless, distinction in peak current as to different MOFs considered cannot be explained through taking these intermolecular interactions into account only because the four MOFs were constructed from the same linkers in very similar crystallized way. Apart from the variation of the largest CV response current, it is also of interest to note that the subtle difference (0.02 mA cm−2) in the magnitude of between the Co-MOF and Fe-MOF-modified SPCE though Fe(II) and Co(II) appear d6 and d7 electron configurations, respectively. Therefore we performed first principle calculations to explore possibility for the variations of peak current density across the series of MOFs. Table S2† gave the calculated band gaps of the MOFs by using PBC-HSE06/DZP//Expt calculation. The calculated values of the band gaps were 1.834, 1.841, 2.167 and 2.266 eV for the Mn-MOF, Fe-MOF, Co-MOF and Zn-MOF, respectively. Generally, an insulator is defined by a large band gap, usually in excess of ∼4 eV, which results in very low population of the conduction band. On the other hand, a metal contains at least one band crossing the Fermi level, resulting in a continuum of allowed electronic states that leads to high conductivities. Though a direct comparison of the band gap between experiment and theory is not explicit demonstrated for the cases considered, it is plausible that our single-crystal calculations based on the HSE06 functional point to the nature of semiconductor for the MOF of study.
While trying to establish a relation between the calculated band gap and the experimental peak current, we found a correlation in qualitative way only; that is the corresponding Spearman's rank correlation coefficient is −1. This occurs when each of the variables was a perfect monotone function of the other. However, the subtle difference between those of the Fe-MOF and the Co-MOF cannot be explained quantitatively. The spin polarization is the difference between the number of alpha and beta electrons. The number may be anything, including zero. High spin polarization may be more easily obtained for Mn(II), Fe(II) and Co(II), rather than Zn(II). Table S2† also gave spin polarization of transition metal ions resulting from the Hirshfeld charge population. The spin polarization of free Mn(II), Fe(II), Co(II) and Zn(II) is 5, 4, 3 and 0, respectively. Our calculations revealed that the spin polarization of the central Mn(II), Fe(II) and Co(II) in the MOF environment of study are reduced from those of their free ion spin-polarized state to 4.627, 3.705 and 2.720, respectively. For Zn(II), the spin polarization was not modified by the MOF environment because of its d10 configuration. It was found there is a significantly positive correlation between the peak current density from the CV and the change of spin polarization of metal ion passing from the free ion state to the MOF environment. Fig. 5 showed the correlation of R2 = 0.964. Also, change in spin polarization correctly predicts the subtle distinction in the peak current density between the Fe-MOF and Co-MOF modified electrodes.
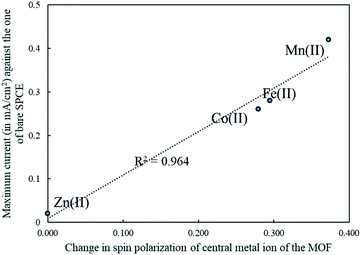 | ||
| Fig. 5 Correlation between the peak current of CV measurement and the change of spin-polarization of metal ion passing from free ion to the MOF environment. | ||
Accordingly, we proposed a simple mechanism. For Mn(II), Fe(II), Co(II) in the MOF, they have available unoccupied spin-down d orbitals that can be populated with electrons transferred from the framework. This framework-to-metal charge transfer hence depopulates the occupied orbitals of the framework and then facilitates electron conduction through the framework. The change of spin polarization of metal ion from the free metal ion state to the MOF environment could be used as an indicator of electronic conductivity of the MOF. At last, the Zn-MOF improved the peak current density less than 5% also implied it accumulated analytes only, did not present electronic effect.
Though the spin polarization is not connected to the electrochemical sensing activity by its virtue, in this work, we used the change in the spin polarization of transition metal, not the spin polarization itself, to indicate that the electron transfer happened from the framework to the metal ion. This transfer gave rise to empty orbitals on the framework to facilitate electron conduction, and then resulted in electrochemical signals generated that are the result of electrochemical reactions between the sensor probe and the analyte.
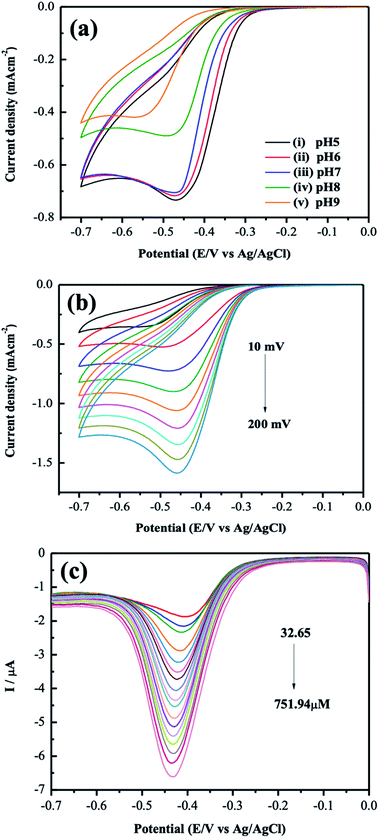
Based on the experimental results presented above, the Mn-MOF modified electrode was chosen for further detection of the NFZ solution. Fig. 6(a) gave the influence of various pH values on electrochemical reduction of NFZ. CV measurement showed that the potential shifted negatively as pH increased. The related peak current versus pH value was plotted in Fig. S3(a).†
The pH = 5 solution gave the maximum peak current density, and the reduction peak current also decreases with increasing the pH value. The result indicates that protons play a vital role during the reduction process, consistent with the mechanism shown in Fig. 4(b). Therefore, the solution of pH = 5 was selected for further investigation of kinetics in which we implemented CV with various scan rates from 10 to 200 mV s−1 in the presence of 0.5 mM NFZ in 0.1 M PB solution (pH 5). The reduction peak potentials change slightly, and the currents gradually increase with increasing scan rates. There is a linear relationship between the square root of the scan rate and the corresponding peak current, as shown in Fig. S3(b).†
Further quantitative analysis of NFZ was performed using differential pulse voltammetry (DPV) in a PBS buffer (pH 5) containing a series of concentrations of NFZ. Fig. 6(c) gave the DPV results. Cathodic peak current increased upon the addition of NFZ and showed a linear relationship with the concentration of NFZ ranging from 32.65 to 751.94 μM (Fig. S3(c)†). The limit of detection (LOD) is 19.8 μM (S/N = 3) with the linear regression equation Ipc (μA) = −6.385C (mM) −1.862 R2 = 0.997. The LOD was calculated using the formula: LOD = 3σ/S, where σ is the standard deviation of the peak current of the sensor in the blank PBS (n = 5), and S is the slope of the calibration curve of NFZ. Though the LOD is not as low as other recent applications incorporating the MOF and other functional materials (Table S3†),17,19,21 our Mn-MOF modified electrode showed a more comprehensive linear range for the detection of NFZ. The influence of potentially interfering substances on the determination of NFZ using the Mn-MOF modified electrode was investigated in Fig. S4(a),† whereas no significant response was observed in the presence of 10-fold higher concentrations of potentially interfering substances such as glucose, ascorbic acid, and dopamine. Thus, the results confirm that the Mn-MOF modified electrode has a satisfactory performance in detection selectivity. The reproducibility and the repeatability of the sensor are discussed in Fig. S4(b and c).† The reproducibility of the proposed sensor was investigated by independently fabricating five electrodes in the same manner and each electrode has measured for five times in 0.5 mM NFZ/0.1 M PB solution (pH 5). The reproducibility for the current response and the relative deviation (RSD) was 1.5%, indicating that the proposed electrode has and acceptable reproducibility. In addition, the stability of the developed electrode was examined by putting the electrode into 0.5 mM NFZ and scanned for eight times. The electrode retained its initial peak current and the RSD for the experiments was 0.56%, indicating the electrode owns good repeatability. This would grant a further study of the competence of our Mn-MOF modified SPCE while combining other functional materials in the detection of NFZ and other analytes of interest in further applications.
Experimental section and method
Synthetic procedures
Materials and methods
Electrochemical measurements
EIS measurements were carried out at their open circuit potential in 5 mM Fe(CN)63−/4−/0.1 M KCl solution, with an amplitude potential of 10 mV and a frequency range of 1 MHz to 0.1 Hz.Cyclic voltammetry (CV) of different MOFs-modified electrodes of determining 0.5 mM NFZ was investigated in 0.1 M PB buffer in the potential range of 0 to −0.7 V (vs. Ag/AgCl), with a scan rate of 50 mV s−1. The quantitative measurement of NFZ was performed on Mn-MOF/SPCE by differential pulse voltammetry (DPV) analysis, with continuously increased concentration of NFZ in the electrochemical cell after being stirred for 1 min. The DPV curves were recorded between 0 and −0.7 V (vs. Ag/AgCl), with amplitude of 25 mV, pulse width of 50 ms, pulse period of 0.1 s, and step potential of 5 mV, respectively. All solutions were purged by N2 and conducted at room temperature under condition.
Conclusions
In the present work, we examine the electrical conductivity of MOF-modified electrodes using a series of four different water-stable MOFs experimentally and theoretically. The prepared modified electrodes gave a stronger peak current than the bare SPCE for the electrochemical reduction of NFZ molecules. They showed a variation with the different metal ions of the MOF. The change in spin polarization of the metal ion was calculated and then used to illustrate the difference in the peak current density. The electrochemical sensing of NFZ suggests that the Mn-MOF-modified SPCE has better electrocatalytic activity compared to Fe, Co, Zn-MOF due to the smallest bandgap. However, the conductivity and LOD of the Mn-MOF modified electrode are not good enough. To incorporate Mn-MOF with other functional materials is necessary for the future. To the best of our current knowledge, this is the first case of combining the first principle calculations and electrochemical results to figure out the influence of center metal ion of MOFs on electrochemical sensing, which provides a new perspective for researchers interested in using the MOF as an electrochemical sensor.Author contributions
Prof. Yi-Ting Hsieh conceived and designed the electrochemical experiments; Mr Hsiao-Hsun Wang, Miss Tsai-Wen Chang performed the experiments, including synthesis, structural characterization and IR measurements.; Miss Ssu-Chia Huang performed the CV experiments; Prof. Shih-I Lu contributed to the theoretical calculation.; Dr Gene-Hsiang Lee contributed to the single-crystal X-ray data collection, refinement, and structural analysis.; Dr Yu-Chun Chuang contributed to the powder X-ray diffraction experiments by synchrotron radiation light source.; Prof. Yi-Ting Hsieh, Prof. Shih-I Lu, and Prof. Chih-Chieh Wang wrote the paper.Conflicts of interest
There are no conflicts to declare.Acknowledgements
We are grateful to the Ministry of Science and Technology, Taiwan (MOST 109-2113-M-031-006) and Soochow University, Taiwan for financial support and we also thank to the National Center for High-performance Computing for computational resources.Notes and references
- S. L. James, Chem. Soc. Rev., 2003, 32, 276–288 RSC.
- J. L. C. Rowsell and O. M. Yaghi, Microporous Mesoporous Mater., 2004, 73, 3–14 CrossRef CAS.
- H. Furukawa, K. E. Cordova, M. O'Keeffe and O. M. Yaghi, Science, 2013, 341, 1230444 CrossRef PubMed.
- T. Gan, J. Li, H. Li, Y. Liu and Z. Xu, Nanoscale, 2019, 11, 7839–7849 RSC.
- L. Ji, J. Wang, K. Wu and N. Yang, Adv. Funct. Mater., 2018, 28, 1706961 CrossRef.
- L.-Y. Pang, P. Wang, J.-J. Gao, Y. Wen and H. Liu, J. Electroanal. Chem., 2019, 836, 85–93 CrossRef CAS.
- L. Liu, Y. Zhou, S. Liu and M. Xu, ChemElectroChem, 2018, 5, 6–19 CrossRef CAS.
- P. L. Wang, L. H. Xie, E. A. Joseph, J. R. Li, X. O. Su and H. C. Zhou, Chem. Rev., 2019, 119, 10638–10690 CrossRef CAS PubMed.
- C.-H. Chuang and C.-W. Kung, Electroanalysis, 2020, 32, 1885–1895 CrossRef CAS.
- X. Wang, A. Dong, Y. Hu, J. Qian and S. Huang, Chem. Commun., 2020, 56, 10809–10823 RSC.
- S. Lu, M. Hummel, K. Chen, Y. Zhou, S. Kang and Z. Gu, Electrochem. Commun., 2020, 114, 106715 CrossRef CAS.
- S. Lu, H. Jia, M. Hummel, Y. Wu, K. Wang, X. Qi and Z. Gu, RSC Adv., 2021, 11, 4472–4477 RSC.
- M. Riskin, R. Tel-Vered, T. Bourenko, E. Granot and I. Willner, J. Am. Chem. Soc., 2008, 130, 9726–9733 CrossRef CAS PubMed.
- X. Fang, X. Chen, Y. Liu, Q. Li, Z. Zeng, T. Maiyalagan and S. Mao, ACS Appl. Nano Mater., 2019, 2, 2367–2376 CrossRef CAS.
- M. Saraf, R. Rajak and S. M. Mobin, J. Mater. Chem. A, 2016, 4, 16432–16445 RSC.
- T. Gan, J. Li, L. Xu, Y. Yao and Y. Liu, J. Electroanal. Chem., 2019, 848, 113287 CrossRef CAS.
- H. Wang, X. Bo, M. Zhou and L. Guo, Anal. Chim. Acta, 2020, 1109, 1–8 CrossRef CAS PubMed.
- Y.-S. Lu, W.-Y. Pan, T.-C. Hung and Y.-T. Hsieh, Langmuir, 2020, 36, 11358–11365 CrossRef CAS PubMed.
- J. Cheng, Y. Li, J. Zhong, Z. Lu, G. Wang, M. Sun, Y. Jiang, P. Zou, X. Wang, Q. Zhao, Y. Wang and H. Rao, Chem. Eng. J., 2020, 398, 125664 CrossRef CAS.
- C.-C. Wang, S.-Y. Ke, Y.-F. Hsieh, S.-T. Huang, T.-H. Wang, G.-H. Lee and Y.-C. Chuang, J. Chin. Chem. Soc., 2019, 66, 1031–1040 CrossRef CAS.
- T. Kokulnathan, T.-J. Wang, E. A. Kumar, V. Suvina and R. G. Balakrishna, ACS Appl. Nano Mater., 2020, 3, 4522–4529 CrossRef CAS.
- SMART V 4.043 Software for CCD Detector System, Siemens Analytical Instruments Division, Madison, WI, 1995 Search PubMed.
- SAINT V 4.035 Software for CCD Detector System, Siemens Analytical Instruments Division, Madison, WI, 1995 Search PubMed.
- G. M. Sheldrick, Program for the Refinement of Crystal Structures, University of Göttingen, Göttingen, Germany, 1993 Search PubMed.
- SHELXTL 5.03 (PC-Version), Program Library for Structure Solution and Molecular Graphics, Siemens Analytical Instruments Division, Madison, WI, 1995 Search PubMed.
- P. H. T. Philipsen, G. te Velde, E. J. Baerends, J. A. Berger, P. L. de Boeij, M. Franchini, J. A. Groeneveld, E. S. Kadantsev, R. Klooster, F. Kootstra, M. C. W. M. Pols, P. Romaniello, M. Raupach, D. G. Skachkov, J. G. Snijders, C. J. O. Verzijl, J. A. Celis Gil, J. M. Thijssen, G. Wiesenekker, C. A. Peeples, G. Schreckenbach and T. Ziegler, BAND 2020, SCM, Theoretical Chemistry, Vrije Universiteit, Amsterdam, The Netherlands, 2020, http://www.scm.com Search PubMed.
- G. te Velde and E. J. Baerends, Phys. Rev. B, 1991, 44(15), 7888–7903 CrossRef CAS PubMed.
- A. V. Krukau, O. A. Vydrov, A. F. Izmaylov and G. E. Scuseria, J. Chem. Phys., 2006, 125(22), 224106 CrossRef PubMed.
Footnote |
| † Electronic supplementary information (ESI) available. CCDC 2098717. For ESI and crystallographic data in CIF or other electronic format see DOI: 10.1039/d1ra04622e |
| This journal is © The Royal Society of Chemistry 2021 |

