
 Open Access Article
 This Open Access Article is licensed under a Creative Commons Attribution-Non Commercial 3.0 Unported Licence
In vivo study of a novel, safe, rapid, and targeted red carbon dot probe for recognition of tumors with high expression of folate enzyme†
Zhuoling Zhong a,
Xingying Lia,
Shuyao Liua,
Chuanwei Zhanga,
Xiaoping Xu*a and
Liyun Liao*b
a,
Xingying Lia,
Shuyao Liua,
Chuanwei Zhanga,
Xiaoping Xu*a and
Liyun Liao*b
aWest China School of Pharmacy, Sichuan University, Chengdu 610041, China. E-mail: xuxp319@scu.edu.cn; zhongzhuoling@stu.scu.edu.cn
bChengdu Med Coll, Sch Pharm, 783, Xindu Ave, Chengdu 610500, China. E-mail: llyhx210@tom.com
First published on 10th September 2021
Abstract
Carbon dots (CDS) have been proved to be a type of ideal biological imaging probe. They have the advantages of spontaneous fluorescence, anti-photobleaching, good biocompatibility and easy surface decoration, and are receiving special attention from researchers. The early imaging diagnosis of tumors has always been a practical means of clinical diagnosis. Finding an efficient and low-toxicity tumor probe is the continuous goal of tumor clinical diagnosis and treatment. Therefore, this article uses the modifiable properties of the surface structure of carbon dots, and at the same time, uses the characteristics of tumors with high expression of folate receptors (FR) that can specifically take up folic acid (FA) to construct folic acid carbon dot conjugates (FA–CDs) to achieve targeted tumor uptake. Firstly, CCK8 toxicity tests proved that FA–DCCDs had good biocompatibility and were almost non-toxic. Further, confocal cell imaging experiments, microplate quantitative experiments and flow cytometry experiments proved that FA–CDs were selective and more easily absorbed by tumor cells with high expression of folate receptors, and bare carbon dots could be absorbed into cells without selectivity. Through in vivo experiments, the law of injection of bare CDs into the body was explored, which proved that they had no obvious accumulation and had high distribution in the liver and kidneys. FA–CDs was applied to the targeted imaging of a mouse tumor model in vivo for the first time, which proved again that the carbon point coupled with folic acid had selectivity for tumor cells with high expression of FR receptors, which provided a basis for tumor drug research and early clinical diagnosis of tumors.
Introduction
Cancer is still a global public health problem.1–3 As normal cells become cancerous through a complex transformation process, tumor biomarkers play a powerful role in early cancer diagnosis, showing reliable analysis, diagnosis and predictive value.4,5 Current methods,6 such as immunoassay for detecting cancer biomarkers, cannot fully meet the clinical needs.At the same time, the progress of optical imaging in the biomedical field has pushed the research of cancer diagnosis to a new level. Optical imaging has excellent sensitivity and resolution. In particular, fluorescence imaging makes the process visualized.7 Therefore, biomarkers are increasingly used for fluorescent targeting and imaging of cancer.8 FR is one of the important cancer biomarkers with a molecular weight of 38 kDa.9 It is highly expressed in many malignant epithelial cells, including ovarian cancer, cervical cancer and breast cancer,10 but rarely in normal cells.11
Different levels of FR expression make it possible to detect cancer by detecting the expression of FR. FA is an ideal ligand for FR due to its high specific affinity, stability and compatibility.12 FA is a kind of easily linked metabolic vitamin. FA and its conjugates can be internalized into cells through receptor-mediated endocytosis, which has non immunogenicity.13 Therefore, the strategy of coupling FA with fluorescent nanomaterials to make fluorescent probe materials is expected to be used to detect FR and identify cancer cells.14,15
Fluorescent probe materials usually have the following characteristics: (1) high fluorescence quantum yield can greatly improve the sensitivity (2) long absorption and emission wavelengths can overcome the interference caused by autofluorescence in biological systems and improve the signal-to-noise ratio of fluorescence detection (3) large Stokes shift can reduce the error scattering caused by fluorescence self-quenching and Rayleigh (4) excellent solubility and stability can inhibit the aggregation of fluorescent substances, and good anti photobleaching ability and photostability are conducive to the application of fluorescent materials in analysis and detection (5) excellent biocompatibility is very important for in vivo bioimaging.16,17
Traditional quantum dots (QDs) with good optical properties18 have been linked with FA to label cancer cells. However, most QDs contain toxic heavy metal elements, which affect their biomedical applications.19 Therefore, it is necessary to replace QDs with benign fluorescent nanomaterials. CDs, a new member of nano carbon, have been proved to be an effective candidate for biological imaging agents. They have attractive advantages, including adjustable fluorescence, light bleaching resistance, good stability, strong hydrophilicity, self-luminescence, good biocompatibility and easy surface decoration.20–23 They just meet the needs of fluorescent probe materials and are superior to the traditional QDs. Song et al.24 first prepared FA coupled fluorescent CDs to differentiate HeLa cancer cells. Lei et al.25 reported hydrogen bonding modification of CDs with FA to enhance optical properties and spatial resolution of cell imaging. Lei et al.26 further prepared a fluorescent probe (FA–PEI-CDs) which can rapidly and specifically penetrate into HeLa and HepG2 cancer cells between FA and PEI-CDs through electrostatic interaction. Other literatures have also reported the combination of fluorescent CDs and FA as a recognition tag for tracking cancer cells, but the reported FA–CDs do not have stable long wavelength emission properties, and there is no report on the application of FA–CDs to in vivo imaging or even in vivo mouse targeted tumor imaging. While current carbon dots for in vivo imaging have high fluorescence intensity, good biocompatibility, resistance to photobleaching and other characteristics. For the first time, Yang et al.27 in 2009 injected carbon dots in different sites into mice still have strong fluorescence, demonstrating that carbon dots can be used for in vivo bioimaging. Tao et al.28 injected carbon dots into different parts of mice and live imaging of mice with different wavelengths of light, demonstrating that longer wavelengths of light are more suitable for live imaging due to the organism's own background factors.
Therefore, through the classical NHS-EDC coupling reaction, FA was synthesized λ-carboxyl group can bind to the amino group on the surface of CDs in the form of amide bond without affecting its own specific affinity for folate receptor.29 FA was cross-linked with CDs to prepare a targeted fluorescent probe, which can specifically recognize tumors cells with high FR expression, be first used for in vivo targeted tumor imaging, it might provide an experimental basis for the development of tumor diagnostic reagents and antitumor drugs. The FA–CDs have long wavelength, stability, low cytotoxicity, excellent biocompatibility and selectivity. Its properties were proved by a variety of in vitro and in vivo experiments. The principle is shown in Scheme 1.
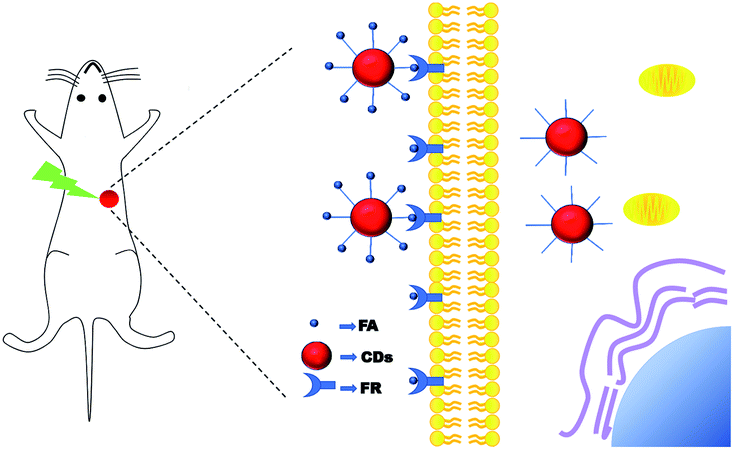 | ||
| Scheme 1 Illustration of the uptake of FA–CDs by HeLa cells in vivo model. | ||
Experimental
Materials and apparatus
Ethanol (analytically pure, Shiyang Chemical Preparation Factory, Chengdu), citric acid (analytically pure, Tianjin Comeo Chemical Reagent Co., Ltd.), urea (analyte, Hunan Furong United Pharmaceutical Factory), ammonia water (analytical reagent, Guangdong chemical reagent engineering technology R&D center), folic acid (99%, Shanghai Titan Technology Co., Ltd.), Rhodamine 6G (analyte, Shanghai McLean Biochemical Technology Co., Ltd.), phosphoric acid (85%, Tianjin Comeo Chemical Reagent Co., Ltd.), anti-fluorescence quenching blocking agent (Invitrogen, USA), DAPI (Invitrogen, USA).Fluorescence spectrophotometer RF6000 (Shimadzu), Microplate Reader Varioskan L.M.X. (Thermo), UV-2300 UV visible spectrophotometer (Shanghai Tianmei Scientific Instrument Co., Ltd.), Sartorius BT 125D 1/100000 electronic balance (Germany), Shangping PA2004 electronic balance (Shanghai balance instrument factory), KL 10260D ultrasonic cleaner (Shanghai Jinghe Analytical Instrument Co., Ltd.), water purifier (Chengdu Pincheng Technology Co., Ltd.), DHG-9140A electrothermal constant temperature blast drying oven (Shanghai Jinghong Experimental Equipment Co., Ltd.), ZF-I three purpose ultraviolet analyzer (Shanghai Gucun electro optic instrument factory), PHS-2F pH meter (Shanghai Yidian Scientific Instrument Co., Ltd.), muffle furnace (4–10 box resistance furnace, Shenyang energy saving electric furnace factory), KH type polytetrafluoroethylene lined autoclave (Shanghai Yushen Instrument Co., Ltd.), RE-52 series rotary evaporator (Shanghai Yarong biochemical equipment Co., Ltd.), freeze dryer (Wuxi woxin Instrument Manufacturing Co., Ltd.), 85-2 constant temperature magnetic stirrer (Shanghai Sile Instrument Co., Ltd.), vacuum freeze dryer SNL21, Savant Instruments Inc., NY, USA), nanoparticle size analyzer (Zetasizer Nano ZS90, Malvern instrument, UK), transmission electron microscope (H-600, Hitachi, Japan), biosafety cabinet (Sujing Antai).
Preparation of carbon dots
Weighed 2.0 g citric acid and 1.0 g urea respectively and put them in a beaker, then added 2 ml phosphoric acid and 10 ml DMF, continuously stirred and ultrasonic until they were dissolved. The mixture was transferred to a 50 ml reactor, reacted at 180 °C for 10 h, and cooled to room temperature. The original solution of carbon dots was centrifuged at 13![[thin space (1/6-em)]](https://www.rsc.org/images/entities/char_2009.gif) 000 rpm for 10 min, and the solution was evaporated by oil pump to remove DMF.
000 rpm for 10 min, and the solution was evaporated by oil pump to remove DMF.
Characterization of DCCDs
A certain concentration of DCCDs solution was dropped onto the copper mesh. After the solution was naturally dried, the morphology and particle size of the carbon dots were observed by transmission electron microscopy (TEM);32 the freeze-dried CDs and KBr powder were mixed in a proper proportion and pressed into transparent sheet. The infrared absorption spectrum of CDs was measured by infrared spectrometer. A certain concentration of CDs solution was placed in a quartz cuvette, and the ultraviolet absorption spectrum of CDs was measured by ultraviolet visible spectrophotometer; the CDs solution of a certain suitable concentration was placed in a four-way fluorescent cuvette, and the fluorescence spectra at different excitation wavelengths were measured on a fluorescence spectrophotometer.33Quantum yield (QY)
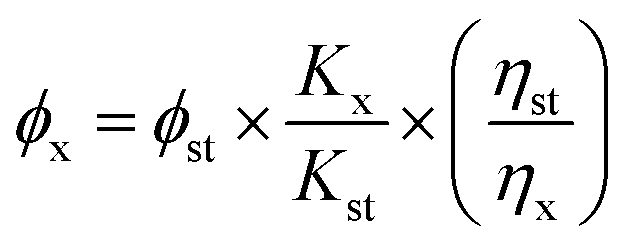
The reference method was used to determine the fluorescence quantum yield of CDs. Rhodamine 6G was selected as the standard. The absorbance values (less than 0.05) and fluorescence spectra of Rhodamine 6G ethanol solution and CDs solution at the maximum excitation wavelength were measured respectively. The slope of the curve was calculated by using the area integral of emission spectrum to plot the corresponding absorbance values, and the quantum yield of carbon dots was calculated according to eqn (1).35
 | (1) |
In the eqn (1) ϕ represents the fluorescence quantum yield, K represents the slope of the curve obtained by plotting the area integral of the emission spectrum against the absorbance value, η is the refractive index of the solvent, x and st denote the solution to be tested and the standard solution respectively.
Preparation of FA–DCCDs
Weighed 88.28 mg FA, 115.02 mg EDC and 46.04 mg NHS in a round bottom flask, added 4 ml PBS (pH7.3), and shake it fully to make it dissolve completely, and stirred it continuously on a magnetic stirrer overnight to achieve the purpose of activating FA.Weighed 88.28 mg of DCCDs, added 2 ml PBS (pH7.3) to dissolve them in a micro centrifuge tube, mixed them evenly, then slowly dropped them into 2 ml FA active ester in stirring, then dropped appropriate amount of ethylenediamine to adjust pH to 9, then continuously stirred on a magnetic stirrer for 24 h, then took out the reaction solution and pour it into a dialysis bag (MWCO = 500 Da), After continuous dialysis in PBS buffer solution and then in ultrapure water, the solution in the bag was taken every certain time to monitor its UV visible absorption at 280 nm until it did not change. The solution in the bag was the purified CDs solution, which was lyophilized to obtain CDs solid powder. (Note: the whole reaction should be carried out in dark to avoid the possibility of FA inactivation.)
Characterization of FA–DCCDs
The DCCDs and FA–DCCDs were characterized by transmission electron microscopy, zeta potentiometry, ultraviolet visible spectrophotometer, infrared spectrometer and fluorescence spectrophotometer. The morphology, size distribution, surface structure, potential state, spectral characteristics and photostability of the products were investigated. The characterization and comparison were carried out to verify whether FA was successfully coupled to the surface of DCCDs.The FA–DCCDs and DCCDs powders after freeze-drying were mixed with KBr powder in a proper proportion and pressed into transparent sheet. The infrared absorption spectra of FA–DCCDs and DCCDs were measured by infrared spectrometer. The UV absorption spectra of FA–DCCDs and DCCDs were measured by UV-vis spectrophotometer; took a certain concentration of FA–DCCDs and DCCDs solution, put them in a fluorescent cuvette, and measured the fluorescence spectra at different excitation wavelengths on a fluorescence spectrophotometer. A certain concentration of FA–DCCDs and DCCDs solution were placed in a potential dish, and the zeta potential was measured on a particle size analyzer.
Cellular toxicity test
HeLa cells in logarithmic growth phase were seeded in 96 well plates with a density of about 5000 cells per well, and then cultured in a cell incubator (37 °C, 5% CO2) for 24 hours. Remove the original culture medium from the well plate, add fresh culture medium containing different concentrations of CDs and FA–DCCDs, create six parallel samples in each group, continue to culture for 24 hours, remove the culture medium added with different amounts of CDs and FA–DCCDs, wash it with PBS (0.01 M, pH 7.3) for 2 times, after the solution is obviously clear and transparent, change to 100 μl contains 10 μl CCK-8 solution was used as the fresh medium, and the cells were cultured in the incubator (37 °C, 5% CO2) for 4 h. Finally, the absorbance values of 96 well plates at 450 nm were measured by enzyme reader. The results were calculated according to the cell viability eqn (2).34| Cell viability (%) = (OD after treatment − OD before treatment) ÷ (OD control group after treatment − OD control grope before treatment) × 100% | (2) |
Cell imaging
HeLa cells with high expression of folate receptor36 and B16 cells and A549 cells with low expression of folate receptor were selected to compare the results. When used for cell imaging, the cells were transferred to the 12 well plate which had been put into the sterilized climbing plate. After 24 hours of culture in the incubator, the discarded medium was sucked out, and the 1000 μg l−1 solution was added to different wells. After incubating the three kinds of cells with DCCDs and FA–DCCDs for 12 hours, the culture medium containing fluorescent material was sucked out, and then washed with PBS solution (0.01 M, pH 7.3) three times to remove the free dead cells and free material. Then 0.4 ml 4% paraformaldehyde solution was added to each well to fix the cells for 15 minutes, and then washed with PBS solution (0.01 M, pH 7.3) once, Each well was incubated with 1 ml 1 mg ml−1 DAPI solution for 10 min to stain the nuclei, and then washed twice with PBS solution (0.01 M, pH 7.3) to remove the excess DAPI dye; added a drop of anti-fluorescence quenching agent in the middle of the slide, took out the slide in the pore plate with tweezers, when the water content was reduced to a certain extent, buckled the cell side down to the center of the slide with anti-fluorescence quenching agent, observed under the laser confocal microscope after sealing the slide, select 488 nm excitation channel to avoid the interference of biological background and folic acid, took photos and record. In the control experiment, except for adding fresh culture medium without DCCDs and FA–DCCDs, the other operation steps were consistent with the above process.Quantitative uptake test of FA–DCCDs
In vivo study of DCCDs
FA–DCCDs and DCCDs were injected into model nude mice
Cell inoculation, HeLa cells in logarithmic growth phase were collected and resuspended in DMEM medium without serum and double antibody or PBS (0.01 M, pH 7.3), and the concentration was adjusted to 107, put it in an ice box and carry it to the animal room. Use a 1 ml syringe to take an appropriate amount of cell suspension and inject 0.1 ml into the subcutaneous inoculation site on the back of nude mice. Generally, there was an obvious protrusion in the first two days of the inoculation site, and then it disappeared. About one week after the inoculation, the tumors appeared. After it growed to 0.5 cm3, the in vivo imaging experiment is carried out.5 mg ml−1 FA–DCCDs solution was injected into the tumors at multiple points, and the injection volume was 100 μl. In vivo imaging technology was used to record the fluorescence changes in vivo for a period of time. The excitation wavelength of the channel was 470 nm and the emission wavelength was 560 nm.
A few days later, after the carbon dots in the same nude mice were completely eliminated, 5 mg ml−1 DCCDs solution was injected into the tumor at multiple points, and the injection volume was 100 μl. In vivo imaging technology was used to record the fluorescence changes in vivo for a period of time. The excitation wavelength of the channel was 550 nm and the emission wavelength was 620 nm.
All animal procedures were performed in accordance with the Guidelines for Care and Use of Laboratory Animals of Sichuan University and approved by the Animal Ethics Committee of Sichuan University.
Results and discussion
Characterization of DCCDs
As shown in Fig. 1(a), the prepared DCCDs show obvious monodisperse spherical like particles under the transmission electron microscope, and the particle diameter uniformity is about 5 nm. According to the infrared absorption spectrum of Fig. 1(b), the absorption peak at 3430.02 cm−1 belongs to the characteristic absorption band of O–H and N–H stretching vibration, the peak at 1101.21 cm−1 may reflect C–N stretching vibration, and 1452.21 cm−1 is C–O bending vibration. The analysis shows that the prepared carbon dots mainly contain carbon, oxygen and nitrogen. And from the Fig. 1(c), when the excitation wavelength of DCCDs increases from 520 nm to 570 nm, the fluorescence intensity gradually increases and the position of emission peak slightly shifts to red (625–635 nm). When the excitation wavelength shifts from 570 nm to 600 nm, the fluorescence intensity gradually decreases and the position of emission peak slightly shifts to red (635–655 nm). At 570 nm excitation wavelength, the maximum intensity fluorescence is emitted at 635 nm, in the process of excitation wavelength increasing from 520 nm to 600 nm, the fluorescence intensity of DCCDs first increases and then decreases, and the emission region has obvious red shift (625 nm–655 nm) with the change of excitation wavelength. Under the excitation wavelength of 570 nm, the maximum emission of 635 nm can be produced. It can be seen from Fig. 1(c) that DCCDs are dark red clear solution under visible light, and emit strong blue fluorescence under 365 nm ultraviolet lamp. Fig. 1(d) is the UV-vis absorption spectrum of DCCDs. It can be observed that DCCDs have two absorption peaks at 230 nm and 340 nm respectively. The detected absorption at 340 nm may be n∼π* It is caused by the absorption of the transition. | ||
| Fig. 1 (a) TEM of DCCDs (b) IR of DCCDs (c) fluorescence emission spectra of DCCDs (the inside photograph is under daylight and under UV light from left to right) (d) UV of DCCDs. | ||
In conclusion, it can be inferred that the carbon particle size distribution is basically uniform, which is consistent with the TEM conclusion. The above analysis shows that DCCDs have good fluorescence properties, low toxicity and safety of raw materials, and also show good biocompatibility in toxicity test, which have the advantages of long wavelength emission and low toxicity. Therefore, the carbon dots were used to prepare conjugates with FA, and then the characterization was continued, In vivo and in vitro experiments were carried out to verify the targeting and safety.
Quantum yield (QY)
The quantum yield of carbon dots is calculated according to eqn (1). The QY of DCCDs is 25.07%.Characterization of FA–DCCDs
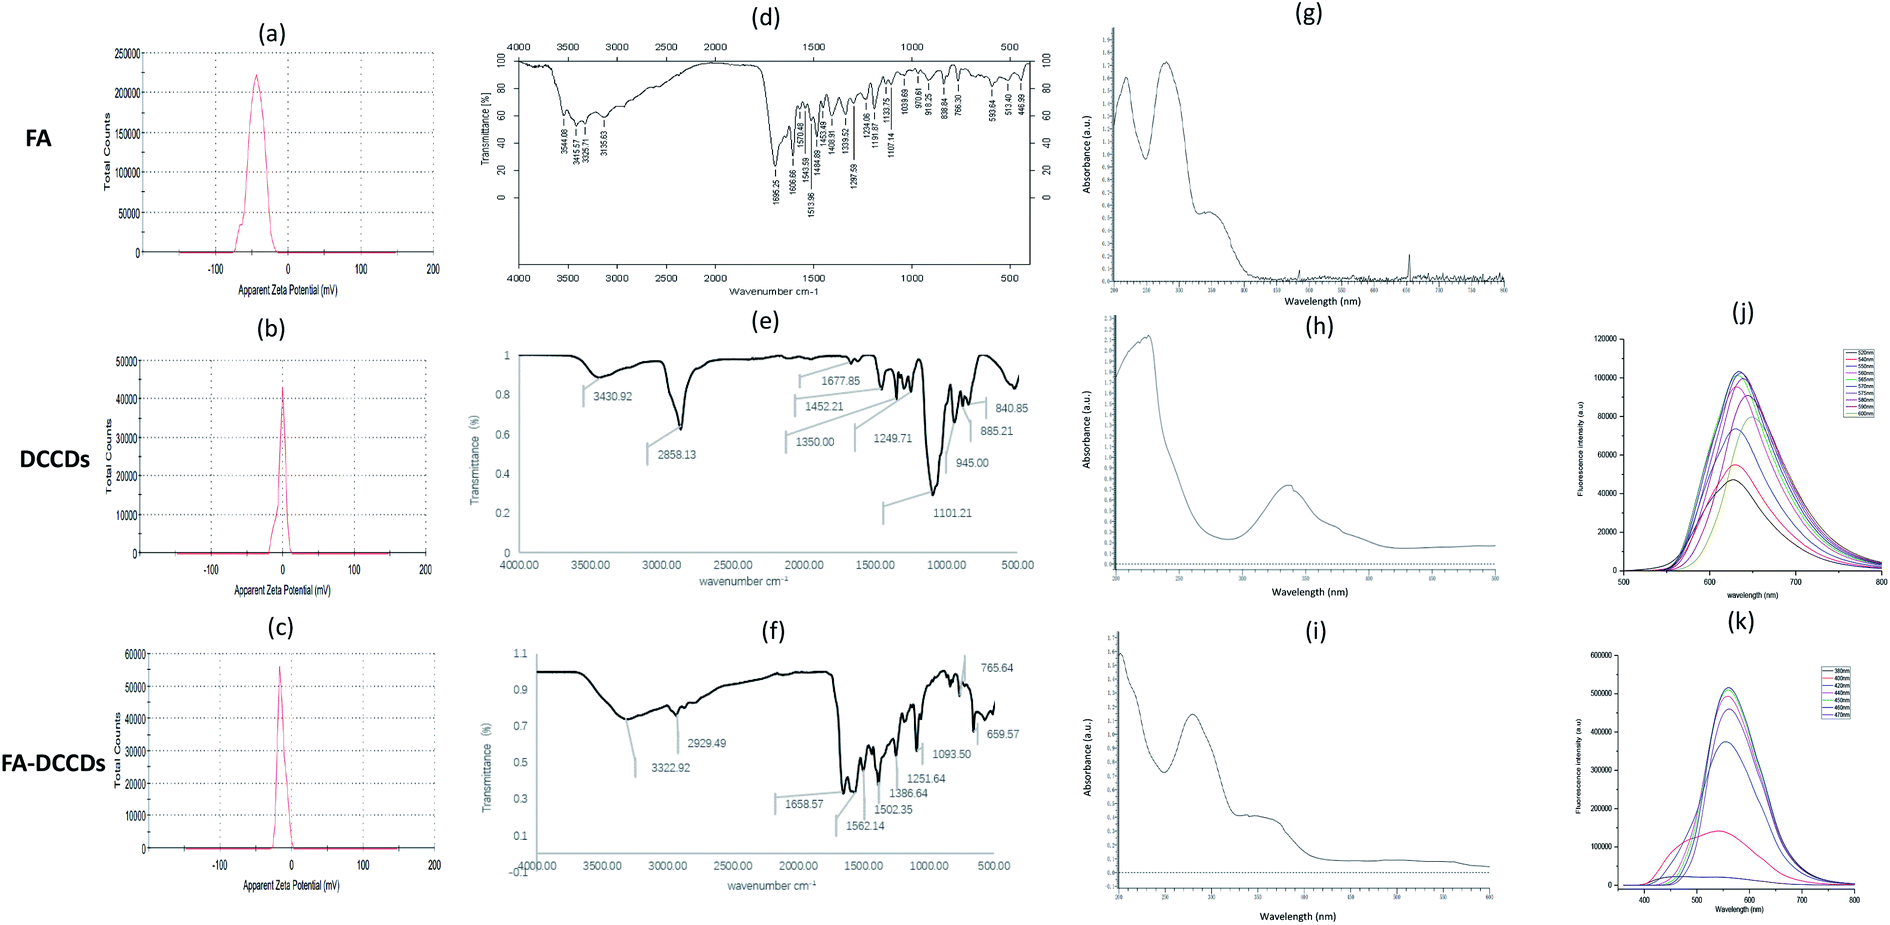 | ||
| Fig. 2 Zeta potential diagram: (a) FA (b) DCCDs (c) FA–DCCDs; IR: (d) FA (e) DCCDs (f) FA–DCCDs; UV: (g) FA (h) DCCDs (i) FA–DCCDs; fluorescence emission spectra: (j) DCCDs (k) FA–DCCDs. | ||
The comparison of infrared absorption spectra of FA, DCCDs and FA–DCCDs conjugates further verified the above inference. As shown in Fig. 2(d–f), several absorption peaks of FA–DCCDs at 1658.57, 1562.14, 1502.35 and 765.6 cm−1 correspond to several absorption peaks of FA in the infrared absorption spectrum, while DCCDs do not have these absorption peaks.
As shown in Fig. 2(g–i), FA has two absorption peaks at 280 nm and 350 nm; DCCDs has an absorption peak at 340 nm; in addition to the absorption peak of DCCDs, there are two peaks at 280 nm and 360 nm in the FA–DCCDs, which are close to the absorption peaks of FA at 280 nm and 345 nm, and are very different from the absorption spectra of bare carbon dots. We conclude that FA is successfully modified on the surface of DCCDs.
After the successful combination of FA and DCCDs to form FA–DCCDs, the influence of FA grafting on the fluorescence properties of DCCDs was explored. Fig. 2(j–k) shows the fluorescence spectra of DCCDs and FA–DCCDs. It can be seen from the figure that the optimal excitation wavelength and emission wavelength of DCCDs after FA modification have some changes. The optimal excitation wavelength and emission wavelength of DCCDs change from λEX = 570 nm, λEM = 634 nm to λEX = 460 nm, λEM = 560 nm, but they still keep a long fluorescence wavelength, which is suitable for further in vitro and in vivo experiments. These results indicate that FA modified DCCDs have some interference on its fluorescence properties, but do not affect the imaging experiment.
The fluorescence quantum yields of DCCDs and FA–DCCDs were 25.07% and 21.10%, respectively. The difference is not big.
Cellular toxicity test
The cell viability was calculated according to the eqn (2). The results are shown in Fig. 3. It can be seen from the figure that the average cell viability at all concentrations is higher than 80%, indicating that DCCDs and FA–DCCDs have good biocompatibility, even at higher concentrations of 2000 μg ml−1. The results showed that DCCDs, FA–DCCDs were suitable for further in vitro and in vivo experiments with high safety and almost no toxicity.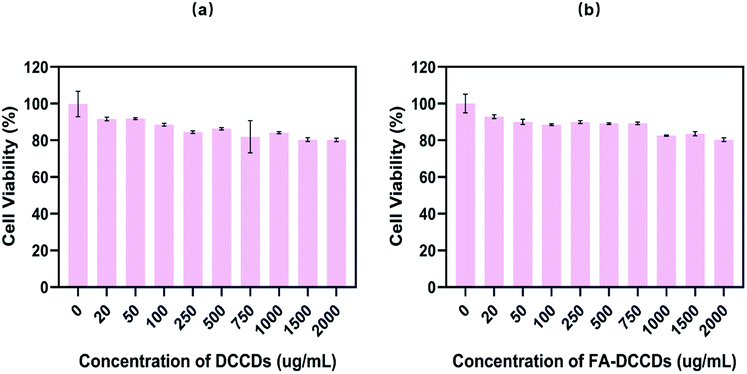 | ||
| Fig. 3 The results of cytotoxic test (a) the effect of DCCDs on cell survival rate (b) the effect of FA–DCCDs on cell survival rate. | ||
Cell imaging
Results as shown in Fig. 4 under the laser confocal microscope channel 500 nm shown in the control test results, HeLa cells, B16 cells and A549 cells had no fluorescence, which ruled out the interference of cell background. In the case of FA–DCCDs, it can be observed that there is a big difference in the expression of FR between HeLa cells and B16 cells and A549 cells. Theoretically, because FA and FR can produce a strong affinity, FA–DCCDs can spontaneously enter HeLa cells through FR receptor-mediated endocytosis, which makes the fluorescence intensity in HeLa cells stronger. As shown in the figure, after the FA–DCCDs were incubated with HeLa cells, B16 cells and A549 cells respectively for 12 hours, there was little or weak fluorescence in B16 cells and A549 cells, while HeLa cells showed bright red fluorescence. As expected, FA–DCCDs can be more preferentially absorbed into cells with high FR expression through FR receptor.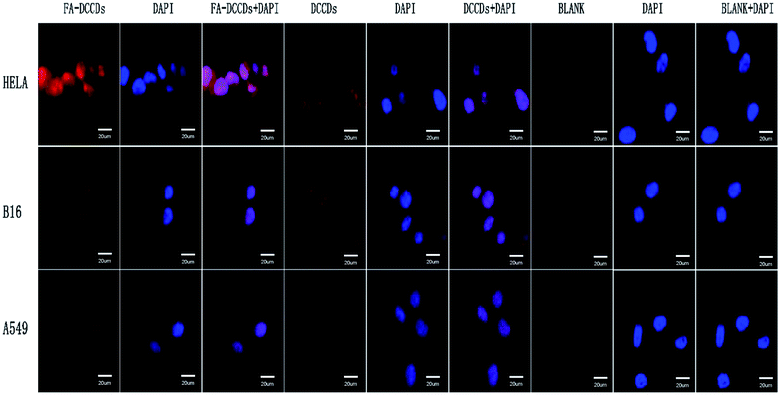 | ||
| Fig. 4 Results of confocal cell imaging: DCCDs and FA–DCCDs. | ||
However, in the case of adding DCCDs and the uptake results of HeLa cells, B16 cells and A549 cells showed no significant difference, showing similar fluorescence intensity, and the fluorescence intensity was lower than that of HeLa cells in FA–DCCDs which further proved that DCCDs without folate modification were not selective and could be uptake by different cells without specificity, it is proved that DCCDs can easily enter many kinds of tumor cells, and FA–DCCDs are selective and more easily absorbed by tumor cells with high expression of folate receptor. In addition, there was almost no sign of morphological damage in the imaging images, which further verified the low toxicity and high biocompatibility of FA–DCCDs.
Quantitative uptake test of FA–DCCDs
| B16 | Hela | |
|---|---|---|
| 1 | 17.46 | 34.78 |
| 2 | 17.35 | 36.28 |
| 3 | 17.76 | 32.88 |
| FA–DCCDs (average fluorescence intensity) | 17.52 | 34.65 |
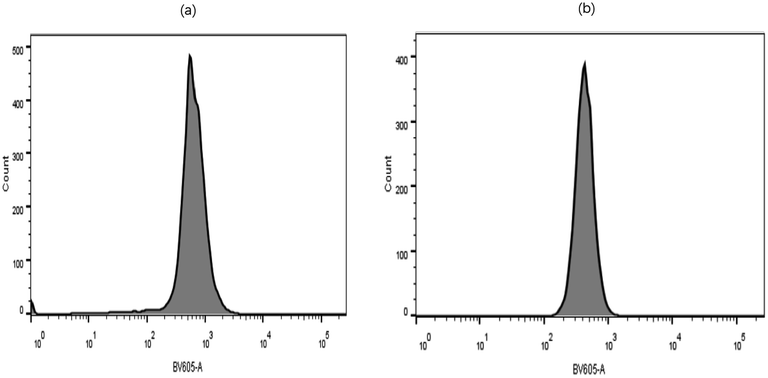 | ||
| Fig. 5 Flow cytometry graph of cell uptake (a) HeLa cells uptake FA–DCCDs (b) B16 cells uptake FA–DCCDs. | ||
In vivo study of DCCDs
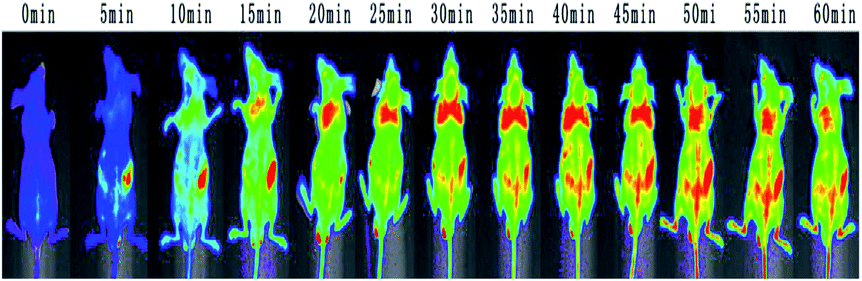 | ||
| Fig. 6 Time course of in vivo imaging of normal nude mice injected with DCCDs. | ||
For DCCDs, it can be observed that there is a clear and strong fluorescence signal in the first 20 minutes, a strong fluorescence signal is observed everywhere, and then gradually fade, until 60 minutes there is still a strong fluorescence signal.
And no animal showed any signs of acute toxicity with DCCDs during the experiment. The experimental data show that our DCCDs have excellent biocompatibility, strong permeability, and can be quickly excreted from mice, almost no accumulation.
Tissue imaging experiment of DCCDs in normal mice
For DCCDs, the excitation wavelength of the selected channel is 550 nm and the emission wavelength is 620 nm. The organ imaging results are shown in Fig. 7. The results show that there is almost no fluorescence in the heart, lung and spleen. The fluorescence signals of liver and kidney are significantly stronger than those of the other three organs, and the fluorescence signal intensity gradually decreases with time, which is basically consistent with the results of body imaging. However, due to the high quantum yield and long wavelength emission of DCCDs, the fluorescence fading time of DCCDs is slow. In the part of animal experiment, the rule of injecting DCCDs into the body was explored. There was no obvious accumulation, and there was a higher distribution in the liver and kidney. All in all, it can be inferred that FA–DCCDs with red carbon dots have the advantages of long wavelength emission, almost non-toxic and stable performance.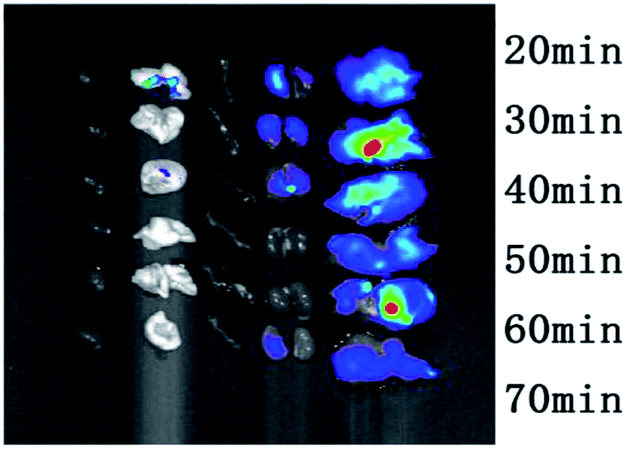 | ||
| Fig. 7 Time course of tissue imaging in normal nude mice injected with DCCDs. | ||
FA–DCCDs and DCCDs were injected into model nude mice
Results as shown in Fig. 8, the general trend of the conjugates and bare carbon dots in the tumor was the same. The peak value reached 15 min after injection, and a strong fluorescence signal was observed, but the fading rate of the fluorescence signal was different. The experimental results of injecting bare carbon dots showed that the fluorescence signal was very weak at about 40 min, while a very strong fluorescence signal could still be observed at 40 min in the group injected conjugates, the fluorescence intensity of 60 min was close to that of 40 min in bare carbon dot group. This difference once again proves that the carbon dots coupled with FA are selective for tumor cells with high FR receptor expression in vivo. Thus, it is first time to realize the targeted tumor of FA–CDs in vivo.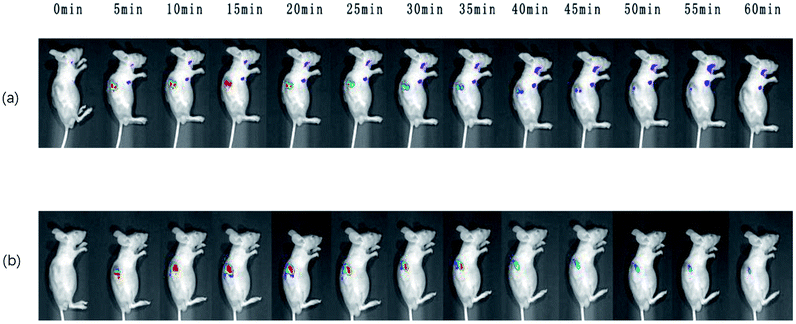 | ||
| Fig. 8 In vivo imaging of model mice injected with (a) DCCDs (b) FA–DCCDs. | ||
Conclusions
In general, the preparation methods of DCCDs are convenient and easy, the raw materials are low toxicity and high safety materials, the obtained carbon dots have stable fluorescence properties and low toxicity, and the fluorescence properties of DCCDs (λEM = 620 nm) belongs to the red-light emission carbon dots, and has obvious imaging in vitro and in vivo. It is very suitable for biomedical applications, and has the advantages of strong penetration and high safety.In order to enhance the tumor targeting performance of bare DCCDs, in this paper, the conjugates were successfully prepared by the reaction of DCCDs with FA. The conjugates not only retain the original fluorescence properties, but also increase the selectivity of carbon dots. They can specifically select tumor cells with high expression of FR, which is a potential tumor probe.
For FA–DCCDs, the emission wavelength is 560 nm, which is conducive to the resolution of in vivo imaging. It has the advantages of high quantum yield, simple preparation, long emission wavelength, strong penetration ability, good cell uptake ability, high safety and it is a good candidate for further in vivo selectivity experiments. FA–DCCDs have more specific uptake in vivo HeLa tumors with high expression of folate receptor than bare carbon dots of the same type. It is a potential tumor probe material and has application value in biological imaging.
Next, we hope to try intraperitoneal injection and caudal vein injection of FA–DCCDs and DCCDs on the basis of mouse HeLa tumor model in vivo. In the same way, we can observe whether it can target tumor specifically through in vivo imaging experiment, so as to extend its application from limited local administration to systemic administration, and to enhance its practical application value.
Conflicts of interest
There are no conflicts to declare.Acknowledgements
This work was financially supported by Sichuan Key Research and Development Project (2020YFS0260). The author would like to appreciate Department of Science and Technology of Sichuan Province for financial support of this project.Notes and references
- A. Jemal, F. Bray, M. M. Center, J. Ferlay, E. Ward and D. Forman, Ca-Cancer J. Clin., 2011, 61 Search PubMed.
- C. Mattiuzzi and G. Lippi, Cent. Eur. J. Public Health, 2020, 30, 1026–1027 CrossRef PubMed.
- L. L. Bu, J. Yan, Z. Wang, H. Ruan, Q. Chen, V. Gunadhi, R. B. Bell and Z. Gu, Biomaterials, 2019, 219, 119182 CrossRef CAS PubMed.
- M. Kalia, Metabolism, 2015, 64, S16–S21 CrossRef CAS PubMed.
- M. Vacante, A. M. Borzi, F. Basile and A. Biondi, World J. Clin. Cases, 2018, 6, 869–881 CrossRef PubMed.
- T. Mazzu-Nascimento, G. G. Morbioli, L. A. Milan, F. C. Donofrio, C. A. Mestriner and E. Carrilho, Anal. Chim. Acta, 2017, 950, 156–161 CrossRef CAS PubMed.
- Y. He, Y. Zhong, Y. Su, Y. Lu, Z. Jiang, F. Peng, T. Xu, S. Su, Q. Huang, C. Fan and S. T. Lee, Angew. Chem., Int. Ed. Engl., 2011, 50, 5695–5698 CrossRef CAS PubMed.
- A. B. Chinen, C. M. Guan, J. R. Ferrer, S. N. Barnaby, T. J. Merkel and C. A. Mirkin, Chem. Rev., 2015, 115, 10530–10574 CrossRef CAS PubMed.
- S. Ehsanimehr, P. Najafi Moghadam, W. Dehaen and V. Shafiei-Irannejad, Eur. Polym. J., 2021, 150 Search PubMed.
- E. Ye, M. D. Regulacio, M. S. Bharathi, H. Pan, M. Lin, M. Bosman, K. Y. Win, H. Ramanarayan, S. Y. Zhang, X. J. Loh, Y. W. Zhang and M. Y. Han, Nanoscale, 2016, 8, 543–552 RSC.
- J. A. Ledermann, S. Canevari and T. Thigpen, Ann. Oncol., 2015, 26, 2034–2043 CrossRef CAS PubMed.
- Y. Lu and P. S. Low, Adv. Drug Delivery Rev., 2012, 64, 342–352 CrossRef.
- Z. Wang, S. Zong, J. Yang, J. Li and Y. Cui, Biosens. Bioelectron., 2011, 26, 2883–2889 CrossRef CAS PubMed.
- P. S. Low and S. A. Kularatne, Curr. Opin. Chem. Biol., 2009, 13, 256–262 CrossRef CAS PubMed.
- Y. Ma, S. Fu, Y. Tan and A. Zhang, Nanotechnology, 2021, 32, 195501 CrossRef CAS PubMed.
- X. Li, S. Zhao, B. Li, K. Yang, M. Lan and L. Zeng, Coord. Chem. Rev., 2021, 431 Search PubMed.
- M. Zheng, S. Liu, J. Li, D. Qu, H. Zhao, X. Guan, X. Hu, Z. Xie, X. Jing and Z. Sun, Adv. Mater., 2014, 26, 3554–3560 CrossRef CAS PubMed.
- S. Zhu, J. Shao, Y. Song, X. Zhao, J. Du, L. Wang, H. Wang, K. Zhang, J. Zhang and B. Yang, Nanoscale, 2015, 7, 7927–7933 RSC.
- W. Zhang, Y. Miao, K. Lin, L. Chen, Q. Dong and C. Huang, Environ. Pollut., 2013, 176, 158–164 CrossRef CAS PubMed.
- S. Y. Lim, W. Shen and Z. Gao, Chem. Soc. Rev., 2015, 44, 362–381 RSC.
- M. J. Molaei, Talanta, 2019, 196, 456–478 CrossRef CAS PubMed.
- M. J. Molaei, RSC Adv., 2019, 9, 6460–6481 RSC.
- K. J. Mintz, Y. Zhou and R. M. Leblanc, Nanoscale, 2019, 11, 4634–4652 RSC.
- Y. Song, W. Shi, W. Chen, X. Li and H. Ma, J. Mater. Chem., 2012, 22, 12568–12573 RSC.
- Q. Liu, S. Xu, C. Niu, M. Li, D. He, Z. Lu, L. Ma, N. Na, F. Huang, H. Jiang and J. Ouyang, Biosens. Bioelectron., 2015, 64, 119–125 CrossRef CAS PubMed.
- D. Lei, W. Yang, Y. Gong, J. Jing, H. Nie, B. Yu and X. Zhang, Sens. Actuators, B, 2016, 230, 714–720 CrossRef CAS.
- L. C. Sheng-Tao Yang, P. G. Luo, F. Lu, X. Wang and H. Wang, J. Am. Chem. Soc., 2009, 131, 11308–11309 CrossRef PubMed.
- H. Tao, K. Yang, Z. Ma, J. Wan, Y. Zhang, Z. Kang and Z. Liu, Small, 2012, 8, 281–290 CrossRef CAS PubMed.
- R. J. Lee and P. S. Low, J. Biol. Chem., 1994, 269, 3198–3204 CrossRef CAS.
- Y. Dong, H. Pang, H. B. Yang, C. Guo, J. Shao, Y. Chi, C. M. Li and T. Yu, Angew. Chem., Int. Ed. Engl., 2013, 52, 7800–7804 CrossRef CAS PubMed.
- J. Zhu, X. Bai, J. Bai, G. Pan, Y. Zhu, Y. Zhai, H. Shao, X. Chen, B. Dong, H. Zhang and H. Song, Nanotechnology, 2018, 29, 085705 CrossRef PubMed.
- B. Wang, W. Tang, H. Lu and Z. Huang, J. Mater. Chem. A, 2016, 4, 7257–7265 RSC.
- L. Qiao, T. Sun, X. Zheng, M. Zheng and Z. Xie, Mater. Sci. Eng., C, 2018, 85, 1–6 CrossRef CAS PubMed.
- K. Jiang, S. Sun, L. Zhang, Y. Lu, A. Wu, C. Cai and H. Lin, Angew. Chem., Int. Ed. Engl., 2015, 54, 5360–5363 CrossRef CAS PubMed.
- A. Kumari, A. Kumar, S. K. Sahu and S. Kumar, Sens. Actuators, B, 2018, 254, 197–205 CrossRef CAS.
- G. Tweedale, Nat. Rev. Cancer, 2002, 2, 311–315 CrossRef CAS PubMed.
Footnote |
| † Electronic supplementary information (ESI) available: Calculation of coupling rates and quality control of conjugates. See DOI: 10.1039/d1ra04592j |
| This journal is © The Royal Society of Chemistry 2021 |