 Open Access Article
Silver/silver halide supported on mesoporous ceria particles and photo-CWPO degradation under visible light for organic compounds in acrylonitrile wastewater
Guozheng Zhao ,
Qingwei Tan,
Changbo Li
 *,
Liyan Shang,
Daihang Zhang,
Xuanxuan Lu and
Feng Qiu
Liaoning Petrochemical University, Fushun, Liaoning 113001, China. E-mail: lnpulcb@126.com
First published on 5th August 2021
Abstract
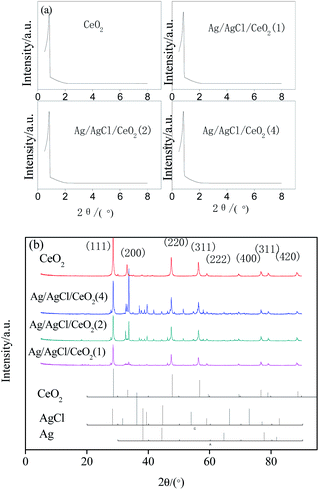
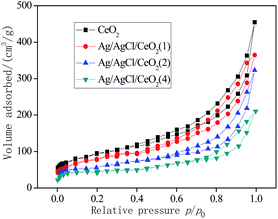
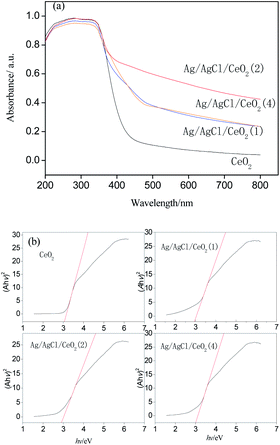
Silver/silver halide supported on ordered mesoporous ceria particles (Ag/AgCl/CeO2) were rapidly prepared by microwave-assisted soft template method, deposition precipitation method and photoreduction method, using cerium nitrate and silver nitrate as raw materials and block copolymer F127 as a template. The morphology, structure and chemical composition of the catalyst were characterized by XRD, SEM, EDS, TEM, N2 adsorption–desorption and UV-Vis Drs. Catalytic wet peroxide system assisted with visible light photocatalysis (photo-CWPO) was conducted to investigate the performance of organics degradation by Ag/AgCl/CeO2 as a catalyst in acrylonitrile wastewater. The results showed that the Ag/AgCl/CeO2 prepared has an ordered mesoporous structure, Ag and AgCl are formed on the surface of CeO2, with a specific surface area of 302.6–336.2 m2 g−1 and the average pore size is 8.04–8.90 nm. There is a strong absorption in the visible region and a band gap of 2.9 eV. The Ag/AgCl/CeO2 catalyst has higher catalytic performance in the photo-CWPO system than in the CWPO system alone. Ag loading, catalyst and H2O2 dosage, and pH value can affect the COD removal. When the concentration of COD in acrylonitrile wastewater was 500 mg L−1, the amount of catalyst was 200 mg, the amount of H2O2 (30%) was 8 mL, and the reaction time was 60 min, the COD removal reached 90%.
Introduction
As an important chemical raw material, acrylonitrile plays an irreplaceable role in industrial production. However, the wastewater from the production process is toxic and harmful because it contains acrylonitrile, acetonitrile, N-heterocyclic compounds and other organic compounds. At present, the treatment methods of acrylonitrile wastewater in industry mainly include biological method, distillation method, incineration method and catalytic oxidation method.1,2 Due to the poor biodegradability of –CN group compounds in acrylonitrile wastewater, the effluent COD after biological treatment is very high.3 Distillation method has poor separation effect for components with similar boiling point and high energy consumption. The cost of incineration is high and the equipment is corroded seriously. The catalysts used in catalytic oxidation process, such as metal salts or metal oxides such as iron, copper and nickel, have low catalytic efficiency and serious dissolution of metal ions.4,5 The typical representative is Fenton catalytic oxidation process. Since the discovery of Fenton reaction in 1894, Fenton oxidation has been widely used to treat high concentration organic wastewater. However, in the application process, the iron hydroxide sludge is produced becomes secondary pollution.6 Therefore, researchers turned to heterogeneous systems of transition metal catalysts, such as Cu,7 Co,8 Mn,9 etc., and gradually developed catalytic wet peroxide technology (CWPO) on the basis of Fenton method by replacing Fe2+ with solid catalysts.10–12With the in-depth study of CWPO technology, all kinds of coupling technologies continue to emerge, expanding the application scope of CWPO technology. Li et al.13 used Cu–Ni bimetallic oxide as catalyst to degrade quinoline in coal chemical wastewater by MW (microwave)-CWPO, and the degradation rate reached 95%. Hassani et al.14 used US (ultrasound)-CWPO to treat azo dye AO7, and the removal was significantly higher than that of CWPO or ultrasound alone. Munoz et al.15 used ilmenite as catalyst to degrade phenol by UV-CWPO, and the TOC removal of total organic carbon reached 100%. UV-CWPO combined with UV irradiation has faster mineralization rate and higher degradation efficiency than dark reaction process.16 However, ultraviolet light only accounts for about 5% of the solar radiation energy, while visible light accounts for about 50%. Therefore, the development of visible light catalysts has become a new research hotspot in recent years.17 Huang et al.18 developed a novel plasma photocatalyst Ag@AgCl which is considered to be a good visible light catalyst. At present, a variety of efficient composite photocatalysts have been prepared, such as Ag/AgCl/ZnO,19 Ag/AgCl/Bi2MoO6,20 Ag/AgCl/TiO2,21 AgCl/Ag/In2O3,22 Ag/AgCl/WO3/g-C3N4,23 Ag/AgCl/ZnWO4,24 etc.
In order to degrade organics in acrylonitrile wastewater more efficiently, a photo-CWPO synergy system with visible light was conducted. Ordered mesoporous Ag/AgCl/CeO2 catalysts were prepared by microwave-assisted soft template method, deposition precipitation method and photoreduction method. And the structure, morphology and elements of the catalyst were characterized systematically. The catalytic performance of Ag/AgCl/CeO2 in photo-CWPO system for degradation of refractory organic pollutants in acrylonitrile wastewater was studied. The effects of Ag loading, catalyst, H2O2 dosage and pH on COD removal were investigated, and the catalytic mechanism of Ag/AgCl/CeO2 in photo-CWPO system is preliminarily discussed.
Experimental
Materials and methods
Triblock copolymer F127 (EO106PO70EO106, Mav = 12![[thin space (1/6-em)]](https://www.rsc.org/images/entities/char_2009.gif) 600), cerium nitrate [Ce(NO3)3·6H2O], hydrogen peroxide solution (H2O2, 30%), silver nitrate (AgNO3), sodium hydroxide (NaOH), all reagents used were analytical grade and purchased from Sinopharm Chemical Reagent Co. Shanghai, China. The wastewater was taken from a acrylonitrile chemical plant, the initial concentration of COD is 1500 mg L−1 which expressed the concentration of organic matter in wastewater.
600), cerium nitrate [Ce(NO3)3·6H2O], hydrogen peroxide solution (H2O2, 30%), silver nitrate (AgNO3), sodium hydroxide (NaOH), all reagents used were analytical grade and purchased from Sinopharm Chemical Reagent Co. Shanghai, China. The wastewater was taken from a acrylonitrile chemical plant, the initial concentration of COD is 1500 mg L−1 which expressed the concentration of organic matter in wastewater.
Synthesis methods
| η/% = [(ρ0 − ρ)/ρ0] × 100 | (1) |
Results and discussion
Catalyst characterization
| Catalysts | Pore size/nm | Pore volume/(cm3 g−1) | Specific surface area/(m2 g−1) |
|---|---|---|---|
| CeO2 | 9.06 | 0.67 | 350.1 |
| Ag/AgCl/CeO2(1) | 8.90 | 0.50 | 336.2 |
| Ag/AgCl/CeO2(2) | 8.82 | 0.34 | 317.5 |
| Ag/AgCl/CeO2(4) | 8.04 | 0.31 | 302.6 |
In general, CeO2 and Ag/AgCl/CeO2 synthesized by microwave-assisted soft template have large specific surface area and relatively large pore size, which are conducive to deal with large molecules or groups in the catalytic reactions.30
 | ||
| Fig. 3 SEM images of samples (a) Ag/AgCl/CeO2(1); (b) Ag/AgCl/CeO2(2); (c) Ag/AgCl/CeO2(4); (d) CeO2. | ||
EDS analysis was carried out under scanning electron microscope to determine the composition and spatial distribution of the constituent elements of the sample. As shown in Fig. 4, there are Ce, O, Ag and Cl in the samples. The distribution of various elements are very uniform, and the ratio of Ag to Cl in Ag/AgCl/CeO2(x) samples is greater than 1, which further confirmed the existence of silver. EDS content analysis of each element are shown in Table 2. According to Table 2, with the amount of AgNO3 increased sequentially, the content of Ag in the samples increased sequentially.
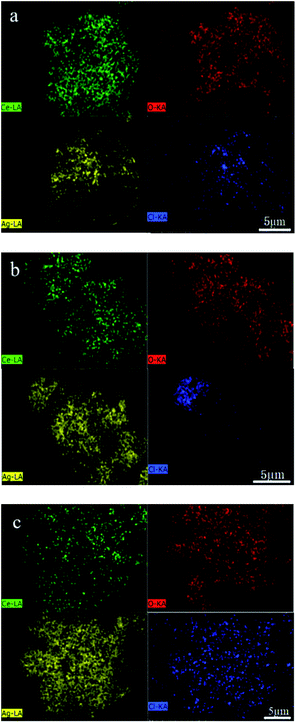 | ||
| Fig. 4 Element distribution images of samples: (a) Ag/AgCl/CeO2(1); (b) Ag/AgCl/CeO2(2); (c) Ag/AgCl/CeO2(4). | ||
| Samples | Atomic percentage of elements (%) | |||
|---|---|---|---|---|
| Ag | Cl | Ce | O | |
| Ag/AgCl/CeO2(1) | 20.19 | 17.02 | 22.48 | 40.31 |
| Ag/AgCl/CeO2(2) | 28.74 | 20.28 | 19.14 | 31.84 |
| Ag/AgCl/CeO2(4) | 33.26 | 23.09 | 15.87 | 27.78 |
The TEM images are shown in Fig. 5, which indicates that CeO2 prepared has ordered mesoporous structure with clear lattice fringes. Ag and AgCl particles are formed on the surface of CeO2. This result is consistent with that of N2 adsorption–desorption test.
Catalytic performance
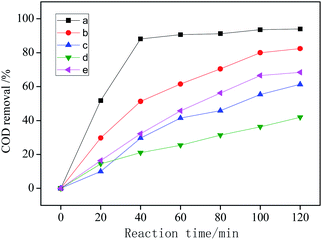 | ||
| Fig. 7 COD removal under different conditions: (a) visible light + CWPO; (b) CWPO; (c) visible light catalysis; (d) visible light + H2O2; (e) CeO2 + H2O2. | ||
The COD removal of system (d) is the lowest, indicating that the catalytic degradation efficiency of organic matter is the lowest. That's because only H2O2 is added as oxidant in system (d), and the oxidation potential of H2O2 is 1.78 eV, while the oxidation potential of ˙OH is 2.8 eV.34 Therefore, the oxidizability of H2O2 is weaker than that of ˙OH. The irradiation of visible light can not make H2O2 produce enough ˙OH, moreover, visible light can decompose H2O2 into H2O and O2, which reduces the utilization of H2O2 and leads to the worst COD removal.2,35
System (c) is a typical photocatalytic reaction, which proved that Ag/AgCl/CeO2(2) can effectively absorb visible light and has good photocatalytic activity. Because visible light can excite Ag/AgCl and CeO2 to produce photogenerated electron e− and photogenerated hole h+, which can oxidize H2O around the catalyst to generate ˙OH due to its strong oxidizability. e− and h+ can also oxidize Cl− in AgCl to produce active species Cl0 with oxidation, and even directly participate in the catalytic degradation of organic pollutants.
System (b) and system (e) are wet catalytic oxidation reactions with different catalysts. CeO2/H2O2 has the cycle of Ce3+/Ce4+, which promoted the decomposition of H2O2 into ˙OH and ˙O2−.36 Noble metal Ag supported on the surface of CeO2 can increase the lattice oxygen defects of CeO2 and improve its catalytic performance.37 Compared with system (e), the catalytic performance of CeO2 can be improved by loading Ag and AgCl.
System (a) shows that Ag/AgCl/CeO2(2) has the best catalytic performance in the photo-CWPO system, it is proved that synergistic effects of various active species mentioned above improved the catalytic performance of Ag/AgCl/CeO2 and the COD removal reaches 90% in 60 min.
The Ag ion doped is an effective electron receiver, which can capture the electrons in the conduction band. The competition of metal ions for electrons makes the photogenerated electron e− and photogenerated hole h+ separate, which reduce the recombination probability of the e− and h+ on CeO2 surface, so that more ˙OH can be produced on CeO2 surface under the action of visible light radiation and improve the catalytic activity.39
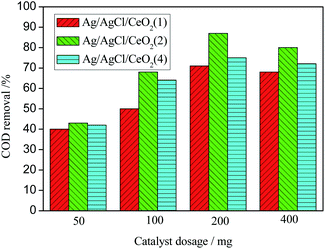
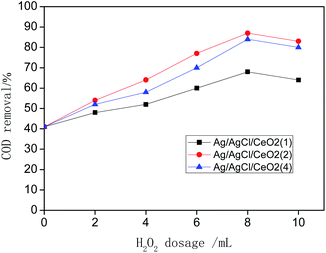
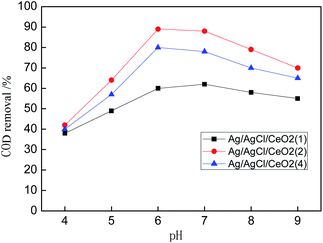
At lower Ag loading (1 mmol), Ag particles enter into the deep pores of CeO2 and can not participate in the catalytic peroxidation reaction. Only some Ag particles at the opening of the pores participated in the oxidation reaction. There are not enough active sites on the surface of the catalyst, which lead to the lower efficiency of the catalyst. With the increase of Ag loading to 2 mmol, the Ag/AgCl/CeO2 catalyst has higher catalytic activity and the COD removal reach 90%. When Ag loading is further increased to 4 mmol, Ag becomes the center of fast recombination of electrons and holes, and the catalytic activity decreases.40,41 Moreover, the size of Ag/AgCl/CeO2 decreases and aggregates are formed. These aggregated particles are heavy and high density, resulting in the decrease of the surface active center and the decrease of COD removal.
Reusability
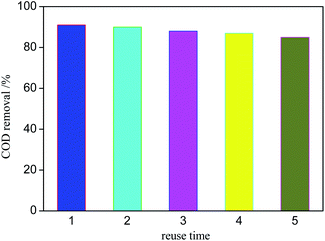
During the development of CWPO technology, the stability of catalyst is of great significance to its practical application. Fig. 11 shows the catalytic degradation effect of Ag/AgCl/CeO2(2) on organic matter for 5 times. The COD removal decreases slightly after each operation, but the catalyst still has more efficient activity. The COD removal is about 85% after the 5th reaction. The results show that Ag/AgCl/CeO2 has good stability and can be reused.Mechanism exploration
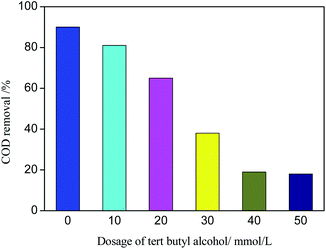
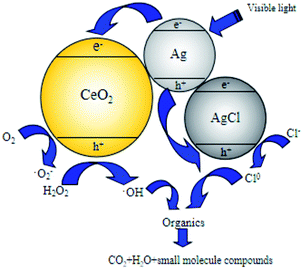
tert-Butyl alcohol is the scavenger of ˙OH.46 Different amounts of tert-butyl alcohol were added to the catalytic performance tests to verify the reaction mechanism of ˙OH chain formed in the degradation process of organic matter in photo-CWPO system. The effect of tert-butyl alcohol dosage on COD removal is shown in Fig. 12. According to Fig. 12, with the increase of tert-butyl alcohol amount, the COD removal decreases obviously. When the tert-butyl alcohol amount is 40 mmol L−1, the COD removal is 19%. Continue to increase the tert-butyl alcohol amount, the COD removal changes slightly. It is due to that ˙OH is more easily captured by tert-butyl alcohol during the competition with organics, almost all the generated ˙OH is captured by tert-butyl alcohol and generated inert substances, which inhibited the oxidative degradation of organics. When the amount of tert-butyl alcohol continues to increase, the COD removal remains at 19%, it is because active species such as h+, ˙O2− and Cl0 in photo-CWPO system can also oxidize organic pollutants.47 Meanwhile, it also indicates that ˙OH plays a major role in the degradation process of organic matter.In the photo-CWPO system, the degradation of organic compounds can be attributed to both Ag/AgCl plasma resonance and Ce3+/Ce4+ cycling. According to the mechanism of plasma photocatalysis of Ag@AgCl18 and the Fenton like mechanism of CeO2/H2O2,48 the reaction mechanism of Ag/AgCl/CeO2 in photo-CWPO system can be summarized as the following steps and as shown in Fig. 13. First of all, under visible light irradiation, due to the plasma resonance effect of Ag nanoparticles, it is easy to absorb visible light and produce photogenerated electron e− and hole h+. CeO2 has excellent dielectric transfer ability under visible light, which helps to improve its charge separation ability.49,50 Photogenerated electron e− is injected into the 4f band of CeO2 and trapped by oxygen on the CeO2 surface to form superoxide radicals (˙O2−), then form H2O2, hydroperoxyl (HO2−) and ˙OH. When the hole h+ is transferred to the surface of AgCl, another active radical species Cl0 is formed, which can oxidized the organic matter and reduced to Cl−. Therefore, through the synergistic effect of various active species in the photo-CWPO system, and these processes are stable and cyclic, so that organic pollutants can be effectively degraded.51
Conclusions
In this paper, silver/silver halide supported on mesoporous ceria particles (Ag/AgCl/CeO2) was successfully prepared using microwave assisted soft template method, deposition precipitation method and photoreduction method. The specific surface area of Ag/AgCl/CeO2 is 302.6–336.2 m2 g−1 and average pore size is 8.04–8.90 nm. The catalytic performance test showed that the Ag/AgCl has signifificantly improved the catalytic performance of CeO2 in photo-CWPO under visible light system. According to the experimental data, the COD removal of acrylonitrile wastewater reach 90%, and after the catalyst was used for 5 times, the COD removal can still reach 85% by using Ag/AgCl/CeO2(2) as catalyst under the optimum reaction condition. In addition, the synergistic effect of Ag, AgCl, CeO2 and H2O2 in photo-CWPO system were also observed. It is proved that ˙OH plays a major role in the degradation of organic matter in the photo-CWPO system.Conflicts of interest
The authors declare that they have no conflict of interest.Acknowledgements
The project was funded by National Water Pollution Control and Management Technology Major Projects (2012ZX07202-002); Science and Technology Research Project of Liaoning Provincial Department of Education (L2020020, L2020003).References
- A. Kumar and B. Prasad, Int. J. Environ. Sci. Technol., 2020, 17(3), 1809–1824 CrossRef CAS.
- H. H. Fenton, J. Chem. Soc., Trans., 1894, 65, 899–910 RSC.
- Tu, Y. Pan, H. J. Gao, B. Li and Y. H. Song, Environ. Sci. Pollut. Res., 2019, 26(24), 1–11 CrossRef.
- B. Wang and G. L. Jing, Recent Pat. Chem. Eng., 2013, 6(2), 127–132 CrossRef.
- A. Kumar, B. Prasad, V. K. Sandhwar and K. K. Garg, J. Environ. Chem. Eng., 2021, 9(3), 105177 CrossRef CAS.
- Y. Hu, Y. Li, J. He, T. Liu, K. S. Zhang and X. J. Huang, J. Environ. Manage., 2018, 226(15), 256–263 CrossRef CAS.
- H. Li, R. Cheng, Z. Liu and C. Du, Sci. Total Environ., 2019, 683(5), 638–647 CrossRef CAS.
- X. Hu, R. Li, S. Zhao and Y. Xing, Appl. Surf. Sci., 2017, 396, 1393–1402 CrossRef CAS.
- Z. Wan and J. Wang, Environ. Sci. Pollut. Res., 2017, 396(28), 1393–1402 Search PubMed.
- A. El Gaidoumi, J. M. Dona-Rodriguez, E. Pulido Melian, O. M. Gonzalez-Diaz, J. A. Navio and B. El Bali, Arabian J. Sci. Eng., 2019, 44(7), 6313–6325 CrossRef CAS.
- W. Long, W. Tong, W. Han and J. Zhong, Prog. Nat. Sci., 2018, 28(1), 24–27 CrossRef.
- B. Son, V. Q. Mai and D. X. Du, J. Porous Mater., 2016, 24(3), 601–611 CrossRef.
- Z. P. Li, F. Liu, Y. Ding, F. Wang, H. You and C. Jin, Chemosphere, 2019, 214(11), 17–24 CrossRef CAS PubMed.
- A. Hassani, G. Celikdag and P. Eghbali, Ultrason. Sonochem., 2018, 40(A), 841–852 CrossRef CAS.
- P. G. Munoz, G. Pliego, J. A. Zazo, B. Barbero, A. Bahamonde and J. A. Casas, Chem. Eng. J., 2016, 318(15), 89–94 Search PubMed.
- A. O. Ifelebuegu, J. Ukpebor and B. Nzeribe-Nwedo, Int. J. Environ. Sci. Technol., 2016, 13(12), 2757–2766 CrossRef CAS.
- M. Golestanbagh, M. Parvini and A. Pendashteh, Catal. Lett., 2018, 148(7), 2162–2178 CrossRef CAS.
- P. Wang, B. B. Huang and X. Y. Qin, Angew. Chem., Int. Ed., 2008, 47(41), 7773–7965 CrossRef.
- M. Wu, L. Yan, J. Li and L. Wang, Res. Chem. Intermed., 2017, 43(11), 6407–6419 CrossRef CAS.
- J. Zhang, C. G. Niu, J. Ke, L. F. Zhou and G. M. Zeng, Catal. Commun., 2015, 59, 30–34 CrossRef CAS.
- X. Guan, S. Lin, J. Lan, J. Shang and Q. Song, Cellulose, 2019, 26(12), 7437–7450 CrossRef CAS.
- F. Mu, C. Liu, Y. Xie, S. Zhou and D. Y. C. Leung, Chem. Eng. J., 2021, 415(6), 129010 CrossRef CAS.
- C. Gfab, A. Rn, A. Zy, L. D. Jing and A. Bd, J. Hazard. Mater., 2020, 403, 123964 Search PubMed.
- N. Su and F. Zhou, React. Kinet., Mech. Catal., 2020, 129(2), 1077–1089 CrossRef CAS.
- M. Chernykh, N. Mikheeva, V. Zaikovskii, M. Salaev and G. Mamontov, Catalysts, 2020, 10(5), 580–592 CrossRef CAS.
- B. Matovic, S. Butulija, Z. Dohcevic-Mitrovic, T. Arsic, J. Lukovic and S. Boskovic, J. Eur. Ceram. Soc., 2020, 40(5), 1983–1988 CrossRef CAS.
- M. M. Khan and S. A. Ansari, Ind. Eng. Chem. Res., 2014, 53(23), 9754–9763 CrossRef CAS.
- P. J. Brewer, A. S. Leach and R. Brown, Electrochim. Acta, 2015, 161, 80–83 CrossRef CAS.
- L. Yang, F. Wang, C. Shu, P. Liu, W. Zhang and S. Hu, Sci. Rep., 2016, 6, 21617 CrossRef CAS PubMed.
- D. Y. Zhao, Q. S. Huo, J. G. Feng, F. B. Chmelka and G. D. Stucky, J. Am. Chem. Soc., 1998, 120(24), 6024–6036 CrossRef CAS.
- K. Awazu, M. Fujimaki, C. Rockstuhl, J. Tominaga, H. Murakami and Y. Ohki, J. Am. Chem. Soc., 2008, 130(5), 1676–1680 CrossRef CAS.
- X. Chen, H. Zhu, J. Zhao, Z. Zheng and X. Gao, Angew. Chem., 2008, 47(29), 5353–5356 CrossRef CAS PubMed.
- A. Di, Y. Wang and G. Chen, Funct. Mater. Lett., 2018, 11(1), 1850006.1–1850006.4 CrossRef.
- M. Chernykh, N. Mikheeva, V. Zaikovskii, M. Salaev and G. Mamontov, Catalysts, 2020, 10(5), 580–591 CrossRef CAS.
- E. G. Heckert, S. Seal and W. T. Self, Environ. Sci. Technol., 2008, 42(13), 5014–5019 CrossRef CAS.
- S. J. Wu, Y. Yang, C. X. Lu, Y. Y. Ma, S. X. Yuan and G. R. Qian, Eur. J. Inorg. Chem., 2018, 25, 2944–2951 CrossRef.
- S. Q. Wang, H. Li and M. Wu, J. Cleaner Prod., 2021, 303, 126825 CrossRef CAS.
- B. Yadav and V. C. Srivastava, Clean Technol. Environ. Policy, 2017, 19(5), 1547–1555 CrossRef CAS.
- X. J. Wen, C. G. Niu, D. W. Huang, L. Zhang, C. Liang and G. M. Zeng, J. Catal., 2017, 355, 73–86 CrossRef CAS.
- V. Subbaramaiah, V. C. Srivastava and I. D. Mall, J. Hazard. Mater., 2013, 248–249(15), 355–363 CrossRef CAS.
- P. Mohammad, A. Seyed, A. Hamidreza and R. Mehran, Catalysts, 2018, 8(9), 388–399 CrossRef.
- X. M. Guan, Y. F. Zhan, L. Yang, J. W. Lan and S. Lin, Cellulose, 2020, 27(11), 6383–6398 CrossRef CAS.
- L. G. Devi, S. G. Kumar, K. M. Reddy and C. Munikrishnappa, J. Hazard. Mater., 2009, 164(2–3), 459–467 CrossRef PubMed.
- M. M. Ahmed and S. Chiron, Water Res., 2014, 48(1), 229–236 CrossRef CAS PubMed.
- S. Singh and S.-L. Lo, Chem. Eng. J., 2017, 309(1), 753–765 CrossRef CAS.
- H. Yan, R. Wang, R. X. Liu, T. Xu and J. Wang, Appl. Catal., B, 2021, 291(8), 120096 CrossRef CAS.
- Y. Baba, T. Yatagai, T. Harada and Y. Kawase, Chem. Eng. J., 2015, 277(1), 229–241 CrossRef CAS.
- E. G. Heckert, S. Seal and W. T. Self, Environ. Sci. Technol., 2008, 42(13), 5014–5019 CrossRef CAS PubMed.
- Y. Zou, H. Huang, S. Li, J. Wang and Y. Zhang, J. Photochem. Photobiol., A, 2019, 376, 43–53 CrossRef CAS.
- C. G. Li, L. H. Yue, J. J. Wang, H. Zhou, R. Zhang and K. Li, Environ. Technol., 2021, 22(1), 1–16 Search PubMed.
- V. Gosu, S. Arora and V. Subbaramaiah, Environmental Engineering Research, 2019, 25(4), 488–497 CrossRef.
| This journal is © The Royal Society of Chemistry 2021 |

