 Open Access Article
Creative Commons Attribution 3.0 Unported Licence
Cyan color-emitting nitrogen-functionalized carbon nanodots (NFCNDs) from Indigofera tinctoria and their catalytic reduction of organic dyes and fluorescent ink applications†
Jothi Vinoth Kumara,
Ganesan Kavithaa,
Rajaram Arulmozhi a,
Velusamy Arulb and
Natarajan Abirami
 *a
*a
aDepartment of Chemistry, College of Engineering and Technology, SRM Institute of Science and Technology, Kattankulathur, Tamil Nadu-603 203, India. E-mail: abiramin@srmist.edu.in
bDepartment of Science and Humanities, Sri Venkateswaraa College of Technology, Vadkkal, Sriperumbudur, Chennai-602 105, Tamil Nadu, India
First published on 16th August 2021
Abstract
The present study reports the synthesis of nitrogen-functionalized carbon nanodots (NFCNDs) by a low-cost hydrothermal method using the leaf extract of Indigofera tinctoria as a novel carbon precursor. The synthesized NFCNDs were characterized by diverse spectroscopic techniques. The optical properties of N-CNDs were analyzed by UV-visible and fluorescence spectroscopic studies. The quantum yield (QY) for the prepared NFCNDs was found to be 12.6%. The surface morphology, functional groups, and crystallinity of NFCNDs were evaluated by HR-TEM, FT-IR, XRD and Raman spectroscopic methods, respectively. The Raman results revealed the moderate graphite structure of NFCNDs, and the calculated ID/IG value was 0.49. The spherical appearance of the synthesized NFCNDs was confirmed by HR-TEM, and the calculated size of the NFCNDs was 4 nm. The XRD and SAED pattern results gives an evidence for the amorphous nature of the prepared NFCNDs. The thermal stability of NFCNDs was studied by TGA analysis. The resulting NFCNDs acted as a green nanocatalyst and thus efficiently improved the reducing capability of sodium borohydride (NaBH4) in the catalytic reduction of methylene blue (MB) and methyl orange (MO) dyes. Furthermore, the bright cyan emission characteristics of synthesized NFCNDs were utilized as a labeling agent in anti-counterfeiting applications.
1 Introduction
Carbon-based nanomaterials such as carbon nanotubes,1 graphene oxide,2 fullerenes,3 and carbon nanodots4,5 have been playing vital roles in science and technology in the past two decades. Among these, carbon nanodots (CNDs) are fluorescent carbon nanomaterials that have been engaged at the forefront of recent research.6 Carbon nanodots (CNDs) are nanoparticles 1–10 nm in size, which were unexpectedly discovered by Anbu et al. during the purification of single-walled carbon nanotubes in 2004.7 The properties of the CNDs mainly depend on two factors: first, the choice of the carbon source (raw material), and second, the synthesis method. CNDs are quite divergent from other carbon-based nanomaterials due to their exclusive outstanding properties, such as high water dispersibility, strong chemical inertness, fluorescence, excellent photostability, less toxic nature, excellent bio-compatibility, environmental friendliness, low cost and flexibility in surface modification.8,9 CNDs have multipurpose applications in various fields, such as drug delivery, optoelectronic devices, sensing of metal ions, biological imaging, biomolecules, catalysis, solar cells, and the oxygen reduction reaction.10–16CNDs have been synthesized by various top-down methods, including laser ablation, ultrasonic treatment, arc-discharge, and electrochemical and chemical oxidation, and bottom-up methods such as hydrothermal carbonization, microwave irradiation, pyrolysis, and plasma treatment.17 Among these synthesis methods, arc discharge and laser ablation processes need highly expensive instruments, whereas electrochemical oxidation and chemical oxidation need strong acids. The microwave irradiation method demonstrates a simple way to synthesize CDs within few minutes; this method can be restricted by uncontrollable reaction conditions. The hydrothermal method is simplistic, quick, and economical, has a simple experimental setup, is and eco-friendly when compared to other synthesis methods. Carbon dots with tunable degrees of carbonization usually consist of carbon (C), oxygen (O), and hydrogen (H) decorated with various functional groups on their surfaces. Using inexpensive and eco-friendly biomass sources such as Phyllanthus emblica, prickly pear cactus, rice bran, Coccinia indica, and sweet potatoes as carbon precursors to harvest CNDs has attracted great attention because of their green approach.18–22 The plant extracts containing citric acid, tartaric acid, and ascorbic acid act as efficient carbon precursors for the synthesis of highly fluorescent CNDs. The fluorescence properties of CNDs are influenced by solvents, size, pH, and dopants used during the synthesis. Recently, surface functionalization on CNDs was achieved by doping heteroatoms (such as boron, sulphur, nitrogen, and phosphorous). The functionalization of nitrogen tremendously increases the optical properties of CNDs when compared to undoped CNDs. At the same time, other important features of CNDs, such as the quantum yield (QY) and fluorescence lifetime, are significantly improved by the functionalization approach. Further, the heteroatom doping affects the internal sharing of electrons in CDs and thus can change the bandgap energy, which results in escalated fluorescence intensity of CNDs.23,24 These functionalized CNDs act as remarkable fluorescent probes in bio-imaging, catalysis, and chemo-sensing applications.25–28
In this work, Indigofera tinctoria (I. tinctoria), which belongs to the Fabaceae family, is used as a carbon precursor. This plant with medicinal values is found in various places in India. The phytochemical constituents present in the I. tinctoria leaf extracts are alkaloids, proteins, free amino acids, phenolic compounds, flavonoids, etc. The extracts are very useful for hair growth, epilepsy, chronic bronchitis, ulcers, skin diseases, and asthma, and are also used in cancer treatment.29 Due to the availability of rich bioactive components, I. tinctoria leaf extracts are widely used for many biological activities, such as antifungal, antimicrobial, antioxidant, anti-seborrhea, anti-psoriatic, anti-inflammatory, and anti-acne.30,31 Besides the above merits, I. tinctoria leaf extract was elected as a novel carbon precursor for the synthesis of CNDs.
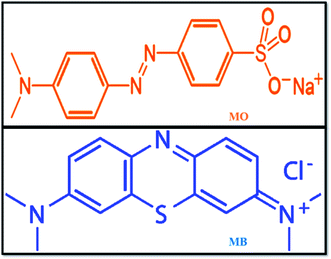
With the rapid development of the dyeing industry, pharmaceutical industries, and printing technology, untreated sewage is being mixed into lakes and rivers every day, which is very harmful to humans and also to marine aquatic organisms. Hence, it is now a critical situation to treat organic dye-containing industrial wastewater using current technologies.32 Various methodologies have been adopted for the removal of harmful pollutants from waste effluents, such as adsorption,33 Fenton oxidation,34 photocatalytic reduction,35 and adsorbent membrane separation.36 Methyl orange (MO) is a sulphonated azo dye; due to its high toxicity, it causes harmful effects to human health and aquatic organisms.37 MO is widely used in textiles and in chemical laboratories as a pH indicator (pKa = 3.5). Further, most industries use methylene blue (MB) dye, which is a highly carcinogenic thiazine dye, as a coloring agent. MB creates health problems, such as eye burns, skin irritation, cancer, and allergic dermatitis, for humans and animals. At present, it is very necessary to take action to remove these harmful pollutants from the environment using modern technologies. The chemical structures of MO and MB dyes are shown in Fig. 1.
Counterfeiting is a major problem owing to its wide-ranging impact on various companies, governments, and customers. Therefore, it is mandatory to produce anti-counterfeiting agents that ease the identification of fake currencies, including public documents and certificates.38 CNDs seem to be advantageous as anti-counterfeiting agents, as they possess good fluorescence properties, great quantum yields, low cytotoxicity, and abundant sources. To our knowledge, the anti-counterfeiting applications of NFCNDs obtained from I. tinctoria plant extract as a fluorescent material have not been reported yet.
In the present research contribution, the conversion of waste pollutant water to commercial material is reported via the green synthesis of blue-fluorescent nitrogen functionalized carbon nanodots (NFCNDs) using easily available Indigofera tinctoria (I. tinctoria) leaf extract as a carbon source with aq. ammonia as the nitrogen (N) source by a hydrothermal carbonization process. The prepared NFCNDs were carefully characterized by important spectroscopic tools. Furthermore, the catalytic ability of the NFCNDs was carefully examined in the reduction of MB and MO in the presence of NaBH4 (reducing agent). Also, owing to their highly fluorescent properties, the NFCNDs may be used as an anti-counterfeiting agent.
2 Materials and methods
2.1 Chemicals and reagents
The Indigofera tinctoria leaf was collected from Nathapattu Village, Cuddalore District of Tamil Nadu, India. Aqueous ammonia, methylene blue, methyl orange, sodium borohydride, and polyvinyl alcohol (PVA) were purchased from Avra Synthesis. All laboratory-grade chemicals and reagents were used exclusive of addistional purification. Double distilled water was used for solution preparation and other purposes during the entire study.2.2 Extract preparation
Freshly collected Indigofera tinctoria plant leaf (50 g) was carefully washed with distilled water to remove impurities. The cleaned leaf was homogenically ground in an electric mixer by adding 100 mL of double-distilled water. The mixture was continuously heated at 30 °C, stirred for 1 h and then filtered, first by using Whatman filter paper and then by centrifugation at 10![[thin space (1/6-em)]](https://www.rsc.org/images/entities/char_2009.gif) 000 rpm for 15 min; finally, the supernatant was collected and used as a carbon source for the synthesis of NFCNDs.
000 rpm for 15 min; finally, the supernatant was collected and used as a carbon source for the synthesis of NFCNDs.
2.3 Synthesis of NFCNDs
For the green synthesis of NFCNDs, 49 mL of Indigofera tinctoria leaf extract was mixed with 1 M solution of aq. NH3 (1 mL), which was transferred to a 100 mL autoclave (Teflon-lined) and placed inside a hot air oven at 180 °C for 12 hours. After 12 h of the hydrothermal process, the autoclave was allowed to cool to room temperature; it was then carefully opened, and the formation of NFCNDs was visually confirmed by the observed color change from light green to dark brown. The obtained solution containing NFCNDs was filtered by Whatman 40 filter paper and further subjected to centrifugation at 10![[thin space (1/6-em)]](https://www.rsc.org/images/entities/char_2009.gif) 000 rpm for 40 min to afford pure NFCNDs without large carbon residues or unreacted organic moieties. The obtained NFCNDs solution was further filtered by a 0.2 μm membrane to afford the pure NFCNDs, which were collected in an amber glass bottle and stored at 4 °C for further characterization and applications.
000 rpm for 40 min to afford pure NFCNDs without large carbon residues or unreacted organic moieties. The obtained NFCNDs solution was further filtered by a 0.2 μm membrane to afford the pure NFCNDs, which were collected in an amber glass bottle and stored at 4 °C for further characterization and applications.
2.4 Instrumentation
The synthesized NFCNDs were examined and confirmed by various spectroscopic studies. The characteristics of the NFCNDs were analyzed by UV-visible spectra (Shimadzu UV-2600 spectrophotometer) and a HORIBA JOBIN YVON F-luromax-4 spectrofluorometer, respectively. The recorded absorption and emission data were plotted using “UVPROBE’’ software. The various functionalities present on the synthesized NFCNDs were explored by an Agilent Resolution FTIR spectrometer in the operating range between 400 and 4000 cm−1. A PAN analytical X'Pert power diffractometer was used to examine the amorphous nature of the NFCNDs using a Cu Kα radiation source with a range of 10 to 80° (2θ). The structural morphology of the NFCNDs was analyzed by a JOEL/JEM 2100 high resolution transmission electron microscope (HR-TEM) at an operating voltage of 200 kv using a carbon-coated Cu grid. The electronic states and elemental analyses of the NFCNDs were determined by recording XPS spectra using a Kratos Axis XPES spectrometer containing Al Kα X-rays as an electron beam source. Raman spectra were obtained using a Renishaw Raman scope at 633 nm (λex).2.5 Quantum yield measurement
The quantum yield (QY) of the prepared NFCNDs was calculated using eqn (1). The QY was calculated using the reference of 0.1 M quinine sulfate (QY = 0.54%) dissolved in H2SO4 at 370 nm.39| Qx = Qstd(Ix/Istd)(ηx2/ηstd2)(Astd/Ax) | (1) |
2.6 Evaluation of the photocatalytic reduction of NFCNDs
The reduction of MB and MO dyes using sodium borohydride (NaBH4) with the help of the prepared NFCNDs catalyst was performed under the irradiation of visible light produced by a 300 W xenon lamp. For conducting the photocatalytic reaction, 1 mL of freshly prepared ice-cold NaBH4 (0.05 M) was separately added to 14 mL (10 ppm) of newly prepared MB and MO dye solution, and 15 mL of DD water was also added to the mixture. To start the catalytic reduction reaction, the identical mixture of the initial reaction solution was taken, and 60 μL of catalyst (NFCNDs) was added to the MO and MB reaction mixtures. The solution was placed at 80 mm away from the visible light source (xenon lamp) and irradiated with slow stirring until dye decoloration occured. A 2.5 mL sample was taken at linear time intervals, and the reduction dynamics (absorption intensity) were observed using UV-vis spectroscopy (Shimadzu UV-2600).2.7 Preparation of NFCNDs fluorescent ink
For the preparation of the anti-counterfeiting fluorescent ink, a 5 mL NFCNDs sample was dissolved in 10 mL of 5% polyvinyl alcohol under ultrasonic treatment for 10 min. This mixture was magnetically stirred for 2 h until a high-viscosity ink formed. Next, the prepared ink was transferred into an empty refill tube, and hand-writing or drawing of images on normal filter paper was performed; then, the ink was allowed to dry in ambient air. After 2 h, the dried paper was examined under UV light at 365 nm and the obtained visible images were captured using a camera.3 Results and discussion
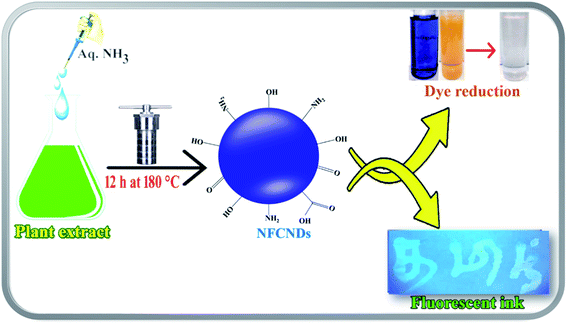
The leaf extract of I. tinctoria and aq. NH3 were employed as the carbon and nitrogen source, respectively. The formation of NFCNDs was preliminarily confirmed thorough visual observation of the color change. The reaction time and temperature play crucial roles in the formation of highly fluorescent and stable NFCNDs with desired properties.40 The graphical representation of the hydrothermal synthesis of NFCNDs is given in Scheme 1.3.1 UV-visible and fluorescence spectra of the synthesized NFCNDs
Fig. 2(a) displays the UV-vis spectrum of the carbon source (I. tinctoria leaf extract) and prepared NFCNDs in aqueous media. The absorption peak for I. tinctoria leaf extract appeared at 279 nm owing to the pi–pi* transition; it was obtained due to presence of polyphenols in the leaf extract and the aq. ammonia added to the reaction mixture, and then carbonization took place via condensation reactions to finally afford the NFCNDs.41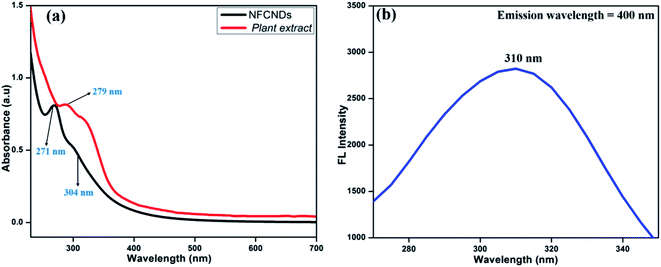 | ||
| Fig. 2 (a) UV-vis absorbance spectra of the plant extract and prepared NFCNDs; (b) fluorescence excitation spectrum of the prepared NFCNDs. | ||
The two main characteristic peaks appeared for NFCNDs at 271 nm and 304 nm, which correspond to the pi–pi* transition for the sp2 carbon (C![[double bond, length as m-dash]](https://www.rsc.org/images/entities/char_e001.gif) C bonds) and n-pi* transitions of the carbonyl and amine functionalization on the NFCNDs surface, respectively.42 The UV-vis absorption values of the NFCNDs spectrum showed a red shift due to the introduction of ammonium functionalities by the addition of ammonia solution during the synthesis, and this could have efficiently converted the phenolic (–OH) groups into ammonium phenolate ions.43 The fluorescence excitation spectra of the NFCNDs (Fig. 2b) exhibited peaks at 310 nm, respectively, which evidently confirms the n–pi* transition. The UV-visible spectra of the synthesized NFCNDs indicated emission of cyan color (blue luminescence) under UV light at 365 nm.
C bonds) and n-pi* transitions of the carbonyl and amine functionalization on the NFCNDs surface, respectively.42 The UV-vis absorption values of the NFCNDs spectrum showed a red shift due to the introduction of ammonium functionalities by the addition of ammonia solution during the synthesis, and this could have efficiently converted the phenolic (–OH) groups into ammonium phenolate ions.43 The fluorescence excitation spectra of the NFCNDs (Fig. 2b) exhibited peaks at 310 nm, respectively, which evidently confirms the n–pi* transition. The UV-visible spectra of the synthesized NFCNDs indicated emission of cyan color (blue luminescence) under UV light at 365 nm.
Fig. 3 displays the fluorescence emission spectral responses of the synthesized NFCNDs at various excitation wavelengths. With increasing excitation wavelengths (λex) from 270 nm to 400 nm, the highest intensity of emission (λmax) was found at 400 nm. The fluorescence intensity (FL) was progressively increased by increasing λex from 270 to 310 nm (Fig. 3a) owing to the pi–pi* transitions of the sp2 carbon cores. Furthermore (Fig. 3b), the emission intensity gradually decreased with increasing λex from 310 nm to 400 nm, and the λmax of 400 nm was observed at 310 nm. This specific fluorescence property of the NFCNDs may arise due to the anti-Stokes fluorescence (λmax(ext) > λmax(em)), where two or more photons are equally absorbed by carbon particles, resulting in the emission of light.44 The fluorescence quantum yield (QY) for NFCNDs was found to be 12.6%. In our previous work, we had reported the preparation of self-passivated CDs using rice bran as a carbon source, and the obtained QY was 7.4%. It is confirmed that nitrogen is an effective functional moiety for the functionalization of CNDs, which would be helpful to alter their optical properties. For clear understanding, a comparison of the QYs and fluorescence nature of CDs prepared from different precursors with those of the synthesized NFCNDs is given in Table 1 (ESI).† Moreover, the highly fluorescent nature of the NFCNDs indicates that they are the most suitable probe for sensing, multi-color bio-imaging, and drug delivery applications.45
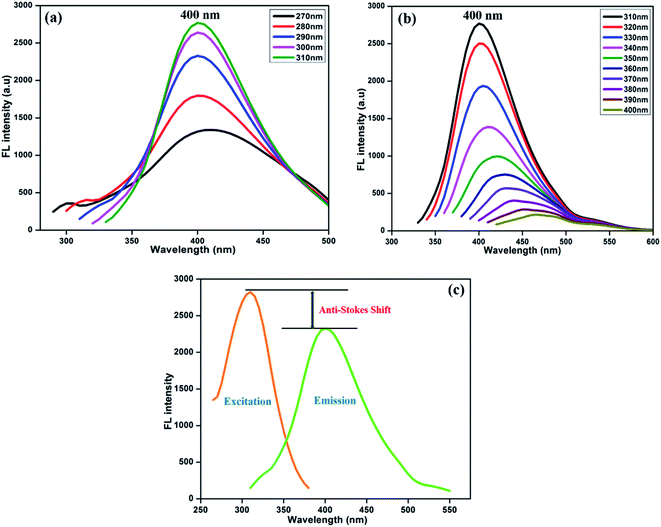 | ||
| Fig. 3 Fluorescence spectra of the prepared NFCNDs at different excitation wavelengths from (a) 270–310 nm and (b) 310–400 nm and (c) anti-Stokes shift of the NFCNDs. | ||
3.2 Morphology and size of the NFCNDs
The morphological structure and particle size of the formed NFCNDs were inspected by HR-TEM. Fig. 4a displays the spherical morphology of the formed NFCNDs, which clearly indicates that the carbon particles were evenly spread on the Cu grid. Fig. 4b shows the size distribution chart (ranging from 1.0 to 10 nm) and depicts that the formed NFCNDs have an average size of around 4 nm. The higher magnification TEM image (Fig. 4c) of the NFCNDs clearly displays the lattice fringes, and the calculated interlayer distance (d-spacing) is about 0.21 nm parallel to the (100) planes of graphite.46 Furthermore, Fig. 4d shows the selected area electron diffraction (SAED) outline of the NFCNDs, which confirmed the amorphous phase of carbon by the formation of clear circles.33,34,40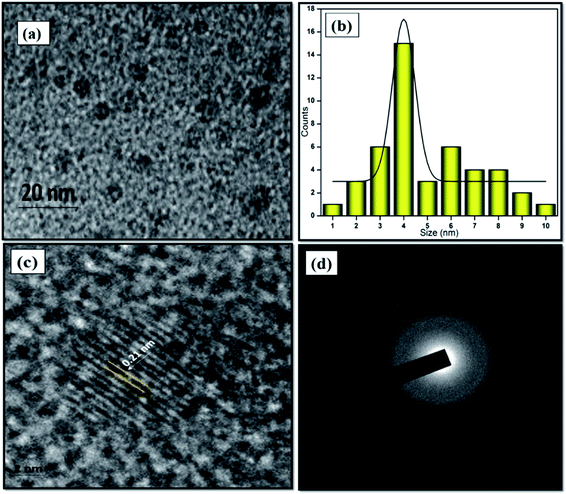 | ||
| Fig. 4 (a) TEM images of the formed NFCNDs at 20 nm, (b) histogram of the NFCNDs, (c) high-resolution image of the lattice fringes, (d) SAED outline of the NFCNDs. | ||
3.3 X-ray diffraction
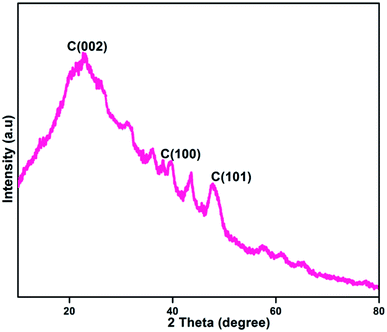
Fig. 5 shows the X-ray diffraction (XRD) pattern of the formed NFCNDs. The XRD spectrum provides a wide peak at 2θ values of 22.73°, 43.6° and 47.7° for the C (002), C (100) and C (101) planes of graphitized carbon core, respectively.47,48 The amorphous phase of the NFCNDs is confirmed by the appearance of a broad peak at 2θ = 22.73°. Bragg's equation (d = nλ/2![[thin space (1/6-em)]](https://www.rsc.org/images/entities/char_2009.gif) sin
sin![[thin space (1/6-em)]](https://www.rsc.org/images/entities/char_2009.gif) θ) was used to calculate the d-spacing (interlayer distance) value for the formed NFCNDs. Using Bragg's equation, the d-spacing values were found to be 0.38 nm and 0.21 nm, which correspond to the C (002) and C (100) planes, respectively. These results could be associated with the calculated-spacing values from the HR-TEM lattice fringe images (Fig. 4(c)).49 These observations clearly confirmed that the formed NFCNDs generally have an amorphous structure due to the presence of well-defined graphitic carbon cores.
θ) was used to calculate the d-spacing (interlayer distance) value for the formed NFCNDs. Using Bragg's equation, the d-spacing values were found to be 0.38 nm and 0.21 nm, which correspond to the C (002) and C (100) planes, respectively. These results could be associated with the calculated-spacing values from the HR-TEM lattice fringe images (Fig. 4(c)).49 These observations clearly confirmed that the formed NFCNDs generally have an amorphous structure due to the presence of well-defined graphitic carbon cores.
3.4 FTIR spectroscopy
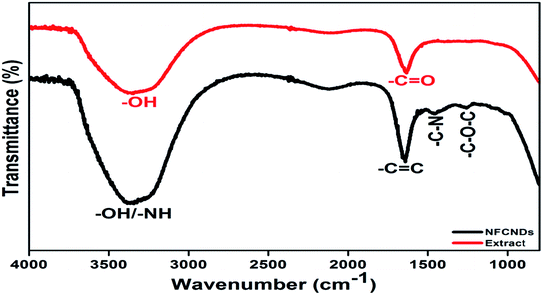
The FT-IR spectral responses of I. tinctoria extract and the formed NFCNDs are depicted in Fig. 6. Two absorption bands appeared in the IR spectrum of I. tinctoria leaf extract at 3336 and 1634 cm−1, which belong to the –OH str and –C![[double bond, length as m-dash]](https://www.rsc.org/images/entities/char_e001.gif) O str, respectively. The prepared NFCNDs showed absorption peaks at 3387, 1652, 1456, and 1261 cm−1, corresponding to the –OH/–NH, –C
O str, respectively. The prepared NFCNDs showed absorption peaks at 3387, 1652, 1456, and 1261 cm−1, corresponding to the –OH/–NH, –C![[double bond, length as m-dash]](https://www.rsc.org/images/entities/char_e001.gif) C (sp2 carbon), –C–N (N functionalization), and –C–O–C functionalities; it was clearly observed that the functional moieties of I. tinctoria leaf extract were transferred due to the hydrothermal reaction, and the nitrogen was also functionalized in the NFCNDs.50,51 These FT-IR results revealed that acid functionalities, carbonyl groups, and amide, amine, and hydroxyl moieties were present in the aqueous soluble NFCNDs.
C (sp2 carbon), –C–N (N functionalization), and –C–O–C functionalities; it was clearly observed that the functional moieties of I. tinctoria leaf extract were transferred due to the hydrothermal reaction, and the nitrogen was also functionalized in the NFCNDs.50,51 These FT-IR results revealed that acid functionalities, carbonyl groups, and amide, amine, and hydroxyl moieties were present in the aqueous soluble NFCNDs.
3.5 Raman spectra
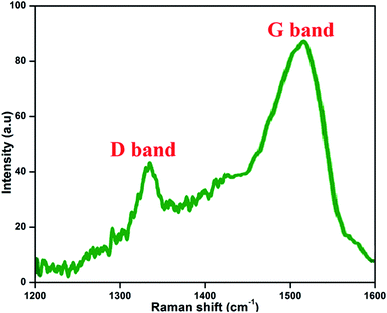
Fig. 7 presents the Raman spectrum of the prepared NFCNDs; this is the most valuable technique for the examination and confirmation of carbon-related nanomaterials. The Raman spectrum depicts two peaks at 1337 cm−1 and 1519 cm−1, which belong to the D band (defect region) and G band (graphitic region) in the NFCNDs, respectively. The D band arises due to sp3 defects, and the appearance of the G band indicates that the NFCNDs are mostly composed of sp2 carbon cores.52 The graphitic nature of the formed NFCNDs was determined by the degree of graphitization. The intensity ratio between the D and G bands (ID/IG) is less than 1 for ideal graphite.53 Here, the ID/IG value was found to be 0.49, which depicts the moderate graphite structure of the prepared NFCNDs and also confirms the existence of minimal surface defects in the graphitic structure of the NFCNDs.3.6 Thermal stability of the NFCNDs
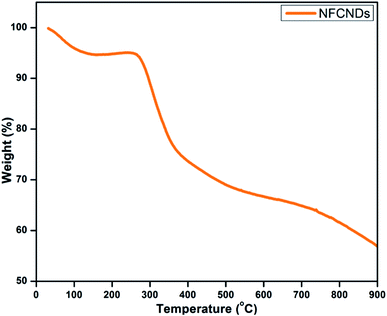
Thermogravimetric analysis (TGA) was employed to determine the thermal stability of the synthesized NFCNDs, as shown in Fig. 8. In the beginning, a 12% weight loss occurred owing to the decomposition of the water molecules. Further, a consequent weight loss was acquired from 300–400 °C, which was ascribed to the desorption of the hydroxyl and carboxyl groups. When the temperature was raised to 700 °C, a 60% weight loss was observed, which could be due to the elimination of functional groups on the carbon skeleton of the prepared NFCNDs.543.7 X-ray photoelectron spectroscopy
The diverse surface electronic states and elemental composition of the NFCNDs were explored by X-ray photoelectron spectroscopy (XPS). Fig. 9a depicts the survey spectrum of the NFCNDs, which displayed the C 1s (carbon), N 1s (nitrogen), and O 1s (oxygen) peaks at 285, 399, and 530 eV, respectively. The C 1s spectra were deconvoluted into three distinct peaks at 284.5, 285.7, and 288.1 eV, as shown in Fig. 9b, which were ascribed to C–H, C![[double bond, length as m-dash]](https://www.rsc.org/images/entities/char_e001.gif) C (sp2), and C–N bonds, respectively.52 Fig. 9c demonstrates the deconvoluted N 1s spectra, which show two diverse peaks at 398.3 and 399.8 eV owing to the amine (C–NH2) and amide (O
C (sp2), and C–N bonds, respectively.52 Fig. 9c demonstrates the deconvoluted N 1s spectra, which show two diverse peaks at 398.3 and 399.8 eV owing to the amine (C–NH2) and amide (O![[double bond, length as m-dash]](https://www.rsc.org/images/entities/char_e001.gif) C–NH2) groups existing in the formed NFCNDs. The high resolution (O 1s) spectrum (Fig. 9d) provides two disparate peaks at 531.5 and 532.1 eV, which can be attributed to the C
C–NH2) groups existing in the formed NFCNDs. The high resolution (O 1s) spectrum (Fig. 9d) provides two disparate peaks at 531.5 and 532.1 eV, which can be attributed to the C![[double bond, length as m-dash]](https://www.rsc.org/images/entities/char_e001.gif) O and C–OH/C–O–C functionalities in the NFCNDs, respectively.55 Finally, the XPS spectrum suggests that the atomic percentages of the elements in the NFCNDs were C (74.6%), N (8.2%), and O (17.2%). From the overall discussion, it is evident that amine, hydroxyl, carboxyl and amide functional groups are present in the formed NFCNDs.
O and C–OH/C–O–C functionalities in the NFCNDs, respectively.55 Finally, the XPS spectrum suggests that the atomic percentages of the elements in the NFCNDs were C (74.6%), N (8.2%), and O (17.2%). From the overall discussion, it is evident that amine, hydroxyl, carboxyl and amide functional groups are present in the formed NFCNDs.
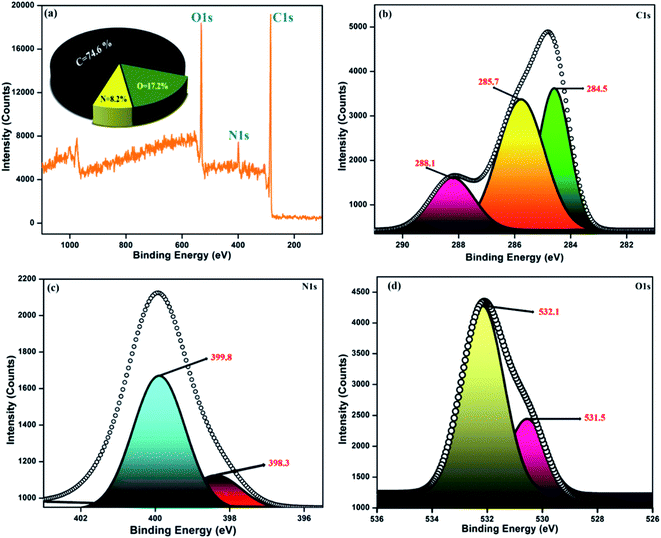 | ||
| Fig. 9 (a) Full survey spectrum of the synthesized NFCNDs (inset: elemental percentage graph); (b) C 1s, (c) N 1s, (d) O 1s. | ||
4 Applications of the NFCNDs
4.1 Photocatalytic activity of the NFCNDs
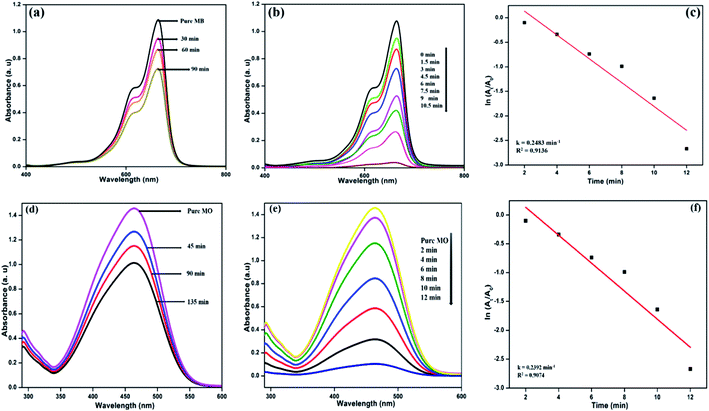
The photocatalytic activity of the formed NFCNDs was evaluated through catalytic reduction of MB and MO dyes. The absorption intensity of blue MB dye was at 664 nm and that of orange MO was at 466 nm. The prepared NFCNDs served as a green catalyst in this environmental remediation process. Photocatalytic reduction of MB and MO dyes performed under light irradiation with an ice-cooled conditioned reducing agent (NaBH4) and in the presence and absence of NFCNDs (green catalyst) was investigated in this work. Fig. 10a shows the UV-vis absorption spectra of MB and MO after UV light irradiation using NaBH4 without prepared NFCNDs for a regular period. The intensity of MB and MO (Fig. 10a and d) was found to decrease to the minimum extent after 90 min and 135 min, respectively, which displays no significant change in intensity; this indicates that complete reduction does not occur. On the other hand, when the prepared NFCNDs (60 microliters) were added to the mixtures of MB and MO containing sodium borohydride, a significant reduction was observed in the intensity of the dyes (Fig. 10b and e). Finally, the reduction of MB was completed within 10.5 min, and that of MO was completed in 12 min by addition of the efficient green catalyst NFCNDs. Further, the photocatalytic degradation of MB and MO dyes was investigated using undoped CNDs, and the results are given in ESI Fig. 1.† Even after 120 min, no sigficant reduction was attained while using undoped CDs as a catalyst. In the case of using NFCNDs as a catalyst, the photocatalytic degradation of MB and MO was completed in a very short period of time compared to the undoped CNDs catalyst. The results confirmed that the catalytic activity of the NFCNDs effectively improved the rate of the reduction of the MB and MO dyes using NaBH4. This could be achieved by decreasing the activation energy of the reduction reaction owing to the incorporation of NFCNDs into the reduction process.56The determination of the rate of the reaction (Kcat) for the dye reduction of MB/MO by the prepared NFCNDs (catalyst) could be calculated from the pseudo-first-order kinetics. Fig. 10c and f show the pseudo-first-order kinetics plots for the reduction of MB and MO using NFCNDs. The rate constants (Kcat) and coefficients (R2) could be obtained from the slopes of the linear plots; the Kcat and R2 values of MB and MO reduction were found to be 0.2483 min−1 and 0.9136 and 0.2392 min−1 and 0.9074, respectively. The acquired Kcat values for the reduction of MB and MO by the NFCNDs were higher than those in earlier reports.
This photocatalytic catalytic reduction of MB and MO could be explored using the well-known Langmuir Hinshelwood mechanism.56 The MB and MO dyes function as electrophiles, and the borohydride (BH4−) ions act as a nucleophile. Concurrent adsorption takes place above the surface of the NFCNDs, and the transformation of electrons occurs from BH4− ions to MB and MO through the green catalyst. The synthesized NFCNDs act as an electron transfer mediator between dye molecules and BH4− ions. This only leads to the reduction reaction of MB and MO dyes. During this reaction, electrons from BH4− ions transfer from the VB to the CB in the NFCNDs. Due to this electron transfer, a hole is created in the VB, and this hole reacts with H2O and O2 to produce hydroxide (OH˙) and oxygen (O2˙) radicals, simultaneously. If only O2˙ radicals are formed, the reduction reaction takes place at a comparatively slow rate. The formation of both radicals led to the reduction reactions of MB and MO, which were thus completed in a short period. NFCNDs efficiently served as a mediator for these electron transformations, and this suggests reduction of the energy obstacles among the starting materials (reactants) and final products.57 Hence, the wide surface to volume ratio and effective electron withdrawing potential of the synthesized NFCNDs are the major reasons for this remarkable catalytic photocatalytic reduction.40
Fig. 11a displays the possible mechanisms of the reduction of MB and MO. Finally, photographs of the decolorized dye solutions are shown in Fig. 11b, and schematics of the reduction reactions of the dyes are also shown in Fig. 11c. The toxic MB and MO dyes were converted into eco-friendly products through the green catalyst. The results conclude that the prepared NFCNDs were proved to be an effective alternate for metal nanocatalysts in the removal of environmental pollution.58
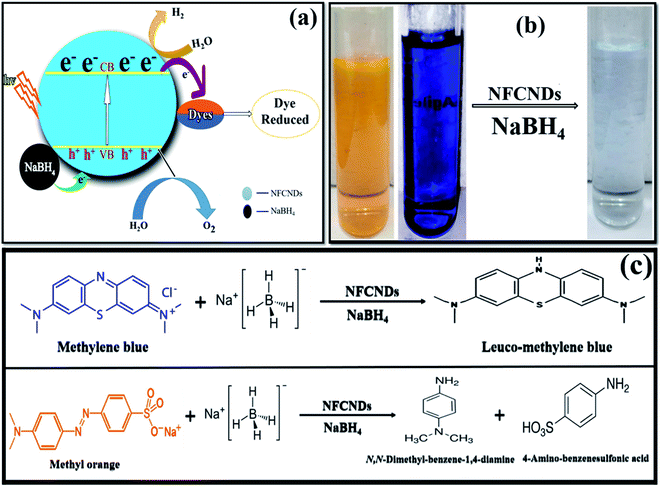 | ||
| Fig. 11 (a) Possible reduction mechanism. (b) Photographs of the initial dyes and treated water. (c) Reaction reduction mechanism of MB/MO. | ||
4.2 NFCNDs as a fluorescent ink
Finding an innovative application which is suitable for developing materials such CNDs is economically important. Currently, a wide range of the dyes, coloring agents, and polymers that are used for various industrial and forensic applications are extremely toxic and also have high cost. Here, the synthesized NFCNDs possess unique properties, high biocompatibility, strong fluorescence, a low/nontoxic nature, and transparency in the visible region, which encourages the use of this carbon nanomaterial as an alternate candidate for various important applications. In this recent scenario, the solubilized fluorescent NFCNDs were utilized as a fluorescent ink in anti-counterfeiting applications. The prepared fluorescent ink containing NFCNDs was filled in an empty ink pen; some letters were written on white paper, allowed to dry at room temperature and placed under UV light (365 nm). Fig. 12a displays the image of the white paper in naked eye view, and no visible letters can be observed; however, Fig. 12b depicts the image of the same white paper under 365 nm UV light, which shows clearly visible blue fluorescent patterns of the written letters when subjected to ultra-violet light irradiation, and these letters can be easily removed by water. The visible patterns evidently indicate the cyan fluorescence emission of the NFCNDs and are also helpful to extend the applications of the material to the forensic and anti-counterfeiting fields.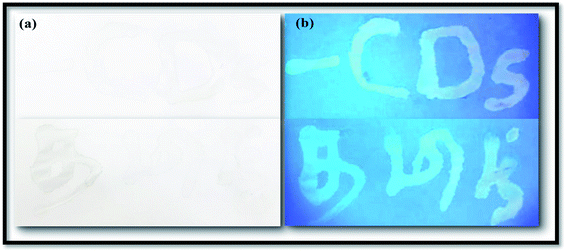 | ||
| Fig. 12 Images of fluorescent ink-written paper: (a) naked eye view and (b) under UV light (365 nm). | ||
5 Conclusion
Here, we reported the synthesis of highly fluorescent nitrogen functionalized CNDs using Indigofera tinctoria leaf extract as a novel carbon source and aq. ammonia as a nitrogen source by a cost-effective, uncomplicated, and eco-friendly single-step hydrothermal process. The obtained NFCNDs exhibits good water solubility, greater QY, and strong fluorescence. The optical properties were studied by UV-visible and fluorescence spectrometry. The size of the synthesized NFCNDs was 4 nm in diameter, and a spherical morphology was found from the HR-TEM studies. The XRD results revealed that the amorphous character of the NFCNDs as well as the FT-IR and XPS studies evidently confirmed the functionalization of nitrogen on the CNDs surface. From the environmental point of view, the study describes the catalytic efficiency of NFCNDs explored for the reduction of methylene blue and methyl orange dyes by using NaBH4. Complete reduction was attained within 10.5 min for MB and 12 min for MO using the NFCNDs green catalyst. Moreover, the NFCNDs were utilized as a biocompatible fluorescent ink and also emitted cyan color under UV light. Overall, the study enlightened the uses of a novel green catalyst for environmental remediation and also identified a promising probe for anti-counterfeiting applications.Data availability
All data generated or analyzed during this study are included in this published article.Author contributions
Jothi Vinoth Kumar: conceptualization, methodology, writing – original draft. Ganesan Kavitha: data curation, formal analysis. Rajaram Arulmozhi: visualization. Velusamy Arul: data curation. Natarajan Abirami: supervision, investigation.Conflicts of interest
Authors declared that there are no conflicts of interest.Acknowledgements
The authors wish to acknowledge DST-FIST (fund for improvement of S&T) for the financial assistance at the Department of Chemistry, SRM IST (grant no SR/FST/CST-266/2015(c)).References
- X. Xu, R. Ray, Y. Gu, H. J. Ploehn, L. Gearheart, K. Raker and W. A. Scrivens, J. Am. Chem. Soc., 2004, 126, 12736–12737 CrossRef CAS PubMed.
- J. G. Duque, C. E. Hamilton, G. Gupta, S. A. Crooker, J. J. Crochet, A. Mohite, H. Htoon, K. A. D. Obrey, A. M. Dattelbaum and S. K. Doorn, ACS Nano, 2011, 5, 6686–6694 CrossRef CAS PubMed.
- J. Qian, D. Wang, F.-H. Cai, W. Xi, L. Peng, Z.-F. Zhu, H. He, M.-L. Hu and S. He, Angew. Chem., 2012, 124, 10722–10727 CrossRef.
- J. Jeong, J. Jung, M. Choi, J. W. Kim, S. J. Chung, S. Lim, H. Lee and B. H. Chung, Adv. Mater., 2012, 24, 1999–2003 CrossRef CAS PubMed.
- S. N. Baker and G. A. Baker, Angew. Chem., Int. Ed., 2010, 49, 6726–6744 CrossRef CAS PubMed.
- D. K. Ji, G. Reina, S. Guo, M. Eredia, P. Samorì, C. Ménard-Moyon and A. Bianco, Nanoscale Horiz., 2020, 5, 1240–1249 RSC.
- S. Anbu, A. Vandarkuzhali, S. Natarajan, S. Jeyabalan, G. Sivaraman, S. Singaravadivel, S. Muthusubramanian and B. Viswanathan, ACS Omega, 2018, 3, 12584–12592 CrossRef PubMed.
- P. Devi, P. Rajput, A. Thakur, K. H. Kim and P. Kumar, TrAC, Trends Anal. Chem., 2019, 114, 171–195 CrossRef CAS.
- V. Arul, P. Chandrasekaran, G. Sivaraman and M. G. Sethuraman, Diamond Relat. Mater., 2021, 116, 108437 CrossRef CAS.
- A. Abbasi Kajani, A. K. Bordbar, M. A. Mehrgardi, S. H. Zarkesh-Esfahani, H. Motaghi, M. Kardi, A. R. Khosropour, J. Ozdemir, M. Benamara and M. H. Beyzavi, ACS Appl. Bio Mater., 2018, 1, 1458–1467 CrossRef CAS.
- R. Wang, K. Q. Lu, Z. R. Tang and Y. J. Xu, J. Mater. Chem. A, 2017, 5, 3717–3734 RSC.
- S. A. A. Vandarkuzhali, V. Jeyalakshmi, G. Sivaraman, S. Singaravadivel, K. R. Krishnamurthy and B. Viswanathan, Sens. Actuators, B, 2017, 252, 894–900 CrossRef CAS.
- K. Radhakrishnan and P. Panneerselvam, RSC Adv., 2018, 8, 30455–30467 RSC.
- K. Dhandapani, K. Venugopal and J. V. Kumar, Int. J. Plast. Technol., 2019, 23, 56–66 CrossRef CAS.
- K. Radhakrishnan, P. Panneerselvam and M. Marieeswaran, Anal. Methods, 2019, 11, 490–506 RSC.
- W. Schilling, Y. Zhang, P. K. Sahoo, S. K. Sarkar, S. Gandhi, H. W. Roesky and S. Das, Green Chem., 2021, 23, 379–387 RSC.
- W. Lu, X. Qin, S. Liu, G. Chang, Y. Zhang, Y. Luo, A. M. Asiri, A. O. Al-Youbi and X. Sun, Anal. Chem., 2012, 84, 5351–5357 CrossRef CAS PubMed.
- P. G. Luo, S. Sahu, S. T. Yang, S. K. Sonkar, J. Wang, H. Wang, G. E. Lecroy, L. Cao and Y. P. Sun, J. Mater. Chem. B, 2013, 1, 2116–2127 RSC.
- G. Hong, S. Diao, A. L. Antaris and H. Dai, Chem. Rev., 2015, 115, 10816–10906 CrossRef CAS PubMed.
- Y. Guo, L. Zhang, S. Zhang, Y. Yang, X. Chen and M. Zhang, Biosens. Bioelectron., 2015, 63, 61–71 CrossRef CAS PubMed.
- X. Li, M. Rui, J. Song, Z. Shen and H. Zeng, Adv. Funct. Mater., 2015, 25, 4929–4947 CrossRef CAS.
- H. Li, X. He, Z. Kang, H. Huang, Y. Liu, J. Liu, S. Lian, C. H. A. Tsang, X. Yang and S. Lee, Angew. Chem., 2010, 122, 4532–4536 CrossRef.
- D. Sun, R. Ban, P.-H. Zhang, G.-H. Wu, J.-R. Zhang and J.-J. Zhu, Carbon, 2013, 64, 424–434 CrossRef CAS.
- L. Zhang and Z. Xia, J. Phys. Chem. C, 2011, 115, 11170–11176 CrossRef CAS.
- J. Vinoth Kumar, G. Kavitha, R. Arulmozhi, V. Arul, S. Singaravadivel and N. Abirami, J. Fluoresc., 2021, 31, 915–932 CrossRef CAS PubMed.
- Z. Yang, M. Xu, Y. Liu, F. He, F. Gao, Y. Su, H. Wei and Y. Zhang, Nanoscale, 2014, 6, 1890–1895 RSC.
- A. B. Bourlinos, G. Trivizas, M. A. Karakassides, M. Baikousi, A. Kouloumpis, D. Gournis, A. Bakandritsos, K. Hola, O. Kozak, R. Zboril, I. Papagiannouli, P. Aloukos and S. Couris, Carbon, 2015, 83, 173–179 CrossRef CAS.
- S. Miao, K. Liang, J. Zhu, B. Yang, D. Zhao and B. Kong, Nano Today, 2020, 33, 100879 CrossRef CAS.
- Y. Xu, M. Wu, X. Z. Feng, X. B. Yin, X. W. He and Y. K. Zhang, Chem.–Eur. J., 2013, 19, 6282–6288 CrossRef CAS PubMed.
- D. N. Mishra, K. S. Gomare and S. V. Sheelwant, International Journal of Ayurvedic Medicine, 2020, 11, 289–299 CrossRef.
- E. Gerometta, I. Grondin, J. Smadja, M. Frederich and A. Gauvin-Bialecki, J. Ethnopharmacol., 2020, 253, 112608 CrossRef CAS PubMed.
- G. Asuntha, Y. Prasannaraju and K. V. S. R. G. Prasad, Trop. J. Pharm. Res., 2010, 9, 149–156 Search PubMed.
- P. A. Carneiro, G. A. Umbuzeiro, D. P. Oliveira and M. V. B. Zanoni, J. Hazard. Mater., 2010, 174, 694–699 CrossRef CAS PubMed.
- X. Li, Q. Mei, L. Chen, H. Zhang, B. Dong, X. Dai, C. He and J. Zhou, Water Res., 2019, 157, 228–237 CrossRef CAS PubMed.
- N. Hao, Y. Nie, Z. Xu, C. Jin, T. J. Fyda and J. X. J. Zhang, J. Colloid Interface Sci., 2020, 559, 254–262 CrossRef CAS PubMed.
- M. L. Baynosa, A. H. Mady, V. Q. Nguyen, D. R. Kumar, M. S. Sayed, D. Tuma and J. J. Shim, J. Colloid Interface Sci., 2020, 561, 459–469 CrossRef CAS PubMed.
- N. Gowriboy, R. Kalaivizhi and S. Sivasankari, Polym. Sci., Ser. B, 2021, 63, 1–10 Search PubMed.
- P. Niu, Asian J. Chem., 2013, 25, 1103–1106 CrossRef CAS.
- J. Andres, R. D. Hersch, J. E. Moser and A. S. Chauvin, Adv. Funct. Mater., 2014, 24, 5029–5036 CrossRef CAS.
- V. Arul and M. G. Sethuraman, Opt. Mater., 2018, 78, 181–190 CrossRef CAS.
- B. De and N. Karak, RSC Adv., 2013, 3, 8286–8290 RSC.
- D. R. da Silva Souza, L. D. Caminhas, J. P. de Mesquita and F. V. Pereira, Mater. Chem. Phys., 2018, 203, 148–155 CrossRef CAS.
- T. N. J. I. Edison, R. Atchudan, J. J. Shim, S. Kalimuthu, B. C. Ahn and Y. R. Lee, J. Photochem. Photobiol., B, 2016, 158, 235–242 CrossRef CAS PubMed.
- R. Atchudan, T. N. J. I. Edison, S. Perumal, R. Vinodh and Y. R. Lee, J. Mol. Liq., 2019, 296, 111817 CrossRef CAS.
- Z. Wang, H. Zeng and L. Sun, J. Mater. Chem. C, 2015, 3, 1157–1165 RSC.
- J. Hou, G. Dong, Z. Tian, J. Lu, Q. Wang, S. Ai and M. Wang, Food Chem., 2016, 202, 81–87 CrossRef CAS PubMed.
- S. J. Jang, Y. C. Kang and K. C. Roh, J. Ind. Eng. Chem., 2020, 82, 383–389 CrossRef CAS.
- H. Cheng, Y. Bian, F. Wang, X. Jiang, R. Ji, C. Gu, X. Yang and Y. Song, Bioresour. Technol., 2019, 284, 1–8 CrossRef CAS PubMed.
- R. Atchudan, T. N. J. I. Edison and Y. R. Lee, J. Colloid Interface Sci., 2016, 482, 8–18 CrossRef CAS PubMed.
- B. B. Campos, R. Contreras-Cáceres, T. J. Bandosz, J. Jiménez-Jiménez, E. Rodríguez-Castellón, J. C. G. Esteves da Silva and M. Algarra, Carbon, 2016, 106, 171–178 CrossRef CAS.
- N. Wang, Y. Wang, T. Guo, T. Yang, M. Chen and J. Wang, Biosens. Bioelectron., 2016, 85, 68–75 CrossRef CAS PubMed.
- R. Atchudan, T. N. J. I. Edison, D. Chakradhar, S. Perumal, J. J. Shim and Y. R. Lee, Sens. Actuators, B, 2017, 246, 497–509 CrossRef CAS.
- R. Atchudan, S. Perumal, D. Karthikeyan, A. Pandurangan and Y. R. Lee, Microporous Mesoporous Mater., 2015, 215, 123–132 CrossRef CAS.
- D. Wang, Z. Wang, Q. Zhan, Y. Pu, J.-X. Wang, N. R. Foster and L. Dai, Engineering, 2017, 3, 402–408 CrossRef.
- T. N. J. I. Edison, R. Atchudan, M. G. Sethuraman, J.-J. Shim and Y. R. Lee, J. Photochem. Photobiol., B, 2016, 161, 154–161 CrossRef CAS PubMed.
- V. Arul, P. Chandrasekaran and M. G. Sethuraman, Chem. Phys. Lett., 2020, 754, 137646 CrossRef CAS.
- Y. Han, H. Huang, H. Zhang, Y. Liu, X. Han, R. Liu, H. Li and Z. Kang, ACS Catal., 2014, 4, 781–787 CrossRef CAS.
- K. Naseem, Z. H. Farooqi, R. Begum and A. Irfan, J. Cleaner Prod., 2018, 187, 296–307 CrossRef CAS.
Footnote |
| † Electronic supplementary information (ESI) available. See DOI: 10.1039/d1ra04351j |
| This journal is © The Royal Society of Chemistry 2021 |

