 Open Access Article
Characterization of pruned tea branch biochar and the mechanisms underlying its adsorption for cadmium in aqueous solution†
Chuan Hana,
Miaofei Wanga,
Yanfang Ren*ab,
Liming Zhanga,
Yu Jia,
Wenjia Zhua,
Yaping Songa and
Junyu He *ab
*ab
aSchool of Environmental and Safety Engineering, Changzhou University, Changzhou, 213164, PR China. E-mail: junyuhe0303@126.com; yanfangren@126.com; Fax: +86 519 86330086; Tel: +86 519 86330086
bJiangsu Petrochemical Safety and Environmental Engineering Research Center, Changzhou, 213164, PR China
First published on 6th August 2021
Abstract
In the present study, discarded pruned tea branch was used to prepare a new biochar, and the physicochemical properties and adsorption characteristics were investigated by characterization and batch experiments. With increasing pyrolysis temperature from 400 to 800 °C, the yield, specific surface area, and acidic functional groups had significant differences. The optimum adsorption conditions were determined as pH = 6 and dosage of 2 g L−1. The pseudo-second-order kinetic and Langmuir isothermal model could fit well to the adsorption data, which showed that the adsorption process was dominated by monolayer chemical adsorption. The highest adsorption property (74.04 mg g−1) was obtained by the pyrolysis of tea branch biochar (TBB) at 700 °C owing to the adsorption mechanisms, including surface complexation, precipitation, metal ion exchange, and Cd2+–π interaction. After five cycles of desorption, biochar still showed superior adsorption (80%). Hence, the TBB acted as a regenerable adsorbent for treating Cd2+-containing wastewater.
1. Introduction
Heavy metal pollution has always been the main driving factor of aquatic environmental pollution.1 Cadmium (Cd) is one of the heavy metals commonly used in industries, such as metallurgy, electroplating, electronics, and especially battery.2 A large amount of effluent containing Cd2+ is discharged into streams, lakes, and other water bodies with the rapid development of industrialization, which may result in serious pollution to water systems without proper treatment.3 Due to its high fluidity, durability, and high toxicity, it easily builds up in the aquatic environment and eventually enters the human body through the food chain, which seriously endangers human health.4 Consequently, it is significant to remove Cd2+ effectively and easily from wastewater to ensure water quality and human health, before discharge to the water environment.Currently, various remediation techniques for removing Cd2+ from wastewater have been reported, including electrochemical, chemical precipitation, membrane separation, ion exchange, etc.4 Nevertheless, the current techniques are limited by complex technical processes, high operating costs, high energy consumption, or are unsuitable for the treatment of low concentration heavy metal wastewater.5 Compared to the above methods, adsorption has the advantages of being economical, high efficiency, ease of operation, no secondary pollution, and low sensitivity to toxic substances and is regarded as a promising and environmentally friendly wastewater treatment method.6 It is urgent to find highly efficient and low-cost adsorbents in large-scale implementation of Cd2+ removal processes. As an environmental functional adsorbent, biochar has been considered for its environmental friendliness recently.
Biochar is a carbon-rich and stable byproduct of biomass pyrolysis under anoxic conditions. It can be made from various raw materials, including livestock waste, sludge, forestry and agricultural waste, and other organic materials.4,7,8 Biochar has excellent physicochemical properties, including large specific surface area, unique pore structure, abundant surface functional groups, and high surface negative charge and charge density.9 These remarkable characteristics make it play a vital role as an efficient and cheap adsorbent in the treatment of heavy metal pollution in water. Several studies have explored the removal of Cd2+ by biochar in aqueous solutions.10–12 Furthermore, to increase the biochar adsorption capacity for heavy metals, modification with chemical reagents, such as acid, bases, and KMnO4, has been widely used to prepare activated carbon. The ability of activated carbon as an adsorbent is caused by the increased surface area, changed porous structure, and improved surface functional groups and their amount on the carbon surface.13–15
Cd2+ sorption by biochar is a complex process as heavy metals are removed via different mechanisms.16 Jia and Thomas found that the adsorption of Cd2+ by biochar involves cation exchange.17 Teng et al. found surface complexation and coprecipitation were the primary contributors to the Cd2+ sorption process for pinecone biochar.18 Ion exchange and precipitation were found as the dominant Cd2+ adsorption mechanisms on rice-husk biochar.19 Wang et al. found that coordination of Cd2+ with π-electrons contributed to Cd2+ adsorption aqueous solutions.20
China is the largest tea-producing country in the world. There are over 3.06 × 10⁶ hm2 of tea plantations in China. Tea pruning is a key technology to cultivate tree crowns, renew and rejuvenate tree vigor. About 1 million tons of pruned tea branches (TB) are produced annually. Currently, most of the TB waste is burned or discarded, which not only pollutes the environment but also wastes a large amount of potential biomass resources. Therefore, the conversion of discarded biomass into high-value biological products is a subject worthy of study. However, there is no research on the production of biochar from TB and its application in the removal of Cd2+ from wastewater. Using TB waste to prepare biochar to adsorb Cd2+ in an aqueous solution can not only reduce the economic and environmental burden but also can be used for pollution remediation and effective utilization of agricultural waste.
The objective of the present study was to explore (1) the physicochemical properties of biochar prepared from TB at diverse pyrolysis temperatures, (2) the adsorption characteristics of Cd2+ on TBB at diverse pyrolysis temperatures, and (3) the adsorption mechanisms of Cd2+ on TBB. The results indicated that the biochar prepared from TB could be used as an adsorbent to replace the current adsorption materials.
2. Materials and methods
2.1 Feedstocks
Pruned tea branches were collected from the Longchi Mountain tea plantation in Yixing, Jiangsu Province, China. The TB was washed with deionized water, dried at 85 °C in the oven until a constant weight was obtained, and then crushed by a pulverizer and sieved through a 20 mesh sieve. The powder was packed in sealed bags and stored in a desiccator at room temperature for further experiments.2.2 Preparation of the biochar
30 g of TB powder was pyrolyzed in a tubular furnace (OTF-1200X, Kejing, China) with a gas flow rate of 60 mL min−1 in N2 atmosphere. The sample was heated to the carbonization temperature at the rate of 10 °C min−1 and pyrolyzed at 400 °C, 500 °C, 600 °C, 700 °C, and 800 °C. After the carbonization for 2 h, it was cooled to room temperature, treated with 1 M HCl to remove ash, washed to neutral with deionized water, filtered, and dried at 85 °C to constant weight. Subsequently, the TBB was ground and sieved through a 100 mesh sieve and kept in reserve in a sealed bag for characterization and batch experiments. Based on the heated temperatures, the biochar samples were designated as TBB400, TBB500, TBB600, TBB700, and TBB800.2.3 Characterization of the biochar
TBB ash contents were determined by muffle furnace heating at 800 °C for 4 h. The mineral elemental compositions of TBB were measured by ICP-OES (Vista-AX, VARIAN, USA). The pH value of 1![[thin space (1/6-em)]](https://www.rsc.org/images/entities/char_2009.gif) :
:![[thin space (1/6-em)]](https://www.rsc.org/images/entities/char_2009.gif) 20 (w/v) suspension was determined using a pH meter (FE28, Mettler-Toledo, Switzerland). Elements C, H, N, and O in TBB were measured using the elemental analyzer (CE-400, EAI, USA). The thermal stability of TB and TBB were tested using thermal gravimetric analysis (TGA8000, PerkinElmer, USA) under an N2 atmosphere, and the temperature range was 30–950 °C at the rate of 10 °C min−1. The hemicellulose, cellulose, lignin, and extractive contents in TBB were estimated according to Lee et al.21 The structure, surface morphology, and elemental mapping of TBB were captured by a scanning electron microscope (FE-SEM, EVO MA 25, Karl Zeiss, Germany). The specific surface area and pore structure of TBB were determined using a specific surface area pore analyzer (ASAP2020, micrometrics, USA) and Brunauer–Emmett–Teller (BET) method using the Rouquerol criterion.22 Fourier Transform Infrared (FTIR-6300, JASCO, Japan) and X-ray photoelectron spectroscopy (XPS, Kratos, Shimadzu, Japan) were used to determine the types and contents of functional groups. X-ray diffraction (XRD, QC3, Jordan Valley, Israel) was used to analyze the crystalline structure of biochar. The Cd2+ content was determined using flame Atomic Absorption Spectrophotometer (AAS, aa-300, PerkinElmer Ltd, USA).
20 (w/v) suspension was determined using a pH meter (FE28, Mettler-Toledo, Switzerland). Elements C, H, N, and O in TBB were measured using the elemental analyzer (CE-400, EAI, USA). The thermal stability of TB and TBB were tested using thermal gravimetric analysis (TGA8000, PerkinElmer, USA) under an N2 atmosphere, and the temperature range was 30–950 °C at the rate of 10 °C min−1. The hemicellulose, cellulose, lignin, and extractive contents in TBB were estimated according to Lee et al.21 The structure, surface morphology, and elemental mapping of TBB were captured by a scanning electron microscope (FE-SEM, EVO MA 25, Karl Zeiss, Germany). The specific surface area and pore structure of TBB were determined using a specific surface area pore analyzer (ASAP2020, micrometrics, USA) and Brunauer–Emmett–Teller (BET) method using the Rouquerol criterion.22 Fourier Transform Infrared (FTIR-6300, JASCO, Japan) and X-ray photoelectron spectroscopy (XPS, Kratos, Shimadzu, Japan) were used to determine the types and contents of functional groups. X-ray diffraction (XRD, QC3, Jordan Valley, Israel) was used to analyze the crystalline structure of biochar. The Cd2+ content was determined using flame Atomic Absorption Spectrophotometer (AAS, aa-300, PerkinElmer Ltd, USA).
2.4 Cd2+ sorption by biochar
Cadmium chloride (CdCl2·2.5H2O) was dissolved in 0.01 M Ca(NO3)2 solution as background electrolyte to prepare 1000 mg L−1 Cd2+ stock solution, which was diluted to the desired concentration. The pH of the initial solution of Cd2+ was adjusted with 0.1 M hydrochloric acid or sodium hydroxide solution. Batch experiments were carried out by adding 0.05 g TBB to 25 mL solutions containing initial Cd2+ concentration (100 mg L−1, pH 6) at constant temperature (25 ± 0.5 °C) and shaking at 200 rpm for 24 h unless specified otherwise. All the experiments were conducted in triplicate.![[thin space (1/6-em)]](https://www.rsc.org/images/entities/char_2009.gif) 000 rpm for 10 min, and the supernatant was filtered through a 0.45 μm filter membrane. The concentration of Cd2+ in the filtrate was determined by AAS.
000 rpm for 10 min, and the supernatant was filtered through a 0.45 μm filter membrane. The concentration of Cd2+ in the filtrate was determined by AAS.![[thin space (1/6-em)]](https://www.rsc.org/images/entities/char_2009.gif) :
:![[thin space (1/6-em)]](https://www.rsc.org/images/entities/char_2009.gif) 500) were mixed and vibrated at a constant temperature. Samples were taken out at 5 min, 10 min, 0.25 h, 0.5 h, 1 h, 2 h, 4 h, 8 h, 12 h, and 24 h. The adsorption isotherms of Cd2+ on TBB were explored by adding the sample to different concentrations of Cd2+ solution (10–300 mg L−1). The Cd2+ concentration in the filtrate was filtered and determined by the above method.
500) were mixed and vibrated at a constant temperature. Samples were taken out at 5 min, 10 min, 0.25 h, 0.5 h, 1 h, 2 h, 4 h, 8 h, 12 h, and 24 h. The adsorption isotherms of Cd2+ on TBB were explored by adding the sample to different concentrations of Cd2+ solution (10–300 mg L−1). The Cd2+ concentration in the filtrate was filtered and determined by the above method.Adsorption of Cd2+ onto TBB was evaluated by adsorption kinetic models (pseudo-first order,23 pseudo-second order, and Elovich models) and isotherm models (Langmuir, Freundlich, and Temkin models) (additional information available in ESI†).
2.5 Reusability potential of biochar
The reusability potential of biochar was determined by desorption experiments. 0.05 g Cd2+ saturated TBB700 was mixed with 25 mL 0.01, 0.1, and 1 M HCl, HNO3, and H2SO4, respectively, and shaken continuously for 24 h at 25 ± 0.5 °C and 200 rpm. The desorption efficiency of Cd2+ was tested to determine the optimal desorption conditions. The TBB700 desorbed under the optimal desorption condition in the previous step was washed and dried again for the adsorption test. The continuous desorption–adsorption cycle was repeated five times to test the reusability of TBB.3. Results and discussion
3.1 Biochar yield
As the temperature increased, the yield decreased from 41.75% to 27.13% (Table 1), which coincided with previous findings that increasing the pyrolysis temperature accelerated the formation of syn-gas and bio-fuels and reduced biochar yield.24 The yield of biochar is an important factor to evaluate its application as an adsorbent. Compared with cork-based biochar (28.37–24.26% yield from 450 °C to 750 °C) and pristine banana pseudostem biochar (30.8% yield at 400 °C, 25.1% at 600 °C), TBB had a higher yield at the identical pyrolysis temperature.8,25| Biochar | TBB400 | TBB500 | TBB600 | TBB700 | TBB800 |
|---|---|---|---|---|---|
| Yield (%) | 41.75 ± 0.59 | 35.27 ± 0.86 | 32.63 ± 0.41 | 31.89 ± 0.72 | 27.13 ± 0.51 |
| Ash (%) | 9.28 ± 0.22 | 9.87 ± 0.13 | 10.63 ± 0.09 | 10.97 ± 0.24 | 11.59 ± 0.17 |
| pH | 8.45 ± 0.01 | 8.63 ± 0.01 | 8.72 ± 0.02 | 8.87 ± 0.01 | 9.81 ± 0.01 |
| C (%) | 61.11 | 67.09 | 70.45 | 73.08 | 79.66 |
| H (%) | 4.55 | 4.18 | 3.63 | 2.30 | 1.61 |
| N (%) | 1.85 | 1.52 | 1.36 | 1.00 | 0.71 |
| O (%) | 23.21 | 17.33 | 13.93 | 12.65 | 6.43 |
| H/C | 0.07 | 0.06 | 0.05 | 0.03 | 0.02 |
| O/C | 0.38 | 0.26 | 0.20 | 0.17 | 0.08 |
| (N + O)/C | 0.41 | 0.28 | 0.22 | 0.19 | 0.09 |
| BET surface area (m2 g−1) | 5 | 8 | 180 | 277 | 208 |
| Pore volume (cm3 g−1) | 0.05 | 0.07 | 0.09 | 0.12 | 0.11 |
| Average pore diameter (nm) | 5.43 | 4.84 | 4.43 | 2.36 | 2.18 |
3.2 Biochar characterization
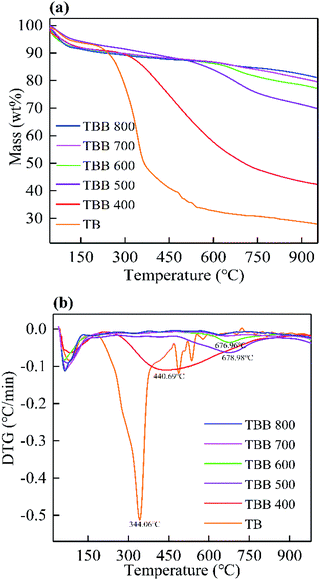
Compared with TB, the DTG curves of TBB clearly showed that the peak value observed at 344.06 °C disappeared (Fig. 1b), indicating that hemicellulose and cellulose decomposed at about 344 °C. However, lignin may still exist without degradation. The peak values of TBB400, TBB500, and TBB600 at 440.69, 678.98, and 676.96 °C were related to lignin, which would decompose between 400 and 750 °C. The curves of TBB700 and TBB800 were relatively stable. Most hemicellulose, cellulose, and lignin were decomposed in the pyrolysis process, indicating that TBB became more stable at higher temperature. These were consistent with the previous report.32
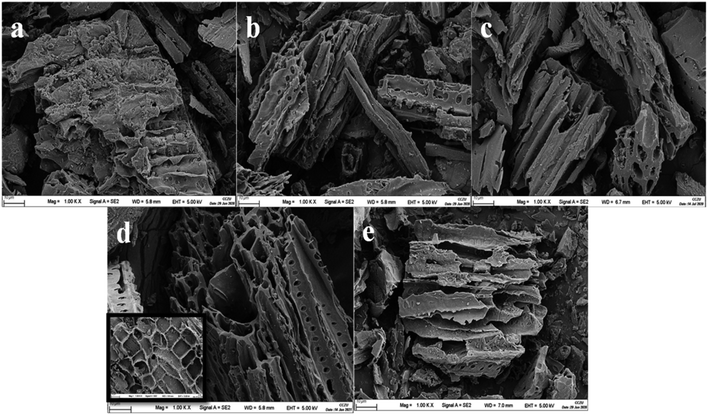
The SEM images showed the surface of TBB400 was rough, and the pore structure was not obvious (Fig. 2), which indicated that the TB was not completely cracked and only partially carbonized. As the pyrolysis temperature increased, a deep pore structure with clear pores was found due to the gradual volatilization of organic matter and gas. These results indicated that the porous structure could be better developed at higher pyrolysis temperatures. The surface of TBB700 was tortoise shell-like, which provided more adsorption sites and favored the adsorption. The structural deformation and pore-clogging of TBB800 were due to the softening, melting, and fusion of limestone.34 The porous structure was consistent with the above BET results.
![[double bond, length as m-dash]](https://www.rsc.org/images/entities/char_e001.gif) C lignin absorption ring, and the carboxyl group decreased with dehydration and decarboxylation.35 The absorption peak at 1411 cm−1 connected with the C
C lignin absorption ring, and the carboxyl group decreased with dehydration and decarboxylation.35 The absorption peak at 1411 cm−1 connected with the C![[double bond, length as m-dash]](https://www.rsc.org/images/entities/char_e001.gif) O structure gradually weakened, indicating that the non-conjugate C
O structure gradually weakened, indicating that the non-conjugate C![[double bond, length as m-dash]](https://www.rsc.org/images/entities/char_e001.gif) O structure in lignin has been decomposed.36 Furthermore, new peaks appeared and strengthened at 1064 cm−1 of TBB700 and TBB800, corresponding to the C–O stretching vibration of aromatic compounds.37 These results clearly stated that the aromaticity of biochar was enhanced, and the carbon structure was more stable with the temperature increased, consistent with changes in element analysis and thermogravimetric analysis (Table 1 and Fig. 1).
O structure in lignin has been decomposed.36 Furthermore, new peaks appeared and strengthened at 1064 cm−1 of TBB700 and TBB800, corresponding to the C–O stretching vibration of aromatic compounds.37 These results clearly stated that the aromaticity of biochar was enhanced, and the carbon structure was more stable with the temperature increased, consistent with changes in element analysis and thermogravimetric analysis (Table 1 and Fig. 1).
3.3 Effect of dosage and initial pH on Cd2+ removal
The adsorption capacity per unit mass of TBB gradually decreased from 71.48–62.85 to 3.97–3.43 mg g−1, with the dosage ranging from 1 to 20 g L−1 (Fig. 5a). With increased dosage, all the active sites cannot be completely occupied, which led to a transition of the surface from saturated to unsaturated and high adsorption capacity to low adsorption capacity.40 There was no prominent change in the adsorption efficiency of TBB when the dosage of biochar exceeds 2 g L−1, indicating that the adsorption sites of TBB and Cd2+ reached a balance (Fig. 5b). Considering the adsorption capacity and adsorption efficiency of TBB, 2 g L−1 was selected as the optimal dosage for the next experiment in this work. | ||
| Fig. 5 Effect of biochar dosage on adsorption capacity (a) and adsorption efficiency (b) of Cd2+ for TBB. | ||
The adsorption capacities of Cd2+ on TBB were examined from pH 2 to 8, and it was observed that Cd2+ could rapidly adsorb at pH 2–4. However, there was no significant effect at pH 5–8 (Fig. 6). According to the above FTIR analysis (Fig. 3), the TBB surface contains many hydroxyl (–OH) and carboxyl (–COOH) functional groups. At pH 2–4, a large number of hydrogen ions existed in the reaction system, which protonated the functional groups on the surface of TBB and repelled positively charged Cd2+.41 Moreover, a high concentration of H+ occupied the adsorption sites of Cd2+ on the surface of TBB, resulting in low adsorption capacity.42 When pH 5–8, the competitive adsorption capacity of TBB became weak due to the decrease in H+, and TBB can produce negatively charged functional groups, which generated high affinity for Cd2+ to provoke Cd2+ to dislodge from aqueous solution. At pH > 8, –OH and Cd2+ formed the hydroxyl complex Cd(OH)2. When the initial solution pH was 6, the adsorption capacity of TBB was the highest. Hence the optimum pH was 6 in this experiment.
3.4 Analysis of adsorption kinetics
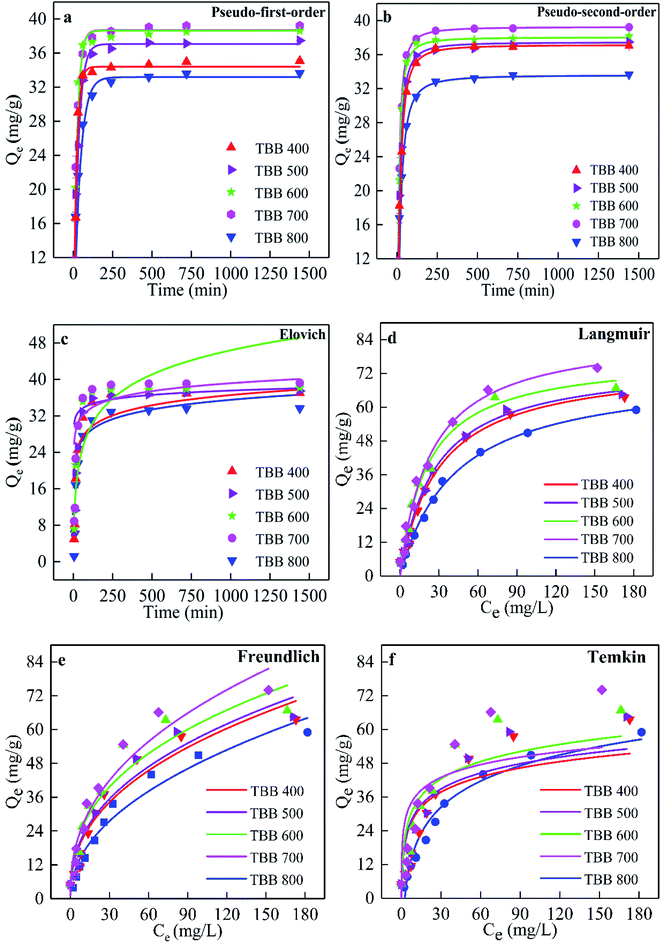
From Fig. 7a–c, the kinetic trend was composed of three stages: fast adsorption, slow adsorption, and equilibrium. The adsorption of Cd2+ on TBB increased rapidly in the first 0.5 h, then tended to slow down, and gradually reached equilibrium after 4 h. TBB700 reached equilibrium faster and showed greater adsorption capacity than other TBB. Pseudo-second-order R2 (R2 > 0.99) was greater than the pseudo-first-order and Elovich R2 (Table 2), which revealed that the pseudo-second-order model was more suitable for describing adsorption kinetics. This model can also be used to describe the adsorption kinetics of heavy metals on sewage sludge and barley straw biochar.7,15 Furthermore, the adsorption value calculated by the pseudo-second-order approached the experimental value. These results further confirmed that the pseudo-second-order model was more suitable for describing adsorption kinetics, which meant that chemical adsorption was involved in the adsorption process.8,18 Therefore, the adsorption mechanism of Cd2+ on TBB could be explained by two adsorption processes: physical adsorption and chemical adsorption, in which chemical adsorption dominated the reaction process.43| Biochar | Qea | Pseudo-first-order | Pseudo-second-order | Elovich | ||||||
|---|---|---|---|---|---|---|---|---|---|---|
| Qe | k1 | R2 | Qe | k2 | R2 | α | β | R2 | ||
| a Actual adsorption capacity of TBB. | ||||||||||
| TBB400 | 37.043 | 34.400 | 0.053 | 0.9302 | 37.127 | 0.010 | 0.9995 | 268.470 | 0.309 | 0.9025 |
| TBB500 | 37.480 | 37.067 | 0.035 | 0.9667 | 37.442 | 0.015 | 0.9909 | 1.041 | 0.729 | 0.4483 |
| TBB600 | 38.184 | 38.639 | 0.045 | 0.9767 | 38.024 | 0.020 | 0.9999 | 3.228 | 0.130 | 0.9058 |
| TBB700 | 39.218 | 38.686 | 0.046 | 0.9757 | 39.251 | 0.027 | 0.9977 | 15![[thin space (1/6-em)]](https://www.rsc.org/images/entities/char_2009.gif) 110.577 110.577 |
0.399 | 0.4936 |
| TBB800 | 33.657 | 33.178 | 0.026 | 0.9592 | 33.578 | 0.009 | 0.9942 | 340.040 | 0.327 | 0.6382 |
3.5 Adsorption isotherm analysis
The adsorption isotherm curves were shown in Fig. 7d–f. It was found that the adsorption capacity of TBB increased with the increased Cd2+ initial concentration and tended to be stable when the Cd2+ initial concentration reached 100 mg L−1. In the whole process, the adsorption capacity of TBB700 was the highest, for which the maximum adsorption capacity fitted by the Langmuir isotherm model was 86.55 mg g−1.Langmuir, Freundlich, and Temkin isotherm models were adopted to interpret the adsorption equilibrium. The R2 of the Langmuir isotherm model was higher than that of others from Table 3, indicating that the adsorption of Cd2+ on the TBB surface was a homogeneous monolayer.44 This result was in accordance with previous studies in KOH-modified rice straw and Enteromorpha prolifera biochar.14,45 In this experiment, RL was between 0.065 and 0.123, which further indicated that TBB has a great affinity for Cd2+, and the adsorption process was favorable.46 Meanwhile, when the Freundlich 1/n parameter was between 0–1, the interactions between biochar and heavy metal ions were stronger. The 1/n value of TBB was between 0.37–0.47 in the present study, which further confirmed that the adsorption was favorable. The Temkin equation also fitted the adsorption data, indicating that the adsorption process of Cd2+ may be partly affected by the interaction between the adsorbent and adsorbate.
| Biochar | T (°C) | Langmuir model | Freundlich model | Temkin | ||||||
|---|---|---|---|---|---|---|---|---|---|---|
| Qm | KL | R2 | KF | 1/n | R2 | KT | B | R2 | ||
| TBB400 | 25 | 75.890 | 0.034 | 0.989 | 8.501 | 0.410 | 0.939 | 4.128 | 7.824 | 0.706 |
| TBB500 | 76.189 | 0.037 | 0.986 | 8.967 | 0.404 | 0.939 | 3.827 | 8.181 | 0.722 | |
| TBB600 | 78.145 | 0.048 | 0.985 | 10.99 | 0.377 | 0.914 | 4.068 | 8.831 | 0.736 | |
| TBB700 | 86.548 | 0.043 | 0.986 | 10.41 | 0.410 | 0.937 | 22.736 | 6.577 | 0.584 | |
| TBB800 | 72.958 | 0.024 | 0.997 | 5.572 | 0.470 | 0.958 | 0.370 | 13.420 | 0.962 | |
Many researchers have investigated the Cd2+ removal of biochar prepared from diverse raw materials. The superiority of TBB was assessed by comparing the Cd2+ adsorption capacity with other biochars reported in the literature. The results revealed that the maximum adsorption capacity of TBB700 used in this study was more efficient than most of the biochar and activated carbon reported in previous studies (Table 4). Consequently, the low cost, simplicity of production, and high adsorption capacity of TBB make it a promising alternative adsorbent for the treatment of Cd2+ contamination.
| Adsorbent | Qea (mg g−1) | Reference |
|---|---|---|
| a Maximum adsorption capacity of the adsorbent. | ||
| Peanut husk | 28.99 | 10 |
| Mango peel | 13.28 | 11 |
| Wheat straw | 69.8 | 12 |
| Corn stalk | 40 | 47 |
| Lotus seedpod-derived | 51.18 | 48 |
| Line tree residues | 85.8 | 49 |
| Pleurotus ostreatus | 71.49 | 50 |
| Shiitake substrate | 46.87 | |
| Buffalo weed | 11.6 | 51 |
| Rice straw | 35.92 | 52 |
| KOH-modified rice straw | 41.9 | 14 |
| KMnO4-modified vermicompost | 60.23 | 15 |
| Water hyacinth | 70.3 | 58 |
| TBB | 74.04 | This study |
3.6 Reusability and stability
An acidic solution is often used to desorb the adsorbent after heavy metal adsorption. The regeneration and reusability of TBB700 were investigated to evaluate the potential applicability. The desorption efficiency of 0.1 M acid solution was higher than that of 0.01 and 1 M, and HNO3 had high desorption efficiency compared with HCl and H2SO4 (Fig. 8a). So, 0.1 M HNO3 can be used as the best desorption agent. After five cycles of desorption–adsorption experiments, the adsorption capacity slightly decreased. However, the adsorption rate remained above 80% (Fig. 8b). The decreasing adsorption rate may be thanks to partial saturation of surface active sites or exhaustion of surface functional groups. Therefore, TBB showed good reproducibility, stability, and reusability for removing Cd2+ from wastewater.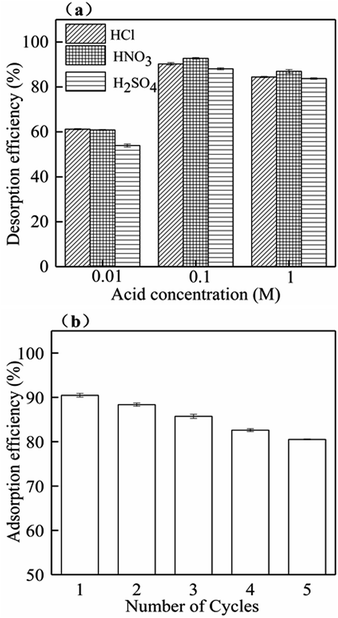 | ||
| Fig. 8 Effect of desorption agent concentration on Cd2+ desorption (a) and recycling adsorption efficiency of Cd2+ for TBB700 (b). | ||
3.7 Mechanism of Cd2+ adsorption
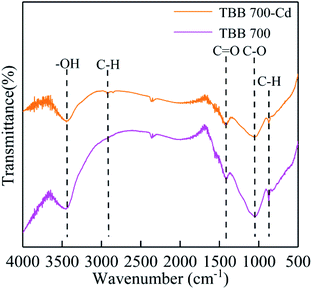
According to the adsorption kinetics and isotherm, it was shown that the adsorption of TBB was mainly monolayer chemical adsorption, and the TBB surface had a homogeneous structure. The adsorption mechanism of TBB700 before and after Cd2+ adsorption was further analyzed by FTIR, SEM elemental mapping, XRD, and XPS. The functional groups of TBB700 changed significantly before and after Cd2+ adsorption (Fig. 9). After adsorption, the –OH peak shifted from 3443 to 3448 cm−1 and the intensity decreased, which was mostly consumed in the adsorption process of Cd2+ to form Cd–O complexes or the deposits of Cd(OH)2 on the TBB surface. This result was consistent with the studies in pinecone and KMnO4-modified vermicompost biochar.15,18 However, it was different from the results observed by Li et al., who observed that the intensity of the peak increased after adsorption because of the dissociation of hydroxyl ions during anion exchange.53 The intensity of peaks at 1411 and 1064 cm−1 associated with CO32− and PO43−, respectively, weakened and disappeared after Cd2+ adsorption, directly confirming that surface CO32− and PO43− groups played an important role in the removal of Cd2+ by precipitation.14,54 Furthermore, compared with those before Cd2+ adsorption, the peaks in the bands of 3200–2800 and 801 cm−1 correlated to the C–H stretching increased and decreased, respectively. The changes in peak position and peak strength indicated that C–O, C![[double bond, length as m-dash]](https://www.rsc.org/images/entities/char_e001.gif) O, and C–H groups participated in the complexation reaction during Cd2+ adsorption, in which C–O and C
O, and C–H groups participated in the complexation reaction during Cd2+ adsorption, in which C–O and C![[double bond, length as m-dash]](https://www.rsc.org/images/entities/char_e001.gif) O were the main functional groups for Cd2+ removal on the surface of TBB.
O were the main functional groups for Cd2+ removal on the surface of TBB.
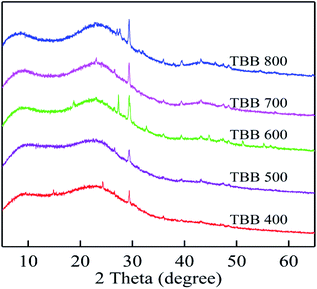
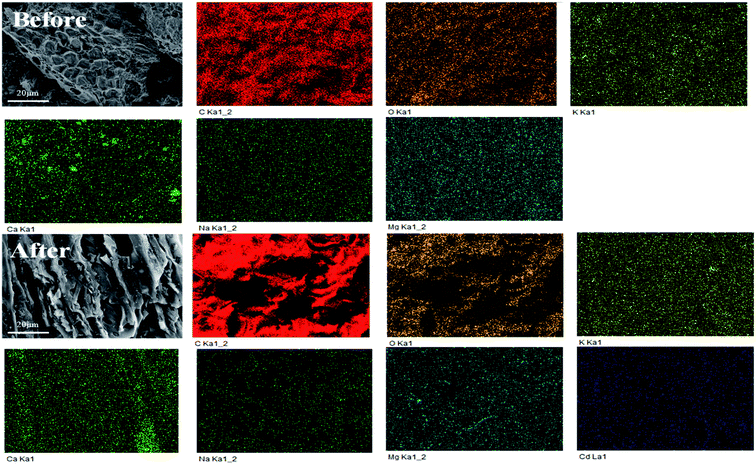
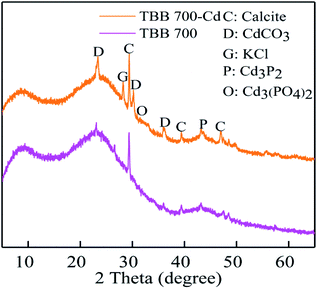
Metal ion exchange and surface precipitation play a significant role in heavy metal removal.17,55 The elements on the surface of TBB were mainly C, O, K, Ca, Na, Mg, and Cd, which confirmed the binding of Cd2+ to TBB (Fig. 10 and Table 5). The mass percentage of K, Ca, Na, and Mg decreased after adsorption, which meant that these cations were substituted by Cd2+ and released from the surface of TBB. According to the XRD analysis of TBB700 before and after Cd2+ adsorption (Fig. 11), it was observed that the peak of 23.36° became sharper, and new peaks appeared at 30.10° and 35.92° in TBB700-Cd, which indicated that CdCO3 was deposited on the surface of TBB700.14,56 At the same time, a small amount of Cd3P2 and Cd3(PO4)2 precipitates were also produced, which was consistent with FTIR analysis.57,58 The adsorption mechanism of Cd2+ by TBB700 was specific adsorption in the form of ion exchange and hydroxyl binding. Besides, K, Ca, Na, Mg, and P contents increased with the increase in pyrolysis temperature, which was conducive to metal ion exchange and surface precipitation (additional information available in ESI†).
| Element | Weight (%) | |
|---|---|---|
| Before | After | |
| C | 76.62 | 79.78 |
| O | 17.26 | 15.02 |
| K | 2.91 | 1.41 |
| Ca | 1.78 | 0.67 |
| Na | 0.37 | 0.13 |
| Mg | 1.06 | 0.59 |
| Cd | 0 | 2.4 |
| Total | 100 | |
XPS analysis further investigated the composition and valence states of elements on the surface of TBB700 at the micro level before and after adsorption in order to detect the immobilization mechanism of Cd2+. Cd3d peak appeared at 406.08 eV in the XPS spectrum after adsorption of Cd2+ (Fig. 12a), which further revealed that Cd2+ was found on the surface of TBB700. Spectra of Cd3d exhibited Cd3d5/2 and Cd3d3/2 peaks located at 405.50 and 412.15 eV, indicating Cd2+ was combined to the TBB700 in the form of CdCO3, and Cd–O/Cd(OH)2 bonds at 406.72 and 413.33 eV (Fig. 12b). The peaks at 405.50 and 412.15 eV indicated that Cd2+ was complexed with deprotonated form (–O−) or hydroxyl (–OH) on the TBB as well.15,59 The high-resolution C1s spectrum was decomposed into eight peaks (Fig. 12c). The binding energies of 284.49, 285.89, 286.87, 287.99, and 289.95 eV were distributed on sp2C, sp3C, C–O, C![[double bond, length as m-dash]](https://www.rsc.org/images/entities/char_e001.gif) O/C–O–C, and O–C
O/C–O–C, and O–C![[double bond, length as m-dash]](https://www.rsc.org/images/entities/char_e001.gif) O, respectively. The binding of 291.42 eV can be traced to the π–π* transition, which is characteristic of conjugated or aromatic systems.15,60 As an electron-rich aromatic π donor, TBB700 could interact with Cd2+ as a π receptor. The binding energies of 292.78 and 295.76 eV could have a bearing on K2p3/2 and K2p1/2, respectively. As shown in Fig. 12d, after Cd2+ adsorption, the C–O shifted slightly from 286.87 to 286.80 eV, and the O–C
O, respectively. The binding of 291.42 eV can be traced to the π–π* transition, which is characteristic of conjugated or aromatic systems.15,60 As an electron-rich aromatic π donor, TBB700 could interact with Cd2+ as a π receptor. The binding energies of 292.78 and 295.76 eV could have a bearing on K2p3/2 and K2p1/2, respectively. As shown in Fig. 12d, after Cd2+ adsorption, the C–O shifted slightly from 286.87 to 286.80 eV, and the O–C![[double bond, length as m-dash]](https://www.rsc.org/images/entities/char_e001.gif) O shifted slightly from 289.95 to 289.82 eV, indicating that the adsorption of Cd2+ by TBB involves –OH and –COOH. The release of potassium ions from the surface of biochar brings about the vanishing of the potassium peak, which indicates the ion exchange between cadmium and potassium ions. This was consistent with the results of SEM element mapping (Fig. 10 and Table 5).
O shifted slightly from 289.95 to 289.82 eV, indicating that the adsorption of Cd2+ by TBB involves –OH and –COOH. The release of potassium ions from the surface of biochar brings about the vanishing of the potassium peak, which indicates the ion exchange between cadmium and potassium ions. This was consistent with the results of SEM element mapping (Fig. 10 and Table 5).
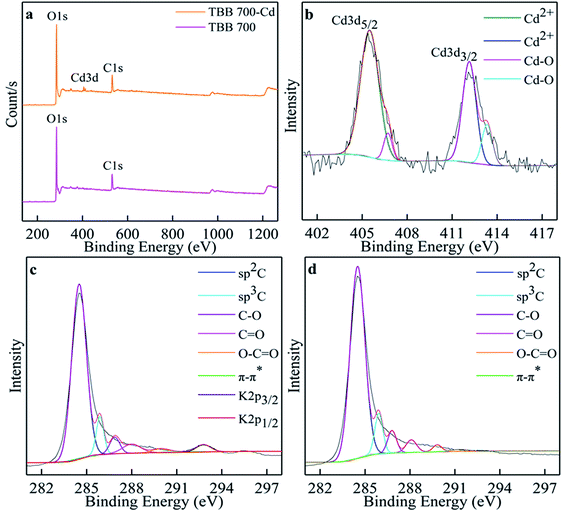 | ||
| Fig. 12 XPS of TBB700 before and after Cd2+ adsorption (a); Cd 3d for TBB700 after Cd2+ adsorption (b); C1s for TBB700 before (c) and after (d) Cd2+ adsorption. | ||
4. Conclusion
Until now, there have been no studies on the production of biochar derived from TB and its application for Cd2+ removal from aqueous media. In this study, TBB700 exhibited outstanding surface properties, high adsorption capacity, excellent reusability, and stability after five cycles of adsorption. The adsorption mechanism of TBB mainly included surface complexation, precipitation, metal ion exchange, and Cd2+–π interaction. Overall, this study showed that TBB700 was an environmentally friendly, effective, and low-cost sorbent for the treatment of Cd2+ contaminated water.Conflicts of interest
There are no conflicts to declare.Acknowledgements
This work was supported by the National Natural Science Foundation of China (31460100 and 31660477), Postgraduate Research & Practice Innovation Program of Jiangsu Province (SJCX21-1186 and SJCX21-1187), and National College Students Innovation and Entrepreneurship Training Program of Jiangsu Province (2020-C-03).References
- X. Cui, H. Hao, C. Zhang, Z. He and X. Yang, Sci. Total Environ., 2016, 539, 566–575 CrossRef CAS.
- Y. Asci, M. Nurbas and Y. S. Acikel, J. Hazard. Mater., 2008, 154, 663–673 CrossRef CAS PubMed.
- X. Gong, D. Huang, Y. Liu, Z. Peng, G. Zeng, P. Xu, M. Cheng, R. Wang and J. Wan, Crit. Rev. Biotechnol., 2018, 38, 455–468 CrossRef CAS.
- J. He, Y. Ren, X. Chen and H. Chen, Ecotoxicol. Environ. Saf., 2014, 108, 114–119 CrossRef CAS PubMed.
- G. Z. Kyzas, B. George, R. I. Kosheleva, E. K. Efthimiadou, E. P. Favvas, K. Margaritis and A. C. Mitropoulos, Chem. Eng. J., 2018, 356, 91–97 CrossRef.
- M. Bilal, J. A. Shah, T. Ashfaq, S. Gardazi, A. A. Tahir, A. Pervez, H. Haroon and Q. Mahmood, J. Hazard. Mater., 2013, 263, 322–333 CrossRef CAS PubMed.
- R. Jazini, M. Soleimani and N. Mirghaffari, Water Environ. J., 2018, 32, 125–133 CrossRef CAS.
- Q. H. Wang, Z. Y. Lai, J. Mu, D. M. Chu and X. R. Zang, Waste Manag., 2020, 105, 102–109 CrossRef CAS.
- R. Li, H. Deng, X. Zhang, J. J. Wang and Z. Zhang, Bioresour. Technol., 2018, 273, 335–340 CrossRef.
- Q. M. Cheng, Q. Huang, S. Khan, Y. J. Liu, Z. N. Liao, G. Li and Y. S. Ok, Ecol. Eng., 2016, 87, 240–245 CrossRef.
- L. M. Zhang, Y. F. Ren, Y. H. Xue, Z. W. Cui, Q. H. Wei, C. Han and J. Y. He, RSC Adv., 2020, 10, 35878–35888 RSC.
- L. Liu and S. S. Fan, Environ. Sci. Pollut. Res., 2018, 25, 8688–8700 CrossRef CAS.
- S. Y. Yoon, S. B. Jang, K. T. Wong, H. Kim, M. J. Kim, C. E. Choong, J. Yang, Y. Y. Chang, S. E. Oh, Y. Yoon and M. Jang, J. Hazard. Mater., 2021, 417, 125995 CrossRef CAS.
- S. Bashir, J. Zhu, Q. L. Fu and H. Q. Hu, Environ. Sci. Pollut. Res., 2018, 25, 11875–11883 CrossRef CAS PubMed.
- J. Z. Zhang, X. F. Ma, L. Yuan and D. X. Zhou, J. Environ. Manage., 2020, 256, 109959 CrossRef CAS PubMed.
- S. Fan, H. Li, Y. Wang, Z. Wang, J. Tang, J. Tang and X. Li, Res. Chem. Intermed., 2018, 44, 135–154 CrossRef CAS.
- Y. F. Jia and K. M. Thomas, Langmuir, 2000, 16, 1114–1122 CrossRef CAS.
- D. Teng, B. Zhang, G. Xu, B. Wang, K. Mao, J. Wang, J. Sun, X. Feng, Z. Yang and H. Zhang, Environ. Pollut., 2020, 265, 115001 CrossRef CAS PubMed.
- F. Huang, L. Y. Gao, R. R. Wu, H. Wang and R. B. Xiao, Sci. Total Environ., 2020, 731, 139–163 CrossRef PubMed.
- R. Z. Wang, D. L. Huang, Y. G. Liu, C. Zhang, C. Lai, G. M. Zeng, M. Cheng, X. M. Gong, J. Wan and H. Luo, Bioresour. Technol., 2018, 261, 265–271 CrossRef CAS PubMed.
- S. H. Lee, T. V. Doherty, R. J. Linhardt and J. S. Dordick, Biotechnol. Bioeng., 2009, 102, 1368–1376 CrossRef CAS PubMed.
- J. Rouquerol, P. Llewellyn and F. Rouquerol, Stud. Surf. Sci. Catal., 2007, 160, 49–56 CrossRef CAS.
- S. Brandani, Adsorption, 2021, 27, 353–368 CrossRef CAS.
- B. Zhao, D. O'Connor, J. L. Zhang, T. Y. Peng, Z. T. Shen, D. C. W. Tsang and D. Y. Hou, J. Cleaner Prod., 2018, 174, 977–987 CrossRef CAS.
- S. Liu, J. H. Li, S. Xu, M. Z. Wang, Y. C. Zhang and X. H. Xue, Bioresour. Technol., 2019, 282, 48–55 CrossRef CAS.
- J. Wei, C. Tu, G. Yuan, Y. Liu, D. Bi, L. Xiao, J. Lu, B. K. G. Theng, H. Wang and L. Zhang, Environ. Pollut., 2019, 251, 56–65 CrossRef CAS.
- M. Ahmad, S. S. Lee, X. M. Dou, D. Mohan, J. K. Sung, J. E. Yang and Y. S. Ok, Bioresour. Technol., 2012, 118, 536–544 CrossRef CAS PubMed.
- W. K. Kim, T. Shim, Y. S. Kim, S. Hyun, C. Ryu, Y. K. Park and J. Jung, Bioresour. Technol., 2013, 138, 266–270 CrossRef CAS PubMed.
- K. M. Jiang, C. G. Cheng, M. Ran, Y. G. Lu and Q. L. Wu, New Carbon Mater., 2018, 33, 183–187 CrossRef.
- S. K. Bhatia, R. Gurav, T. R. Choi, H. J. Kim, S. Y. Yang, H. S. Song, J. Y. Park, Y. L. Park, Y. H. Han, Y. K. Choi, S. H. Kim, J. J. Yoon and Y. H. Yang, Bioresour. Technol., 2020, 302, 122872 CrossRef CAS PubMed.
- K. H. Kim, J. Y. Kim, T. S. Cho and J. W. Choi, Bioresour. Technol., 2012, 118, 158–162 CrossRef CAS.
- W. J. Liu, H. Jiang and H. Q. Yu, Chem. Rev., 2015, 115, 12251–12285 CrossRef CAS PubMed.
- D. Angin, Bioresour. Technol., 2013, 128, 593–597 CrossRef CAS.
- I. D. Manariotis, K. N. Fotopoulou and H. K. Karapanagioti, Ind. Eng. Chem. Res., 2015, 54, 9577–9584 CrossRef CAS.
- L. Wei, S. Liang, N. M. Guho, A. J. Hanson, M. W. Smith, M. Garcia-Perez and A. G. Mcdonald, J. Anal. Appl. Pyrolysis, 2015, 115, 268–278 CrossRef CAS.
- B. B. Uzun, E. Apaydin-Varol, F. Ates, N. Ozbay and A. E. Putun, Fuel, 2010, 89, 176–184 CrossRef CAS.
- R. Karunanithi, Y. S. Ok, R. Dharmarajan, M. Ahmad, B. Seshadri, N. Bolan and R. Naidu, Environ. Technol. Innovation, 2017, 8, 113–125 CrossRef.
- Z. Wang, J. Cao and J. Wang, J. Anal. Appl. Pyrolysis, 2009, 84, 179–184 CrossRef CAS.
- X. He, Z. N. Hong, J. Jiang, G. Dong, H. Liu and R. K. Xu, Environ. Sci. Pollut. Res., 2021 DOI:10.1007/s11356-021-13742-8.
- J. Zhang and P. Zheng, RSC Adv., 2015, 5, 17768–17774 RSC.
- X. L. Dong, L. Q. Ma, J. Gress, W. Harris and Y. C. Li, J. Hazard. Mater., 2014, 267, 62–70 CrossRef CAS.
- Z. W. Cui, Y. F. Ren, W. Wang, L. M. Zhang, L. Y. Zhang, X. Y. Wang and J. Y. He, Environ. Sci., 2020, 41, 3315–3325 Search PubMed.
- X. Huang, N. Y. Gao and Q. L. Zhang, J. Environ. Sci., 2007, 19, 1287–1292 CrossRef CAS.
- P. Z. Zhang, Y. F. Li, Y. Y. Cao and L. J. Han, Bioresour. Technol., 2019, 285, 121348 CrossRef CAS PubMed.
- K. L. Qiao, W. J. Tian, J. Bai, J. Dong, J. Zhao, X. X. Gong and S. H. Liu, Ecotoxicol. Environ. Saf., 2018, 149, 80–87 CrossRef CAS.
- F. Reguyal, A. K. Sarmah and W. Gao, J. Hazard. Mater., 2017, 321, 868–878 CrossRef CAS PubMed.
- G. Y. Chen, C. B. Wang, J. N. Tian, J. P. Liu, Q. J. Ma, B. Liu and X. P. Li, J. Water Process. Eng., 2020, 35, 101223 CrossRef.
- Z. Chen, T. Liu, J. J. Tang, Z. J. Zheng, H. M. Wang, Q. Shao, G. L. Chen, Z. X. Li, Y. Q. Chen, J. W. Zhu and T. Feng, Environ. Sci. Pollut. Res., 2018, 25, 11854–11866 CrossRef CAS.
- J. H. Park, J. J. Wang, S. H. Kim, S. W. Kang, C. Y. Jeong, J. R. Jeon, K. H. Park, J. S. Cho, R. D. Delaune and D. C. Seo, J. Colloid Interface Sci., 2019, 553, 298–307 CrossRef CAS.
- Y. Xian, J. Wu, G. Yang, R. Liao, X. Zhang, H. Peng, X. Yu, F. Shen, L. Li and L. Wang, RSC Adv., 2018, 8, 28002–28012 RSC.
- K. Yakkala, M. R. Yu, H. Roh, J. K. Yang and Y. Y. Chang, Desalin. Water Treat., 2013, 51, 7732–7745 CrossRef CAS.
- X. Han, C. F. Liang, T. Q. Li, K. Wang, H. G. Huang and X. E. Yang, J. Zhejiang Univ., Sci., B, 2013, 7, 640–649 CrossRef.
- H. Li, Y. Yang, S. Yang, A. Chen and D. Yang, J. Spectrosc., 2014, 2014, 671956 Search PubMed.
- X. D. Cao and W. Harris, Bioresour. Technol., 2010, 101, 5222–5228 CrossRef CAS PubMed.
- L. Trakal, V. Veselska, I. Safarik, M. Vitkova, S. Cihalova and M. Komarek, Bioresour. Technol., 2016, 203, 318–324 CrossRef CAS PubMed.
- F. Zhang, X. Wang, D. X. Yin, B. Peng, C. Y. Tan, Y. G. Liu, X. F. Tan and S. X. Wu, J. Environ. Manage., 2015, 153, 68–73 CrossRef CAS PubMed.
- G. C. Tan, W. L. Sun, Y. R. Xu, H. Y. Wang and N. Xu, Bioresour. Technol., 2016, 211, 727–735 CrossRef CAS PubMed.
- H. Wang, B. Gao, S. Wang, J. Fang, Y. Xue and K. Yang, Bioresour. Technol., 2015, 197, 356–362 CrossRef CAS PubMed.
- G. Q. Tan and D. Xiao, J. Hazard. Mater., 2009, 164, 1359–1363 CrossRef CAS.
- X. Hu, Z. Ding, A. R. Zimmerman, S. Wang and B. Gao, Water Res., 2015, 68, 206–216 CrossRef CAS.
Footnote |
| † Electronic supplementary information (ESI) available. See DOI: 10.1039/d1ra04235a |
| This journal is © The Royal Society of Chemistry 2021 |

