 Open Access Article
Cost-effective and sensitive anthocyanin-based paper sensors for rapid ammonia detection in aqueous solutions†
Shamshad Ul Haq ,
Maryam Aghajamali
 and
Hassan Hassanzadeh
 *
*
Department of Chemical and Petroleum Engineering, University of Calgary, Alberta, Canada. E-mail: hhassanz@ucalgary.ca
First published on 12th July 2021
Abstract
In this work, we developed a cost-effective and environmentally friendly anthocyanin-based paper sensor with high sensitivity and optical visibility for the rapid detection of ammonia in aqueous solutions. The detection principle is based on a color change upon ammonia exposure to an anthocyanin-containing paper, which can be recorded simply via a smartphone. The paper sensors were fabricated by extracting anthocyanin from different sources (i.e., red cabbage, blueberry, and blackberry) and immersing pre-cut paper in anthocyanin extracts. Anthocyanin was extracted from different sources into water and aqueous ethanolic solution (80%) using solid–liquid extraction (SLE) and sonication assisted extraction (SAE) methods. The sensor sensitivity and optical visibility were improved by selecting a suitable combination of anthocyanin source, extraction technique, and solvent and controlling the ammonia release from the samples via alkalinization using a suitable base. Sensors fabricated with anthocyanin extracted from red cabbage (Red-C) into water using the SLE method and samples alkalinized with NaOH showed higher sensor sensitivity and better optical visibility. The Red-C anthocyanin sensors also exhibited a visible color change from dark to light blue for ammonia samples with concentrations as low as 2 mg NH3–N/L. Moreover, the spike recovery results of the sensors (101.9–109.4%) were in good agreement with those of the standard spectrophotometry method (105.4–112.2%), which suggest that these biosensors are a promising analytical tool as a replacement for time-consuming and environmentally unfriendly standard spectrophotometry methods for the on-site screening of ammonia.
Introduction
The widespread use of ammonia and its derivatives in fertilizers, explosives, refrigeration systems, corrosion inhibitors, and wastewater treatment contributes significantly to the increase of ammonia concentration in the environment.1–3 The surplus release of nitrogen-containing nutrients (e.g., ammonia) into the environment triggers a potential risk for aquatic-biota, water qualities, and human health.3 The use of anhydrous ammonia as a fertilizer can cause serious health effects such as skin burns, pulmonary congestion, blindness, and death.4 The continual upsurge of ammonia concentration in the aquatic environment encourages the growth of plankton communities, leading to the production of algal bloom and eutrophication and consequently poses a potential risk for marine life.5,6 Moreover, ammonia can be converted to nitrate and nitrite via the nitrification process, and these products also have a toxic effect on human and aquatic life.7–11 Therefore, it is essential to detect and monitor ammonia concentration for sustainable water sources, survival of aquatic and human life, and developing emergency management plans.The most widely used and investigated methods for ammonia detection are nesslerization and phenate methods. In the nesslerization method, ammonia reacts with mercury(II) iodide in an alkaline media to form a yellow product.12,13 In the phenate method, ammonia reacts with hypochlorite and phenol in an alkaline media in the presence of sodium nitroprusside to form indophenol blue.14,15 These products can be detected with a simple spectrophotometry approach. However, these methods suffer from issues such as the use of toxic or unstable reactants (e.g., mercury, phenol, hypochlorite, sodium nitroprusside), sample pretreatment, catalyst requirement, long reaction time, and toxic byproducts (e.g., o-chloro-phenol).5,12,16,17 Sequential injection gas diffusion device,18 microfluidic paper-based analytical device (μPAD),19 fluorescence detection,20 and paper-based sensors fabricated with solid Berthelot reagents,21 are examples of other ammonia detection methods. Sensitivity to the temperature and pH change, wetting and clogging of the membrane, low sensor sensitivity, the use of toxic chemicals, and complicated sensor fabrication process are some limitations associated with these methods.5,17 Therefore, there is still a requirement to develop a rapid, sensitive, environmentally friendly, straightforward, and cost-effective ammonia detection method.
Paper-based sensing techniques recently received attention and have been used for ammonia analysis in water and air samples.22–25 Cost-effectiveness, convenience, and versatility are some advantages of these paper-based sensing methods.17,26 Anthocyanins extracted from plants, vegetables, or fruits are natural pH indicators that can be used as active material in paper sensors as a substitute for synthetic indicators. Although this material is non-toxic and water-soluble, there are only few reports in which anthocyanin-based papers, fibers, and polymer films were used to detect ammonia in aqueous or gaseous forms.17,27–30 Early studies only focused on anthocyanin extraction from one anthocyanin source and sensor fabrication to detect ammonia in aqueous or gaseous samples. However, the effect of different anthocyanin sources on the sensor performance is not investigated. Moreover, there is no systematic study on the anthocyanin extraction process and the effect of different parameters (e.g., extraction technique, extracting solvent) on the sensor sensitivity and optical visibility.
In this work, we extracted anthocyanin from three different sources (i.e., red cabbage, blueberry, and blackberry) into the water (Aq100) and 80% aqueous ethanolic solution (Aq20Et80) using solid–liquid extraction (SLE) and sonication assisted extraction (SAE) methods. We then fabricated anthocyanin-based paper sensors and investigated the effect of different parameters (i.e., anthocyanin source, extraction method, solvent) on biosensor sensitivity and optical visibility. Alkalinization also has a substantial effect on the sensor sensitivity by facilitating ammonia release from aqueous samples, which has been investigated here to improve the sensor performance.
Results and discussion
The overall procedure for ammonia detection using anthocyanin-based paper sensors is represented in Fig. 1. Anthocyanin extracted from different sources (i.e., red cabbage, blueberry, and blackberry) was used to fabricate sensors by immobilization of anthocyanin on a filter paper by simple immersion. The wet anthocyanin-immobilized paper sensor was then exposed to an alkaline ammonium solution, and a color change was observed upon exposure to released ammonia gas. The sensor reaction zone was imaged with a smartphone camera and analyzed using ImageJ software for RGB quantification to correlate ammonia concentration with red intensity absorbance. | ||
| Fig. 1 Schematic representation of the analytical method developed for ammonia detection using anthocyanin-based paper sensors. | ||
The mechanism involves the conversion of ammonium ion (NH4+) in an aqueous solution to ammonia gas (NH3) by alkalinization. Total ammonia nitrogen (TAN) is the equilibrium combination of ionized ammonia (NH4+) and unionized ammonia (NH3) in water, which is temperature and pH dependent. Following alkalinization, ionized ammonia (NH4+) converts to unionized ammonia (NH3) represented by the following equation:
| NH4Cl + MOH → NH3 + MCl + H2O | (1) |
The generated NH3 gas diffuses freely through the reaction unit headspace and leads to a color change in the wet anthocyanin-based paper sensor placed at the top of the reaction unit due to the pH change of anthocyanin.17 The intensity of the blue color is proportional to ammonia concentration, which is quantified using ImageJ software in terms of red intensities absorbance.
Anthocyanin extraction
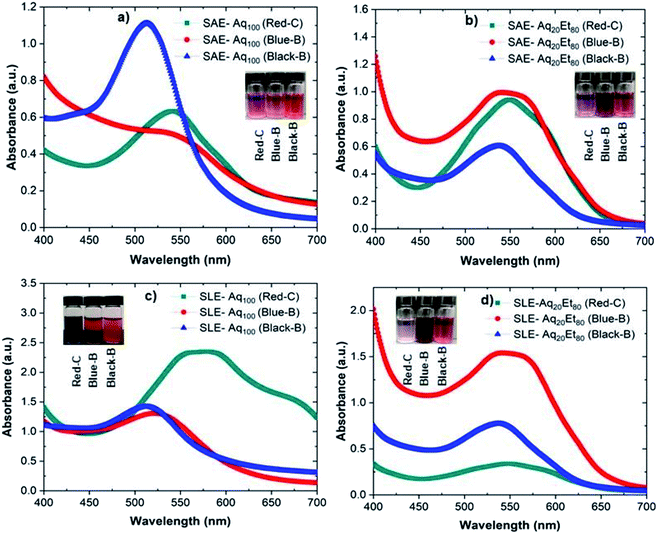
Anthocyanin is a natural pigment belonging to the polyphenol family; therefore, it is soluble and extractable in most polar solvents such as water or alcohols. However, the extent of solubility might depend on the solvent type or the extraction technique as investigated here. In this work, we selected three anthocyanin commodities (i.e., red cabbage, blueberry, and blackberry) based on their fraction purity, content, cost, and availability.31 Anthocyanin was then extracted from red cabbage (Red-C), blueberry (Blue-B), and blackberry (Black-B) via solid–liquid extraction (SLE) or sonication assisted extraction (SAE) methods into the water (Aq100) or 80% aqueous ethanolic solution (Aq20Et80).The UV-Vis spectra of anthocyanin extracted from Red-C, Blue-B, and Black-B into water (Aq100) and 80% aqueous ethanolic solution (Aq20Et80) via SAE and SLE techniques are presented in Fig. 2 (see Fig. S1† for the full spectra). Photos of vials containing anthocyanin extracts are shown as insets in Fig. 2. Fig. 2a and b demonstrate the UV-Vis spectra of anthocyanin extracted from different commodities via the SAE method into Aq100 and Aq20Et80, respectively. In these figures, Black-B shows maximum absorbance at 512 and 545 nm in Aq100 and Aq20Et80, respectively. Blue-B indicates maximum absorbance at 530 and 547 nm in Aq100 and Aq20Et80, respectively. Red-C demonstrates maximum absorbance at 537 and 550 nm in Aq100 and Aq20Et80, respectively. These anthocyanin extracts show maximum absorbance in the range of 500–550 nm, which slightly shifts to a higher wavelength (i.e., redshift) when extracted into Aq20Et80. We also observed that the color of anthocyanin solutions extracted from different commodities are different (see Fig. 2 insets), which might be because of the difference in anthocyanin pH or concentration in different extracts. Since it has been shown that the protonated form of anthocyanin results in a red color, while the deprotonated form of anthocyanin produces a purple color.32
Fig. 2c and d show the UV-Vis spectra of anthocyanin extracted from different commodities via the SLE method into Aq100 and Aq20Et80, respectively. In these figures, Black-B shows maximum absorbance at 510 and 540 nm in Aq100 and Aq20Et80, respectively. Blue-B exhibits maximum absorbance at 520 and 547 nm in Aq100 and Aq20Et80, respectively. Red-C indicates maximum absorbance at 570 and 547 nm in Aq100 and Aq20Et80, respectively. As seen in Fig. 2, there is a spectral shift for anthocyanin extracted from different commodities into different solvents using different methods. Moreover, the amount of anthocyanin extraction might vary depending on the method or the solvent, which is consistent with the color observed for the extracts (Fig. 2 insets). For example, Red-C anthocyanin shows both spectral shift and different extraction amount when extracted with different methods (SAE or SLE) into different solvents (Aq100 or Aq20Et80). Among different method–solvent combinations, Red-C anthocyanin extracted into Aq100 via the SLE method offers the highest wavelength at maximum absorbance (i.e., 570 nm) and the highest absorbance, consequently the highest concentration among all anthocyanin extracts.
Sensor fabrication
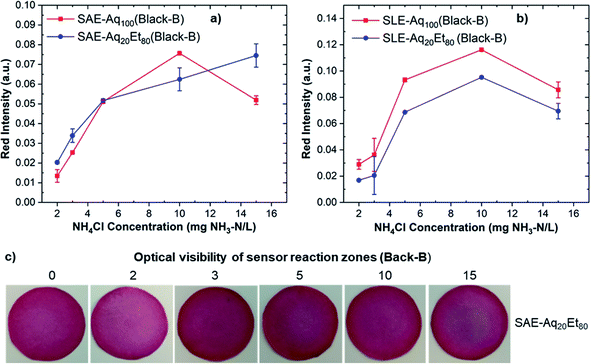
Anthocyanin extracts were used to fabricate paper sensors by dipping pre-cut filter papers in anthocyanin-containing solutions. Anthocyanin-based paper sensors were then exposed to alkaline ammonium solutions with concentrations of 2–15 mg NH3–N/L and used for ammonia detection based on the color change of the sensor reaction zone. The color change was imaged with a smartphone camera and analyzed using ImageJ software.Fig. 3a and b demonstrate the red intensity absorbance of sensors fabricated from Black-B anthocyanin extracts via SAE and SLE methods, respectively. The reported red intensity values show the average of measurements on three paper sensors. Sensors fabricated from all Black-B extracts (except Black-B/SAE/Aq20Et80) show maximum red intensity at 10 mg NH3–N/L. The sensor fabricated from Black-B/SAE/Aq20Et80 exhibits maximum red intensity at 15 mg NH3–N/L. Comparing red intensity results for Black-B anthocyanin sensors also reveal that the sensor fabricated from Black-B/SLE/Aq100 offers the highest red intensity, and consequently, the highest sensor sensitivity. This might be because of the high amount of anthocyanin extracted from Black-B using SLE-Aq100 (see Fig. 2c). The photos of Black-B anthocyanin-based paper sensors after exposure to different ammonia concentrations are shown in Fig. S2.† A more visible color change from red to blue at ammonium concentrations above 5 mg NH3–N/L was observed for paper sensors fabricated from Black-B/SAE/Aq20Et80, probably due to their lighter background colors (see Fig. 3c).
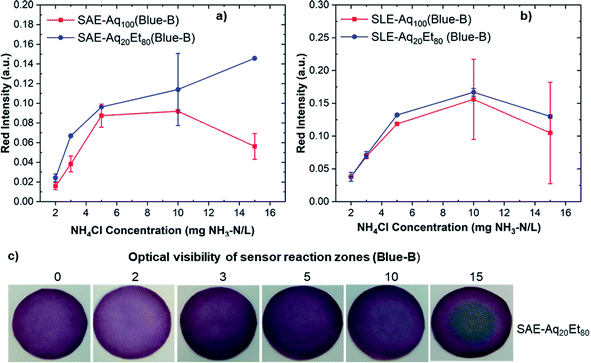
The red intensity absorbance of sensors fabricated from Blue-B anthocyanin extracts via SAE and SLE methods is shown in Fig. 4a and b. The reported red intensity values show the average of measurements on three paper sensors. Comparing red intensity results for Blue-B anthocyanin sensors indicate that the sensors fabricated from Blue-B/SLE/Aq20Et80 and Blue-B/SLE/Aq100 offer higher red intensities and consequently higher sensor sensitivity. Since the SLE method results in high anthocyanin concentration in Blue-B extracts in both solvents (see Fig. 2), sensors fabricated with both extracts show higher sensitivity. The photos of Blue-B anthocyanin-based paper sensors after exposure to different ammonia concentrations are shown in Fig. S3.† All sensors show a color change from pink or purple to blue at ammonium concentrations above 5 mg NH3–N/L. A more visible color change from purple to blue was observed for paper sensors fabricated from Blue-B/SAE/Aq20Et80 (see Fig. 4c).
Fig. 5a and b show the red intensity absorbance of sensors fabricated from Red-C anthocyanin extracts via SAE and SLE methods, respectively. The reported red intensity values show the average of measurements on three paper sensors. Interestingly, sensors fabricated from Red-C anthocyanin extracts show higher red intensities and more reproducible results at all ammonium concentrations compared to Black-B and Blue-B anthocyanin sensors. Among Red-C extracts, Red-C/SLE/Aq100 offers the highest red intensity absorbance and consequently higher sensor sensitivity. This is consistent with the UV-Vis spectroscopy data on anthocyanin extracts since Red-C/SLE/Aq100 resulted in the extract with the highest absorbance, and consequently, the highest anthocyanin concentration. The photos of Red-C anthocyanin sensors after exposure to different ammonia concentrations are shown in Fig. 6. All Red-C anthocyanin sensors show a visible color change from purple or dark blue to light blue at ammonium concentrations ≥3 mg NH3–N/L. Sensors fabricated from Red-C/SAE/Aq100, and Red-C/SLE/Aq100 extracts also exhibit a visible color change at 2 mg NH3–N/L, which is the lowest reported value for ammonia detection by a visual screening of anthocyanin-based paper sensors. This is a significant achievement for visual ammonia sensing since it has been reported that the triggering value of ammonia in freshwater is 0.32 to 2.3 mg NH3–N/L, and we can visually detect ammonia at any concentrations above the triggering point (i.e., 2.3 mg NH3–N/L).22
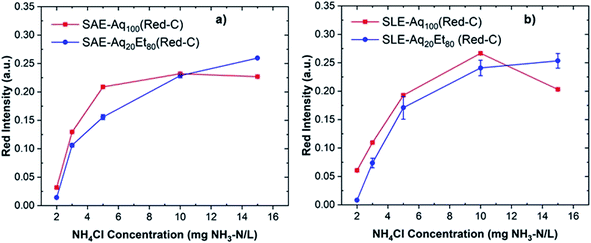 | ||
| Fig. 5 Red intensity absorbance of Red-C anthocyanin-based paper sensors at different ammonium concentrations fabricated from Red-C extracts via SAE (a) and SLE (b) methods. | ||
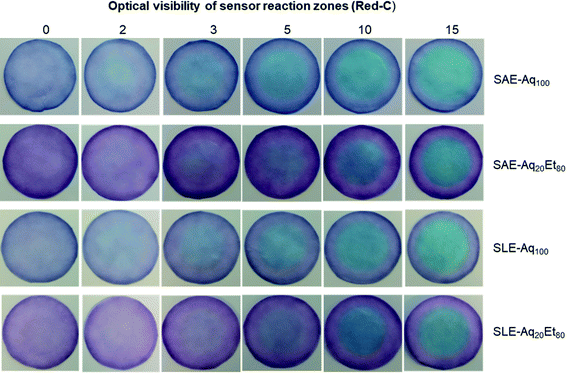 | ||
| Fig. 6 The photos of Red-C anthocyanin-based paper sensors after exposure to different ammonia concentrations (0 represents the blank sample). | ||
Effect of anthocyanin source on sensor sensitivity
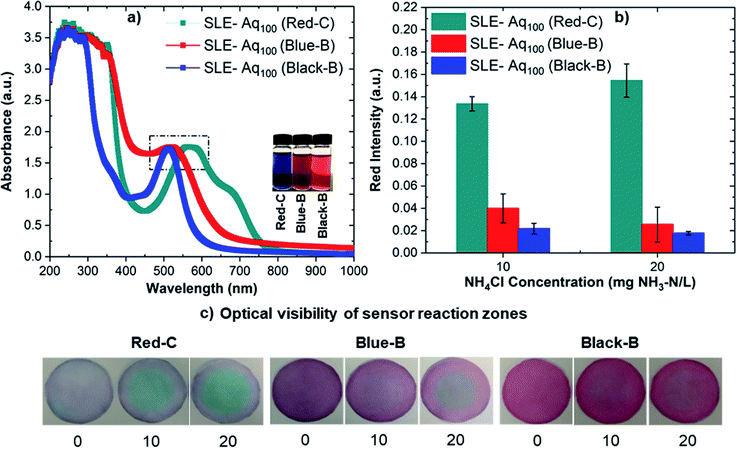
In this work, we extracted anthocyanin from different sources (i.e., Black-B, Blue-B, and Red-C) to fabricate paper sensors and observed that Red-C anthocyanin sensors provide higher sensor sensitivity and better optical visibility. As seen in Fig. 2, anthocyanin extracts from different sources show different absorbance, which implies that the anthocyanin concentration in these extracts might be different. Since the difference in anthocyanin concentration might have an impact on sensor sensitivity and optical visibility, anthocyanin concentrations were made equal by diluting the concentrated extracts, and the extracts with equal anthocyanin concentrations were used to fabricate sensors. For this study, anthocyanin was extracted from different sources in Aq100 via the SLE method, and the analysis was performed on ammonium samples containing 10 and 20 mg NH3–N/L.Fig. 7a shows UV-Vis spectra of anthocyanin extracted from Black-B, Blue-B, and Red-C in Aq100 via SLE after concentration equalization. Fig. 7b demonstrates the red intensities for the sensors fabricated from the extracts having equal anthocyanin concentrations. The results indicate that Red-C anthocyanin sensors have higher red intensities, and consequently higher sensitivity, compared to Blue-B and Black-B anthocyanin sensors even at equal anthocyanin concentrations. The color change of the sensor reaction zone is also more visible for Red-C anthocyanin sensors in comparison with Blue-B and Black-B anthocyanin sensors (see Fig. 7c). According to the literature, Blue-B shows higher anthocyanin fraction purity (99.9%), followed by Red-C (99.4%) and Black-B (97.7%).31 Anthocyanin content of Blue-B (163.5 mg/100 g) is also higher compared to Black-B (90.46 mg/100 g) and Red-C (72.98% mg/100 g).31 Therefore, we expected that Blue-B anthocyanin might provide higher sensor sensitivity and better optical visibility, while Red-C anthocyanin offered better sensor performance and more visible color change.
Effect of alkalinization on sensor sensitivity
The ammonium ion (NH4+) in the sample converts to ammonia gas (NH3) via alkalinization. A rapid alkalinization could reduce the reaction time and improve the sensor sensitivity through the efficient release of ammonia. Although all bases can alkalinize the ammonium solution, the rate of alkalinization depends on the type of base and its dissociation constant in the aqueous media. Therefore, we selected three bases (i.e., NaOH, KOH, Ca(OH)2) and investigated their effect on the alkalinization process and sensor sensitivity. The NaOH, KOH, and Ca(OH)2 solutions (2 M) were prepared and used to convert NH4+ to NH3 in the samples. The anthocyanin extracted from different sources in Aq100 via the SLE method was used to fabricate sensors, and the sensor sensitivity was investigated for ammonia concentrations of 5, 10, and 20 mg NH3–N/L.Fig. 8 shows red intensities of the sensors fabricated from anthocyanin extracted from different sources (Black-B, Blue-B, and Red-C) after exposure to ammonia, where ammonium containing sample is alkalinized by NaOH (Fig. 8a), KOH (Fig. 8b), and Ca(OH)2 (Fig. 8c). Higher red intensity values were observed for the sensors when NaOH was used for alkalinization, followed by KOH and Ca(OH)2. NaOH and KOH are both strong bases containing alkali metal cations (i.e., Na+, K+) and dissociate completely in the aqueous media, so we expected similar sensor sensitivity from these bases, but we observed different responses. Ca(OH)2 is also a strong base but less soluble in water and settles down slightly at the bottom of the reaction unit, resulting in lower sensor sensitivity compared to NaOH and KOH because of less ammonia release. These results reflect the importance of base selection and the effect of base type on the sensor sensitivity. Photographs of the sensors fabricated from Red-C, Blue-B and Black-B anthocyanin extracts and alkalinized by NaOH, KOH, and Ca(OH)2 are shown in Fig. S4.† These photos qualitatively indicate that alkalinization with NaOH offers a more visible color change in the sensor reaction zone compared to alkalinization with KOH or Ca(OH)2, consistent with red intensity results.
 | ||
| Fig. 8 Red intensities of sensors fabricated from Red-C, Blue-B and Black-B anthocyanin after exposure to ammonia gas, following alkalinization with (a) NaOH, (b) KOH, and (c) Ca(OH)2. | ||
Sensor validation and analytical performance
Analytical features of anthocyanin-based paper sensors were calculated based on the optimum results obtained in previous sections. Sensors were fabricated from Red-C anthocyanin extracted into Aq100 via the SLE method, and ammonium samples were alkalinized with NaOH. The analytical features such as the linear working range, limit of detection (LOD), limit of quantification (LOQ), reproducibility, and the spike recovery were analyzed under optimum conditions. The linear working range of the sensor was obtained from the calibration curve established by measuring the red intensity absorbance at different ammonium concentrations. Fig. 9 shows the calibration curve of Red-C anthocyanin sensors with a coefficient of determination (R2) of 0.9835. The developed analytical method demonstrated a linear working range of 1–10 mg NH3–N/L. The limit of detection (LOD) and limit of quantification (LOQ) were calculated from the calibration curve using the following equations:
 | (2) |
 | (3) |
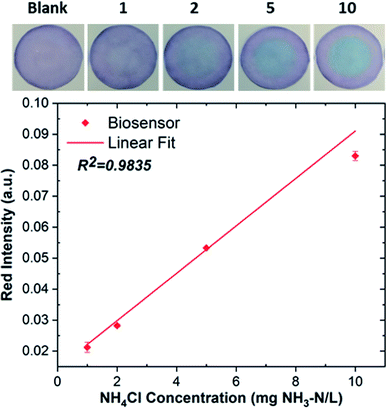 | ||
| Fig. 9 Calibration curve of Red-C anthocyanin-based paper sensor. Photos of the sensor reaction zone after exposure to ammonia samples with concentrations of 1–10 mg NH3–N/L are shown as insets. | ||
| Parameters | Our results | Literature results27 |
|---|---|---|
| Limit of detection (LOD), mg NH3–N/L | 0.29 | 0.29 |
| Limit of quantification (LOQ), mg NH3–N/L | 0.97 | 0.98 |
| Linear working range, mg NH3–N/L | 1–10 | 1–25 |
| Reproducibility (% RSD) | 3.57 | 4.2 |
| Recovery (%) | 101.9–109.4 | 89.6–110 |
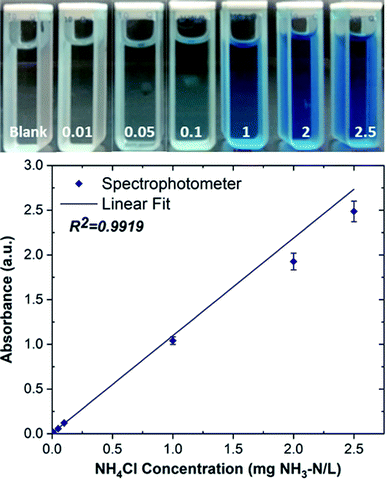
The accuracy of anthocyanin-based paper sensors was validated by the standard spectrophotometry method. The standard phenate method (4500-NH3 F) was used for ammonia determination, in which indophenol blue forms following the reaction of ammonia with hypochlorite and phenol in an alkaline media in the presence of sodium nitroprusside.33 The concentration of NH3 is determined by Beer–Lambert law, which correlates the NH3 concentration with the absorbance of light passing through the blue color product. Fig. 10 shows the calibration curve obtained via the spectrophotometry method, which exhibits the linear working range of 0.01–2.5 mg NH3–N/L with the coefficient of determination (R2) of 0.9919.
The accuracy of the anthocyanin-based paper sensor was evaluated with the spike recovery, and the results were compared with the spectrophotometry results. For the spike recovery, four ammonium samples with different concentrations in the range of 5–20 mg NH3–N/L were analyzed. The concentrated samples were diluted with water to keep the concentration within the linear working range in both methods. As seen in Table 2, the spike recovery results of the sensors (101.9–109.4%) are in good agreement with the results of the standard spectrophotometry method (105.4–112.2%). Moreover, we calculated the t-value for the statistical comparison of the results obtained by the two methods. The calculated t-value is 0.62, which is less than the critical t-value (2.13) at a 95% confidence level. This suggests that the developed sensing method is suitable for ammonia determination as a replacement for the standard spectrophotometry method. Overall, the proposed anthocyanin-based paper sensor is applicable for ammonia detection in real samples; however, one should consider the effect of interferants and other contaminants present in real samples such as volatile organic compounds, counterions, and pH of the sample.
| Ammonium conc. (mg NH3–N/L) | NH3 recovered | NH3 recovered | Recovery (%) | |
|---|---|---|---|---|
| Spectrophotometer | Biosensor | Spectrophotometer | Biosensor | |
| 5 | 5.4117 ± 0.0292 | 8.3033 ± 2.8329 | 107.6 | 109.4 |
| 10 | 10.9978 ± 0.0422 | 14.2482 ± 3.5284 | 109.5 | 107.2 |
| 15 | 16.9823 ± 0.1540 | 17.4612 ± 1.6618 | 112.2 | 105.3 |
| 20 | 21.1595 ± 0.0717 | 24.5881 ± 4.2042 | 105.4 | 101.9 |
Conclusions
We have developed an inexpensive, environmentally friendly, and sensitive anthocyanin-based paper sensor as a promising screening tool for instantaneous detection of ammonia in aqueous samples at a micro-level concentration. The high sensitivity and optical visibility of sensors were achieved by selecting the suitable combination of anthocyanin source, extraction technique, and solvent for extracting anthocyanin to fabricate sensors. The alkalinization rate was also optimized by choosing a suitable base to improve the sensor sensitivity. The SLE-Aq100 was the best method–solvent combination for anthocyanin extraction to maximize the sensor sensitivity, and red cabbage offered the highest sensor sensitivity and the best optical visibility of the sensor reaction zone. NaOH also resulted in an efficient ammonia release and improved the sensitivity quantitively and qualitatively. These modifications resulted in anthocyanin-based paper sensors with a visual color change in ammonia samples with concentrations as low as 2 mg NH3–N/L, making them suitable for on-site applications. Overall, we believe that the use of non-toxic reagents, inexpensive reactants and fabrication methods, and simple and fast detection method makes these sensors appealing for rapid ammonia detection in widespread applications.Experimental section
Materials
All reagents were used as received unless otherwise stated. Ammonium chloride was purchased from VWR Life Science. Phenol (liquefied, ≥88.0%) and sodium hydroxide were obtained from EMD Millipore Corporation. Potassium hydroxide and sodium hypochlorite solution (5%) were purchased from Ward's Science. Calcium hydroxide (95%) and sodium nitroprusside dihydrate (99–102%) were obtained from Alfa Aesar. Sodium citrate dihydrate was purchased from Macron Fine Chemicals. Red cabbage, blueberry, and blackberry were purchased from a local supermarket. Deionized water was used to prepare all solutions.Anthocyanin extraction
Red cabbage, blueberry, and blackberry commodities were used to extract anthocyanin into deionized water (Aq100) or 80% aqueous ethanolic solution (Aq20Et80) via sonication assisted extraction (SAE) or solid–liquid extraction (SLE) techniques. Fresh anthocyanin commodities were washed with water and dried at room temperature. The red cabbage was sliced into small pieces. Blueberries and blackberries were smashed in a beaker. 100 g of each commodity was mixed with 100 ml of solvent in a 500 ml round bottom flask (solid to liquid ratio was 1![[thin space (1/6-em)]](https://www.rsc.org/images/entities/char_2009.gif) :
:![[thin space (1/6-em)]](https://www.rsc.org/images/entities/char_2009.gif) 1), and the flask was sealed with parafilm. For the SAE method, the flask containing the mixture was sonicated for 60 min at 40 °C using an ultrasonic bath (VWR Ultrasonic Cleaner). For the SLE method, the flask was placed in an oil bath and stirred for 60 min at 40 °C using a heater/stirrer. After one hour, the mixture was transferred to a CellStar polypropylene centrifuge tube and centrifuged at 4000 rpm for 10 min. After centrifugation, the supernatant was transferred to a screw-capped glass bottle, wrapped with aluminum foil, and stored at 4 °C.
1), and the flask was sealed with parafilm. For the SAE method, the flask containing the mixture was sonicated for 60 min at 40 °C using an ultrasonic bath (VWR Ultrasonic Cleaner). For the SLE method, the flask was placed in an oil bath and stirred for 60 min at 40 °C using a heater/stirrer. After one hour, the mixture was transferred to a CellStar polypropylene centrifuge tube and centrifuged at 4000 rpm for 10 min. After centrifugation, the supernatant was transferred to a screw-capped glass bottle, wrapped with aluminum foil, and stored at 4 °C.
Sensor fabrication
Whatman filter paper (Grade 1) was used to fabricate paper sensors. Filter papers were cut into circular shapes with a diameter of 2.54 cm. Anthocyanin extracted from different sources was added into a Petri dish, and the pre-cut filter paper was dipped in it for 15 min for uniform immobilization of anthocyanin on the paper. After 15 min, the paper was removed and dried at room temperature. The fabricated paper sensors were stored at room temperature under dark conditions and away from any acid or alkaline sources.Ammonia detection using anthocyanin-based paper sensors
Ammonia solutions with concentrations of 1 to 20 mg NH3–N/L were prepared by dissolving NH4Cl powder in deionized water, followed by serial dilution (see ESI† for ammonia solution preparation). The ammonia solution (2 ml) was then added into a glass vial (20 ml), followed by NaOH addition (2 ml, 2 M) for alkalinization (Note: KOH and Ca(OH)2 were also added to study the base effect on sensor sensitivity). The prefabricated paper sensor was wetted with deionized water (50 μl) and put on top of the glass vial or reaction unit. The glass vial was sealed immediately with parafilm to prevent ammonia release and placed under ambient condition for 30 min. After 30 min, the sensor was removed from top of the glass vial and scanned by a smartphone camera. The RGB quantification of sensor reaction zone was performed by ImageJ software to correlate the red intensities absorbance with ammonia concentration using the following equation:| Absorbance = −log(Rs/Rb) | (4) |
Ammonia detection using spectrophotometry
The analytical performance of the paper sensor was validated with the standard spectrophotometry method (i.e., phenate method).33 Phenate method reagents used in this study were prepared as described in ESI.† The standard ammonium solutions in the range of 0.01 to 2.5 mg NH3–N/L and one blank solution were prepared to calibrate the spectrophotometer. 25 ml of the standard (or blank) solution was added into a capped container wrapped with aluminum foil, and phenate method reagents were added stepwise with thorough mixing after each addition. 1 ml phenol solution, 1 ml sodium nitroprusside solution, and 2.5 ml oxidizing solution were added step by step. The sequence of the reagent addition must be followed for reproducible results. The reaction container was placed in a subdued light area for four hours for the reaction completion. After four hours, absorbance spectra were recorded using a UV-1600PC spectrophotometer at 633 nm. Blank solution absorbance was subtracted from standard solution absorbance to obtain the accurate absorbance. A calibration curve was obtained and used to validate the accuracy of anthocyanin-based paper sensors.Characterization
The UV-Vis spectra were recorded on a UV-1600PC spectrophotometer. The photographs of paper sensors were captured with a smartphone (Redmi Note 4, Android). Red intensities of paper sensors were analyzed using ImageJ software (v1.53e).Author contributions
Shamshad Ul Haq developed the methodology and performed investigation, formal analysis, and validation. He also wrote the original draft of the manuscript and conducted visualization. Maryam Aghajamali was involved in conceptualization, project administration, formal analysis, and validation. She also reviewed and edited the original draft and assisted with visualization. Hassan Hassanzadeh acquired funding, supervised the project, and reviewed and edited the manuscript.Conflicts of interest
The authors declare no competing financial interest.Acknowledgements
The authors acknowledge the financial support of the Natural Sciences and Engineering Research Council of Canada (NSERC) and all member companies of the SHARP Research Consortium. Maryam Aghajamali acknowledges the support from the Eyes High at the University of Calgary. The support of the Department of Chemical and Petroleum Engineering and the Schulich School of Engineering is also acknowledged.References
- R. F. Griffiths and G. D. Kaiser, Production of Dense Gas Mixtures from Ammonia Releases — A Review, J. Hazard. Mater., 1982, 6(1), 197–212 CrossRef CAS.
- C. Verma, M. A. Quraishi and E. E. Ebenso, A Review on Ammonia Derivatives as Corrosion Inhibitors for Metals and Alloys; Green Energy and Technology, Springer International Publishing, Cham, 2020 Search PubMed.
- L. Kinidi, I. A. W. Tan, N. B. Abdul Wahab, K. F. B. Tamrin, C. N. Hipolito and S. F. Salleh, Recent Development in Ammonia Stripping Process for Industrial Wastewater Treatment, International Journal of Chemical Engineering, 2018, 2018, 14 CrossRef.
- A. B. Spencer and M. G. Gressel, A Hazard and Operability Study of Anhydrous Ammonia Application in Agriculture, Am. Ind. Hyg. Assoc. J., 1993, 54(11), 671–677 CrossRef CAS.
- D. Li, X. Xu, Z. Li, T. Wang and C. Wang, Detection Methods of Ammonia Nitrogen in Water: A Review, TrAC, Trends Anal. Chem., 2020, 127, 115–890 Search PubMed.
- S. R. M. Kutty and A. Malakahmad, Nutrients Removal from Municipal Wastewater Treatment Plant Effluent Using, World Academy of Science, Engineering and Technology, 2009, 60, 1–9 Search PubMed.
- L. Knobeloch, B. Salna, A. Hogan, J. Postle and H. Anderson, Blue Babies and Nitrate-Contaminated Well Water, Environ. Health Perspect., 2000, 108(7), 675–678 CrossRef CAS PubMed.
- J. R. Tomasso, Comparative Toxicity of Nitrite to Freshwater Fishes, Aquat. Toxicol., 1986, 8(2), 129–137 CrossRef CAS.
- J. M. S. Van Maanen, A. Van Dijk, K. Mulder, M. H. De Baets, P. C. A. Menheere, D. Van der Heide, P. L. J. M. Mertens and J. C. S. Kleinjans, Consumption of Drinking Water with High Nitrate Levels Causes Hypertrophy of the Thyroid, Toxicol. Lett., 1994, 72(1), 365–374 CrossRef CAS PubMed.
- L. Nuñez, X. Cetó, M. I. Pividori, M. V. B. Zanoni and M. Del Valle, Development and Application of an Electronic Tongue for Detection and Monitoring of Nitrate, Nitrite and Ammonium Levels in Waters, Microchem. J., 2013, 110, 273–279 CrossRef.
- J. A. Camargo, A. Alonso and A. Salamanca, Nitrate Toxicity to Aquatic Animals: A Review with New Data for Freshwater Invertebrates, Chemosphere, 2005, 58(9), 1255–1267 CrossRef CAS.
- L. Zhou and C. E. Boyd, Comparison of Nessler, Phenate, Salicylate and Ion Selective Electrode Procedures for Determination of Total Ammonia Nitrogen in Aquaculture, Aquaculture, 2016, 450, 187–193 CrossRef CAS.
- L. N. Demutskaya and I. E. Kalinichenko, Photometric Determination of Ammonium Nitrogen with the Nessler Reagent in Drinking Water after Its Chlorination, Journal of Water Chemistry and Technology, 2010, 32(2), 90–94 CrossRef.
- D. Cogan, J. Cleary, C. Fay, A. Rickard, K. Jankowski, T. Phelan, M. Bowkett and D. Diamond, The Development of an Autonomous Sensing Platform for the Monitoring of Ammonia in Water Using a Simplified Berthelot Method, Anal. Methods, 2014, 6(19), 7606–7614 RSC.
- K. Lin, P. Li, Q. Wu, S. Feng, J. Ma and D. Yuan, Automated Determination of Ammonium in Natural Waters with Reverse Flow Injection Analysis Based on the Indophenol Blue Method with O-Phenylphenol, Microchem. J., 2018, 138, 519–525 CrossRef CAS.
- B. K. Larsen, J. Dalsgaard and P. B. Pedersen, An Optimized and Simplified Method for Analysing Urea and Ammonia in Freshwater Aquaculture Systems, Aquacult. Res., 2015, 46(7), 1608–1618 CrossRef CAS.
- P. Jaikang, P. Paengnakorn and K. Grudpan, Simple Colorimetric Ammonium Assay Employing Well Microplate with Gas Pervaporation and Diffusion for Natural Indicator Immobilized Paper Sensor via Smartphone Detection, Microchem. J., 2020, 152, 104–283 CrossRef.
- R. A. Segundo, R. B. R. Mesquita, M. T. S. O. B. Ferreira, C. F. C. P. Teixeira, A. A. Bordalo and A. O. S. S. Rangel, Development of a Sequential Injection Gas Diffusion System for the Determination of Ammonium in Transitional and Coastal Waters, Anal. Methods, 2011, 3(9), 2049–2055 RSC.
- B. M. Jayawardane, I. D. McKelvie and S. D. Kolev, Development of a Gas-Diffusion Microfluidic Paper-Based Analytical Device (ΜPAD) for the Determination of Ammonia in Wastewater Samples, Anal. Chem., 2015, 87(9), 4621–4626 CrossRef CAS.
- B. Horstkotte, C. M. Duarte and V. Cerdà, A Miniature and Field-Applicable Multipumping Flow Analyzer for Ammonium Monitoring in Seawater with Fluorescence Detection, Talanta, 2011, 85(1), 380–385 CrossRef CAS.
- Y. B. Cho, S. H. Jeong, H. Chun and Y. S. Kim, Selective Colorimetric Detection of Dissolved Ammonia in Water via Modified Berthelot's Reaction on Porous Paper, Sens. Actuators, B, 2018, 256, 167–175 CrossRef CAS.
- J. J. Peters, M. I. G. S. Almeida, L. O'Connor Šraj, I. D. McKelvie and S. D. Kolev, Development of a Micro-Distillation Microfluidic Paper-Based Analytical Device as a Screening Tool for Total Ammonia Monitoring in Freshwaters, Anal. Chim. Acta, 2019, 1079, 120–128 CrossRef CAS PubMed.
- A. Maity and B. Ghosh, Fast Response Paper Based Visual Color Change Gas Sensor for Efficient Ammonia Detection at Room Temperature, Sci. Rep., 2018, 8(1), 16851 CrossRef PubMed.
- Y. Chen, Y. Zilberman, P. Mostafalu and S. R. Sonkusale, Paper Based Platform for Colorimetric Sensing of Dissolved NH3 and CO2, Biosens. Bioelectron., 2015, 67, 477–484 CrossRef CAS PubMed.
- K. Khachornsakkul, K.-H. Hung, J.-J. Chang, W. Dungchai and C.-H. Chen, A Rapid and Highly Sensitive Paper-Based Colorimetric Device for the on-Site Screening of Ammonia Gas, Analyst, 2021, 146, 2919–2927 RSC.
- H. Wang, L. Yang, S. Chu, B. Liu, Q. Zhang, L. Zou, S. Yu and C. Jiang, Semiquantitative Visual Detection of Lead Ions with a Smartphone via a Colorimetric Paper-Based Analytical Device, Anal. Chem., 2019, 91(14), 9292–9299 CrossRef CAS.
- J. Jongprakobkit, W. Wisaichon and W. Praditweangkum, A Simple and Green Approach for Colorimetric Ammonia Determination by Combining Pervaporation with Paper Impregnated Anthocyanins Extracted from Red Cabbage, Current Applied Science and Technology, 2020, 20(03), 394–407 Search PubMed.
- V. Shukla, G. Kandeepan, M. R. Vishnuraj and A. Soni, Anthocyanins Based Indicator Sensor for Intelligent Packaging Application, Agric. Res., 2016, 5(2), 205–209 CrossRef CAS.
- A. Nafady, A. M. Al-Enizi, A. A. Alothman and S. F. Shaikh, Design and Fabrication of Green and Sustainable Vapochromic Cellulose Fibers Embedded with Natural Anthocyanin for Detection of Toxic Ammonia, Talanta, 2021, 230, 122292 CrossRef CAS.
- W. Sun, Y. Liu, L. Jia, M. D. A. Saldaña, T. Dong, Y. Jin and W. Sun, A Smart Nanofibre Sensor Based on Anthocyanin/Poly-l-Lactic Acid for Mutton Freshness Monitoring, Int. J. Food Sci. Technol., 2021, 56(1), 342–351 CrossRef CAS.
- N. B. Stebbins, Characterization and Mechanisms of Anthocyanin Degradation and Stabilization, Doctor of Philosophy, University of Arkansas, Fayetteville, Arkansas, 2017 Search PubMed.
- N. Prabavathy, S. Shalini, R. Balasundaraprabhu, D. Velauthapillai, S. Prasanna, P. Walke and N. Muthukumarasamy, Effect of Solvents in the Extraction and Stability of Anthocyanin from the Petals of Caesalpinia Pulcherrima for Natural Dye Sensitized Solar Cell Applications, J. Mater. Sci.: Mater. Electron., 2017, 28(13), 9882–9892 CrossRef CAS.
- R. B. Baird, C. E. W. Rice and A. D. Eaton, Standard Methods for the Examination of Water and Wastewater, Water Environment Federation, American Public Health Association, American Water Works Association, 23rd edn, 2017 Search PubMed.
Footnote |
| † Electronic supplementary information (ESI) available: Additional information regarding reagent preparation, UV-Vis spectra of anthocyanin extracts, photos of Black-B and Blue-B anthocyanin sensors, photos of sensors in the presence of different bases used for alkalinization. See DOI: 10.1039/d1ra04069c |
| This journal is © The Royal Society of Chemistry 2021 |

