DOI:
10.1039/D1RA04049A
(Paper)
RSC Adv., 2021,
11, 27443-27452
The treatment of real dyeing wastewater by the electro-Fenton process using drinking water treatment sludge as a catalyst
Received
24th May 2021
, Accepted 6th August 2021
First published on 13th August 2021
Abstract
This study aims to evaluate the performance of the electro-Fenton process (EFP) using drinking water treatment sludge (DWTS) for the treatment of dyeing wastewater. Effects of operating parameters including pH, electrode distance, applied voltage, operation temperature and time on the electro-Fenton-oxidation of dyeing wastewater were investigated. The decolorization and COD degradation efficiencies of 97.8% and 89.8%, respectively, were achieved indicating almost complete mineralization of organic pollutants after 90 minutes of reaction at pH 4.0, dosage of DWTS of 2.0 g, applied voltage of 20.0 V, electrode distance of 3.0 cm and ambient temperature. The morphology of the sludge and presence of Fe(OH)3 after Fenton-oxidation were investigated to understand the mechanisms involved. The degradation of COD in EFP was found to fit well the pseudo-first-order kinetic model. The thermodynamic constants of the Fenton oxidation process were also determined and showed that the Fenton-oxidation process was spontaneous and endothermic. This study provides an efficient and low-cost method for the degradation of non-biodegradable pollutants in dyeing wastewater to solve waste using waste.
1 Introduction
Dye wastewater is negatively affecting the environment not only as a result of several man-made activities such as textile dyeing, but also due to disposal of dangerous by-products into the rivers.1 Coloured waters are regarded as hazardous substances due to their toxic and permanent properties in the environment2 that create huge challenges to the removal of such contaminants by using conventional technologies.
Drinking water treatment sludge (DWTS) is a waste by-product from water treatment plants where rich iron salts are the most commonly employed coagulants.3 Pollutants in DWTS such as heavy metals are soluble at low pH conditions.4 However, DWTS is normally generated in waste and discharged directly into rivers or dumped in landfills after dewatering.3 Direct discharge of DWTS from a water treatment plant (WTP) is harmful to the environment and human health. In order to solve this environmental issue, the recovery and utilization of DWTS has been investigated in several studies such as applications in building material development, removal of phosphorus and reduction of waste disposal.5,6
The electrochemical Fenton process (EFP) has been realized as an efficient approach for the degradation of organic pollutants and proves to be more effective than conventional Fenton's reactions. Therefore, it appears as a good solution for dyeing wastewater.7 In EFP, electrochemically hydrogen peroxide (H2O2) is generated on the cathode; then, ferrous ions are added externally into the system to yield OH˙ radicals for Fenton reactions. However, one of the main drawback of EFP is the operating cost, particularly chemical cost, in practical scale.8 In order to reduce the cost, it has been improved to utilize sustainable alternative sources such as sludge to minimize the use of chemical sources in order to meet the demand of continuous supplement of ferrous ion to the treatment system or utilization of laterite soils to catalyze in EFP.9 Hence, there has been a great research interest on the minimization of chemical costs in EFP for practical dye wastewater treatment.
Recently, the combination of electrochemical peroxidation (ECP) and electro-Fenton (EF) by using anaerobic sludge has been developed by Vargas et al., (2019).8 Such a system proved as one promising system to remove COD and TOC. However, the system used by adding H2O2 as chemical external and ferrous ions releasing from Fe electrodes. It means that the system may enhance the chemical costs and operation costs as well. Then, oxygen in cathode could affect anaerobic sludge in system, resulting negatively in EF performance and settling sludge abilities. Therefore, an EFP employing solid waste, which has been limited to report, could be a solution in terms of decreasing the chemical cost in practice and improving the degradation of organic pollutants.
To the best of our knowledge, there have been few studies on the application of EFP using drinking water treatment sludge (DWTS), which is generated as a by-product from water treatment plants. In addition, the utilization of this sludge waste for EFP will solve waste by waste with highly environmental significance as a great amount of DWTS was discharged every year. It has been reported that about 100![[thin space (1/6-em)]](https://www.rsc.org/images/entities/char_2009.gif) 000 tons of DWTS is discharged per year during the processing of raw water to drinking purposes for a typical water treatment plant.10 In this context, in this study, we mainly focused on: (i) investigating the possibility of treatment of EFP in dyeing wastewater by using DWTS; (ii) determining kinetics and thermodynamics in EFP; (iii) understanding characteristics of DWTS. The obtained results show that this process can offer a promising, cost effective and the efficiency for dyeing wastewater treatment.
000 tons of DWTS is discharged per year during the processing of raw water to drinking purposes for a typical water treatment plant.10 In this context, in this study, we mainly focused on: (i) investigating the possibility of treatment of EFP in dyeing wastewater by using DWTS; (ii) determining kinetics and thermodynamics in EFP; (iii) understanding characteristics of DWTS. The obtained results show that this process can offer a promising, cost effective and the efficiency for dyeing wastewater treatment.
2 Materials and methods
2.1. Characterization of DWTS and wastewater
Drinking water treatment sludge was collected at sedimentation tank from Saigon Underground Water Company Limited, Vietnam. The collected sludge was immediately transferred to the lab and stored in refrigerator at 4 °C for 24 h prior to use. After 24 h of gravity sedimentation, the concentrated sludge was used as raw sludge. The sludge is then dried at 103–105 °C for 2–4 hours. The characteristics of raw sludge was given in Table 1.
Table 1 The characteristics of raw sludge
| MgO (%) |
Al2O3 (%) |
SiO2 (%) |
K2O (%) |
CaO (%) |
MnO2 (%) |
Fe2O3 (%) |
SrO (%) |
Sb2O3 (%) |
BaO (%) |
| 4.02 |
0.57 |
11.51 |
0.28 |
57.83 |
0.90 |
24.50 |
0.08 |
0.05 |
0.26 |
2.2. Experimental reactors
The dyeing wastewater samples were collected from a textile plant from Thanh Cong Textile Company, which located at Ho Chi Minh in Vietnam and then stored in a refrigerator 4 °C. The measured characteristics of wastewater were as follows: pH 6.0–9.0, COD 400–600 mg L−1, and color 1300–3500 Pt–Co. The graphite cathode and anode were stripped from either 1 N NaOH or 1 N H2SO4 solutions for cleaning, were then flushed with deionized water prior to conducting experiments (Fig. 1).
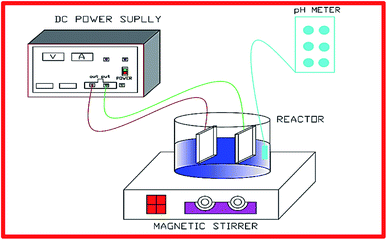 |
| | Fig. 1 A schematic diagram of DWTS treatment by EFP. | |
2.3. Analytical methods and procedures
COD and color were measured following the Standard Method-Section 5210D and 2120C, respectively. Ferrous iron concentration was determined using 1,10-phenanthroline method (Standard Method-Section 3500 B) and ferric iron concentration was calculated by the differences between the total and ferrous iron concentrations (APHA 1998).11 Powder X-ray diffraction patterns (XRD) of all samples were measured by a D2 Phaser Bruker (Germany) diffractometer using Cu Kα radiation at a 2θ range of 5° to 80° with a scan speed of 5 s min−1. X-ray fluorescence analyses of sample were performed using an energy dispersive X-ray fluorescence system (S2 PUMA Bruker, Germany) using a voltage of 15–50 kV and a probe current of 2 mA. Sludge parameter was analyzed by settling volume ratio at 30 min (sludge volume index – SVI30) according to Standard Methods (APHA 1998).11 All the experiments and analytical determinations were conducted in duplicates and the obtained results are the mean values. In the kinetics study, the parameters were achieved by using the Origin 8.1 software, based on the pseudo first- and second-order equations.
The removal efficiency (RE) of decolorization and COD degradation was calculated using eqn (1):
| |
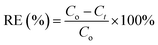 | (1) |
where
Co and
Ct are the initial concentration and the concentration after treatment time
t.
Energy consumption (kW h per kg COD) was calculated using eqn (2):12
| |
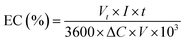 | (2) |
where EC is energy consumption (kW h per kg COD),
Vt is the average cell voltage (
Vt),
I is the applied current (A),
t is the electrolysis time (s), Δ
C is the difference in COD in mg L
−1 and
V is the volume (L).
Instantaneous current efficiency (ICE) (%) values were calculated from eqn (3):13
| |
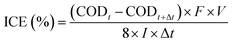 | (3) |
where
F is the Faraday constant (96
485.3 C mol
−1),
V is volume (L),
I is the applied current (A),
t is the electrolysis time (s) and COD (mg O
2 per L) at times
t and
t + Δ
t.
3 Results and discussion
3.1. Effect of initial pH
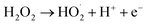
pH is not only a significant impact for the electro-Fenton efficiency, but also a vital parameter for the electro-generation of H2O2.14 The effects of different initial pH ranging from 2.0 to 7.0 were investigated under a current density of 10 mA cm−2 and DWTS dosage of 1.0 g. As illustrated in Fig. 2, slight increases in removal efficiencies (both color and COD) were observed when increasing pH from 2.0 to 4.0. Further increasing pH to 5.0 caused a more severe decrease in the treatment efficiencies then followed by a decrease in pH more than 5.0. Many researchers confirmed that the Fenton reaction was occurred mainly in an acid solution in the pH range of 2.0–4.0.15–17 In good agreement with previous reports, this study the best treatment efficiency was obtained at pH 4.0 with 91.3% and 71.9% of color and COD degradation, respectively. This pH range may be the best condition for OH˙ production because the co-action of hydrogen peroxide and ferrous(II) ion, the conversion of Fe2+ and Fe3+ to Fe(OH)n-type structures can lead to the decolorization and COD degradation tendency. In addition, the decrease in H+ concentration is insufficient for the H2O2 reduction reaction at high pH (pH > 5.0).| | |
O2 + 2H+ + 2e− → H2O2
| (4) |
| | |
Fe2+ + H2O2 → Fe3+ + OH− + OH˙
| (5) |
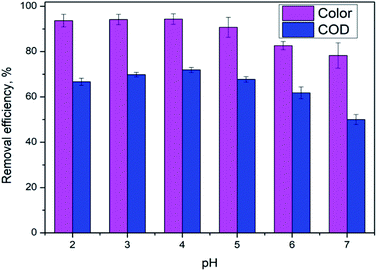 |
| | Fig. 2 Effect of pH value on color and COD removal efficiency of DWTS at J = 10.0 mA cm−2, t = 60 min, d = 4.0 cm; mDWTS = 1.0 g and T = 25 °C. The error bars represent standard deviation. | |
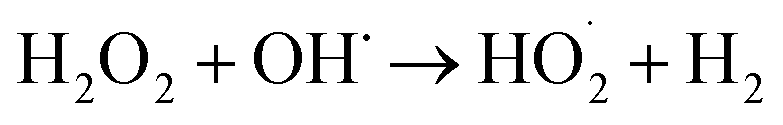
An increase in pH causes the deactivation of the catalytic Fe2+ ions due to its conversion to Fe3+, which reduces the ability to catalyze the reactions thus diminishing the production of OH˙ and EFP performance eqn (5).18
| | |
H2O2 + H+ → H3O2+ (pH < 3)
| (6) |
In acidic solution is theoretically advantageous for the production of H2O2 in eqn (4). However, at pH below 3.0, H2O2 is assumed to remain stable to the formation of oxonium ion (H3O2+) (eqn (6)), leading to enhanced peroxide stability and decreased reactivity of Fe2+ ion.19 Notably, in strong acidic solution (pH < 2.0) iron species form stable complexes with H2O2.17 In addition, in low pH environment, the Fenton reaction has been reported to be deactivated due to the production of complex species such as [Fe(H2O)6]2+, [Fe(OH)(H2O)5]2+.12 Therefore, pH 4.0 appears as the optimum condition for EFP.
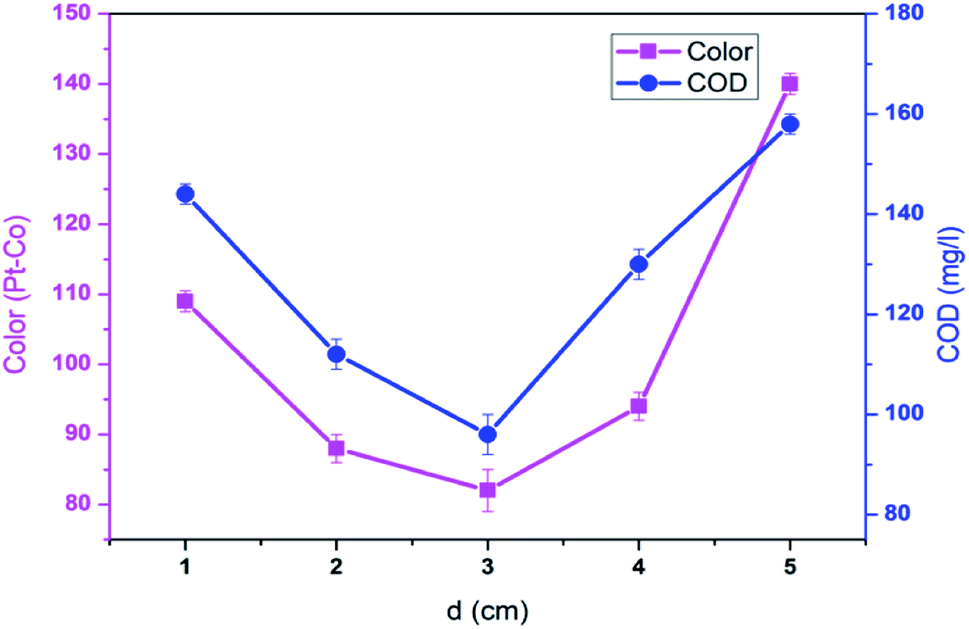
3.2. Effect of inter-electrode distance
To further investigate effect of inter-electrode distance (ED) on the decolorization and COD degradation in EFP, a series of experiments were conducted with ED varying from 1.0 cm to 5.0 cm. As shown in Fig. 3, the highest decolorization and COD degradation efficiencies (96.3% and 83.3%, respectively) were achieved at an inter-electrode distance of 3.0 cm under the current density of 10 mA cm−2 and pH 4.0. Meanwhile, either a shorter (<3.0 cm) or longer electrode distance (>3.0 cm) offered lower treatment performance. This is due to the fact that the Fe2+ concentration in the solution decreased as a result of easy oxidation of newly generation of Fe2+ to Fe3+ (eqn (7)), thus reducing the Fenton reaction that produces OH˙ in case of shorter inter-electrode distances.20
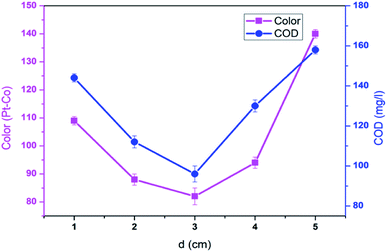 |
| | Fig. 3 Effect of inter-electrode distance on decolorization and COD degradation at J = 10.0 mA cm−2, t = 60 min, mDWTS = 1.0 g, pH = 4.0 and T = 25 °C. The error bars represent standard deviation. | |
On the other hand, an increase of inter-electrode distance to 4.0 cm and 5.0 cm resulted in a higher resistance and a lower current density flow. It can be explained that a longer distance between electrodes contributed to the limited transfer of Fe3+ ion to the cathode surface.21 Particularly, the amount of Fe2+ in case of longer distance electrodes could be limited to react fully with H2O2 thus resulting in less OH˙ available and inhibiting the catalyst regeneration and EFP efficiency.
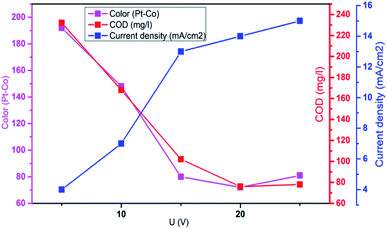
3.3. Effect of applied voltage
Aplied voltage is a fundamental parameter which influences the performance of EFP by controlling the rate of EF reactions. To further investigate effect of applied voltage on the decolorization and COD degradation in EFP, a series of experiments with the different applied voltage were performed in the presence of Fe2+ from DWTS as catalyst. As illustrated in Fig. 4, EFP performance was observed from 15.0 V to 25.0 V, that is equivalent to current density (J) from 13.0 mA cm−2 to 15.0 mA cm−2. The best values of decolorization and COD degradation efficiencies at 20.0 V were achieved at 96.8% and 86.8%, respectively. It can be seen that the higher applied voltage, equivalent to the much higher current density, leads to an increase in the amount of Fe2+ ions thus accelerating the H2O2 formation rate (eqn (4)) and promotes the greater production of OH˙ radicals (eqn (5)). According to Faraday's formula, the release of Fe2+ from the anode depends crucially on the higher current density,22 thus such a higher applied voltage can support more complete degradation of organic pollutants via reactions with OH˙ radicals.
 |
| | Fig. 4 Influence of applied voltage on the decolorization and COD degradation in electro-Fenton treatment. Conditions: d = 3.0 cm; t = 60 min; mDWTS = 1.0 g; pH = 4.0 and T = 25 °C. | |
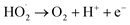
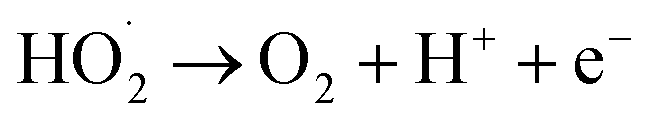
However, it should be mentioned that highest applied voltage of 25.0 V (15.0 mA cm−2) provided the lower treatment efficiency due to the oxidation of H2O2 (eqn (8)–(14))23 and/or consumption of hydroxyl radicals by Fe2+ ions (eqn (15) and (16))19 according to the following reactions:
| |
 | (8) |
| |
 | (9) |
| |
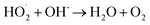 | (10) |
| | |
OH˙ → O2 + 2H+ + 2e−
| (11) |
| | |
H2O2 + 2H+ + 2e− → 2H2O
| (13) |
| |
 | (14) |
| | |
Fe2+ + OH˙ → Fe3+ + HO−
| (15) |
| |
 | (16) |
Furthermore, an increase in the applied voltage contributes to more heat generation and requires greater energy consumption9 and, as a result, more electricity was wasted when the applied voltage exceeds 20.0 V. Therefore, the optimal applied voltage for decolorization and COD degradation is suggested to be 20.0 V (current density of 14.0 mA cm−2) due to the benefits of enhanced degradation rate, less removal time and the saving of energy consumption.
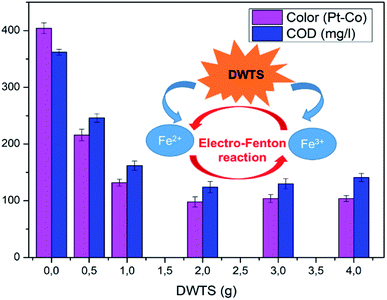
3.4. Effect of DWTS dosage
The effect of DWTS dosage on EFP performance was investigated as shown in Fig. 5. The decolorization and COD degradation efficiency without the presence of DWTS in the solution was relatively poor (19.0% and 9.0%, respectively) whereas they were markedly increased from 57% to 95.0% by externally adding an amount of ferrous ions from DWTS in range of 0.5–4.0 g. This indicates that the Fe2+ ions from DWTS may react with hydrogen peroxide to produce hydroxyl free radicals at the cathode (eqn (5)), resulting in enhanced decolorization and COD degradation efficiency. On the contrary, in the absence of ferrous ions, the production of hydrogen peroxide at the cathode is not strong enough to destroy large molecules like dye compounds.
 |
| | Fig. 5 Influence of the dosage of DWTS on the decolorization and COD degradation in electro-Fenton treatment. Operating conditions: d = 3.0 cm; U = 20.0 V; t = 60 min; pH = 4.0 and T = 25 °C. The error bars represent the standard deviations. | |
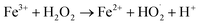
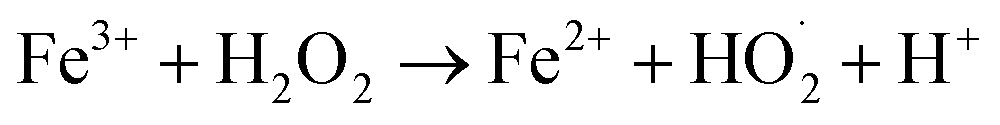
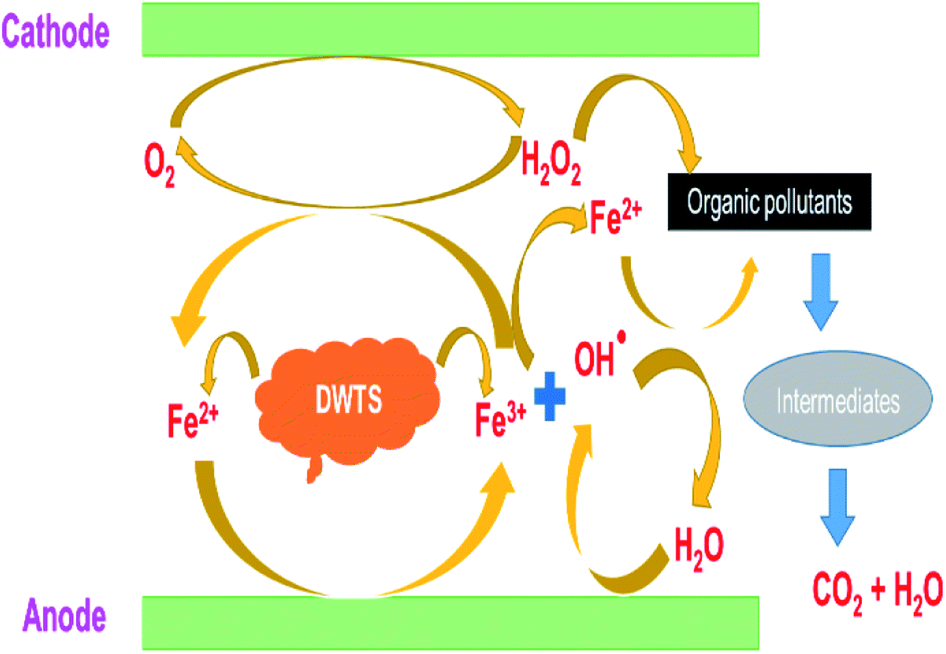
The amount of Fe2+ ions provided from a DWTS dosage of 2.0 g was found to be optimal for the Fenton reaction as evidenced by high decolorization and COD degradation efficiency of 95.0% and 78.0%, respectively (Fig. 6). The initial ferrous irons concentration in DWTS dosage from 0.5 g to 4 g were in range of 3.06–24.5 mM. For underdose of DWTS of 2 g, the percentage distribution of Fe2+ declined from 55% to 10% whereas Fe3+ increased from 45% to 90%, which indicates the conversion from Fe2+ to Fe3+ by Fenton reactions in eqn (5) (Fig. 7). In addition, Fe3+ ions released from DWTS in acid solution might react with H2O2 molecules to regenerate Fe2+ ions, which then possibly participated in further reactions with H2O2 to form OH˙ radicals in eqn (16). Hence, significant enhancement in treatment efficiency was obtained. With a catalyst amount higher than 2.0 g is equivalent to the concentration of ferrous ions at [Fe2+] > 12 mM, that is a decline in the treatment performance was observed. This study was in good agreement with the previous study that higher amount of Fe2+ ions may negative affect on EFP performance when concentration of ferrous ions exceeds 20 mM.24 However, when there were excessive Fe3+ ions alongside the cathode surface, the production of hydrogen peroxide was likely reduced (eqn (16)). This result is much consistent with the findings of Wang et al., (2010)17 showing that a redundant amount of Fe3+ negatively affected the electro-Fenton reactions. As an advantage over the conventional Fenton process, EFP involves continuously-produced ferrous ions, which are originally generated and/or re-generated from Fe3+ ions in DWTS, thus offering remarkable enhancement in the treatment performance.
 |
| | Fig. 6 Schematic presentation of EFP reactions by using DWTS. | |
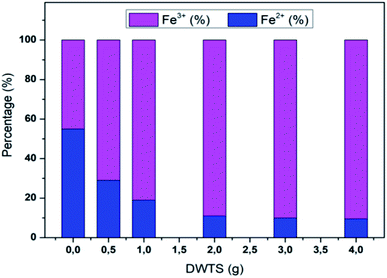 |
| | Fig. 7 Percentage distribution of Fe2+/Fe3+ ions before and after EFP reactions by using DWTS. | |
3.5. Effect of temperature and operating time
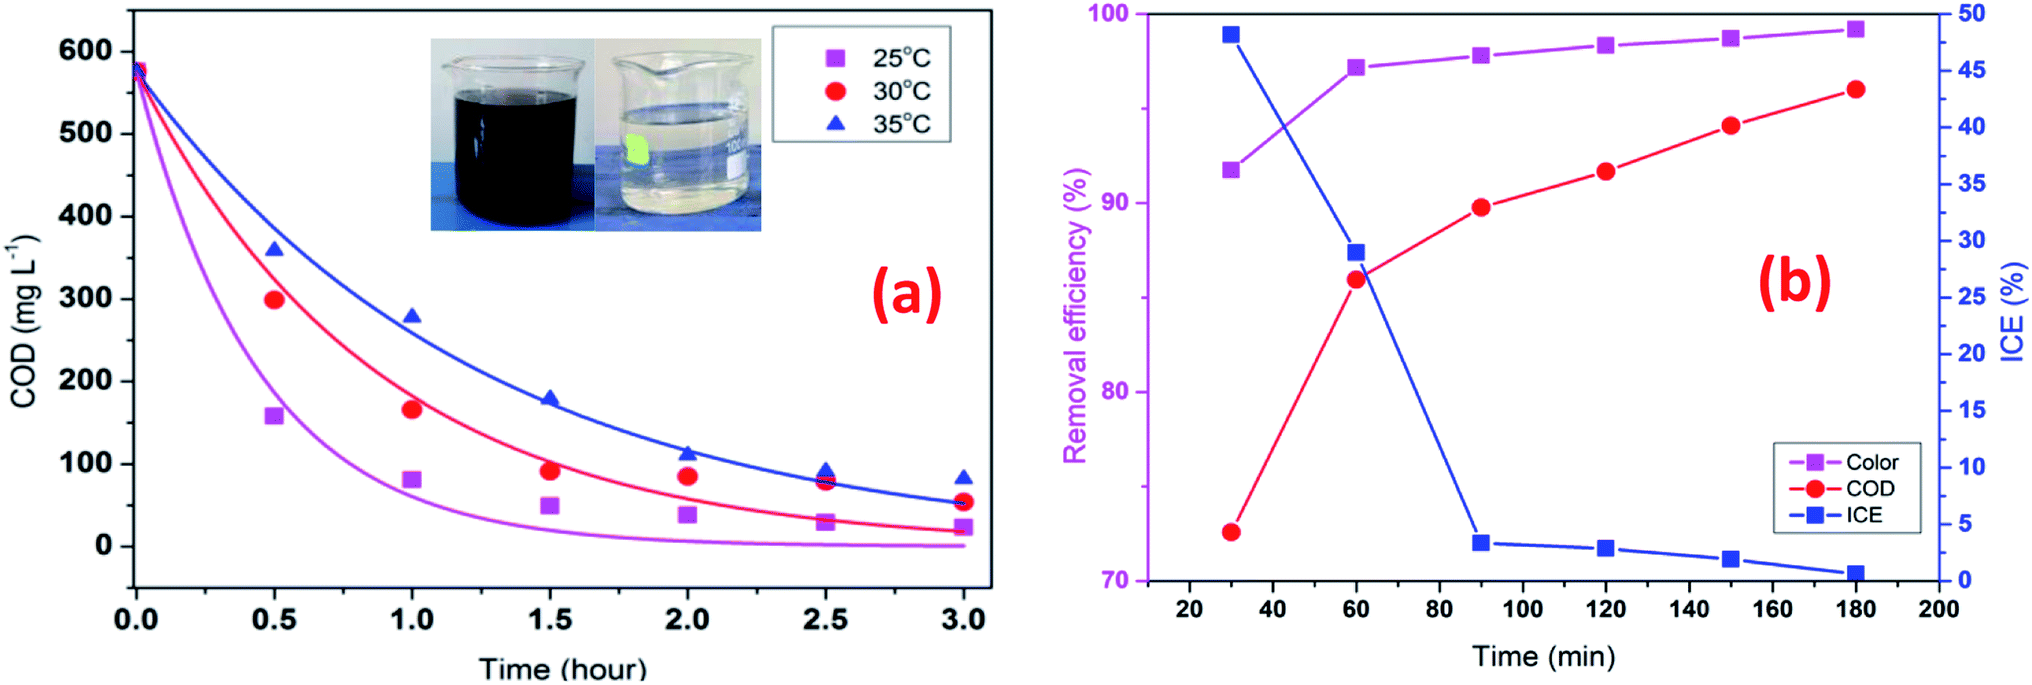
To investigate the effect of temperature in the EFP, the experiments were conducted at three temperatures from 25 °C to 35 °C. As indicated in Fig. 8a, increasing temperature caused a negative effect on the COD degradation. Particularly, the COD removal efficiency decreased from 91.4% to 68.9% as the temperature increased from 25 °C to 35 °C after 90 min of reaction. Interestingly, a rise of 10 °C (from 25 to 35 °C) resulted in a more than 3-fold decrease in the treatment efficiency. This can be attributed to the less electro-generation of hydrogen peroxide due to decreased solubility of oxygen in water at high temperature.25 As a result, less hydroxyl free radicals or less-valence iron species were available for the decomposition reactions. These results were also in good agreement with the study of Wang et al. as the COD removal was found to decline as the temperature rose from 20 °C to 40 °C.17 In addition, at higher temperature seems to be exothermic reactions, which exceeds activation of reactive energy of molecules.26
 |
| | Fig. 8 Effect of temperature (a) on COD degradation; operating time (b) on decolorization and COD degradation efficiency at J = 14 mA cm−2, t = 60 min, mDWTS = 2.0 g, and pH = 4.0. Symbols are experimental data. The curve (a) presents the corresponding kinetics analysis assuming a pseudo first-order reaction. | |
In contrast, Giwa et al., (2020)27 reported that the degradation efficiency of methylene blue (MB) was enhanced by increasing temperature from 25 °C to 45 °C. There are conflicting to our results as concentration of H2O2 of their studies might significantly excess to supply in process with ferrous ions for EFP, resulting decomposition of H2O2 at higher temperatures (eqn (5)). In this study, it is likely that an enough formation of H2O2 such an internal resource from oxygen in solutions was convenient for EFP at high temperatures (eqn (4)). Moreover, 25 °C was suggested to be the optimal temperature for Fenton reactions according to several studies.24,28,29 Therefore, at 25 °C of temperature has been employed in EFP with good performance.
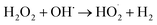
The effect of operating time is given in Fig. 8b which shows that decolorization and COD degradation efficiency increased with increasing time. The highest decolorization and COD degradation efficiency of 97.8% and 89.8% were achieved after 90 min. The decolorization and COD degradation recorded after 120 min did not change considerably with respect to those at 90 min likely due to the more transformation of H2O2 into H2O and O2 (eqn (17) and (18)) as time increased, thus slowing down the rate of EFP as following reactions:30
| |
 | (18) |
Instantaneous current efficiency (ICE) of decolorization and COD degradation is illustrated in Fig. 8b. It is clear that ICE decreased dramatically in 30 min and almost unchanged until 90 min. The early rapid degradation of organic compounds can be attributed to the reactions between hydroxyl radicals and pollutants, then the reaction rate decreased when the pollutant concentration reduced and more intermediate products are generated. Chu et al., (2012)31 also observed that the mineralization of organic matters was fast in the first reactions time, then slowly oxidation of organic intermediates at longer electrolysis times. In addition, a decrease in ICE at the beginning also implied that the initial high dosage of DTWS would release a significant amount of Fe2+ ions to facilitate the mineralization process. Hence, the lower concentration of DWTS, the lower decolorization and COD degradation were achieved. However, the previous study by Rahmani et al., (2015)13 showed that ICE tent to increase at the early stage and then decreased steadly. This can be explained by the different characteristics of organic compounds in the bio-refractory wastewater and dye wastewater. The bio-refractory wastewater has a majority of biodegradable organic matters (BOD/COD = 0.5–0.67) while dye wastewater has organic compounds which are more difficult to biodegrade (BOD/COD < 0.5).32,33
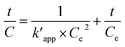
3.6. COD degradation kinetics
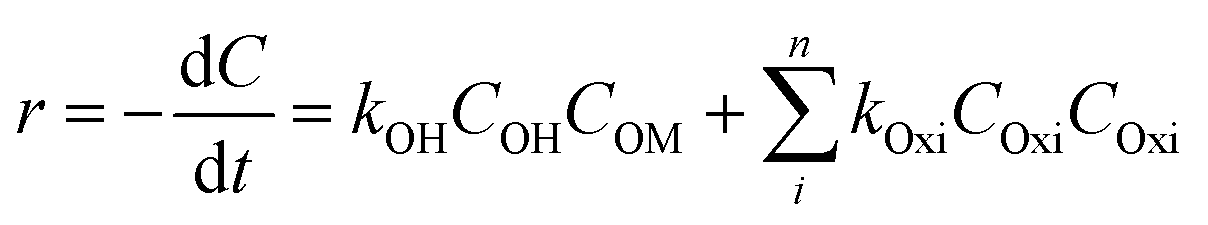
The oxidation rate of organic molecule (OM) by the HO˙ radicals in EFP can be exhibited as follows:34| |
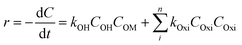 | (19) |
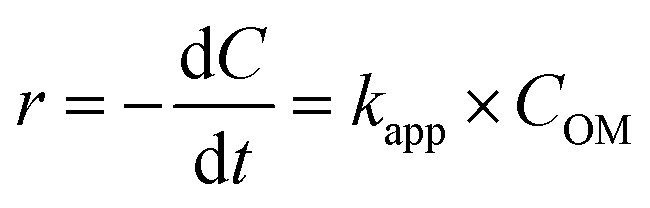
where Oxi represents oxidants other than OH˙ such as (hydroperoxyl radical HOO˙, superoxide (O2−), etc.). It can be re-written based on the apparent rate constant kapp which includes the concentration of OH˙ as:34| |
 | (20) |
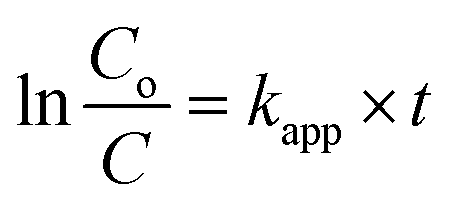
By integration, the pseudo-first order rate equation can be obtained:
| |
 | (21) |
where
C and
Co are the initial COD and the COD measured at time
t,
kapp (=
k[˙OH]) is the apparent pseudo-first-order rate constant.
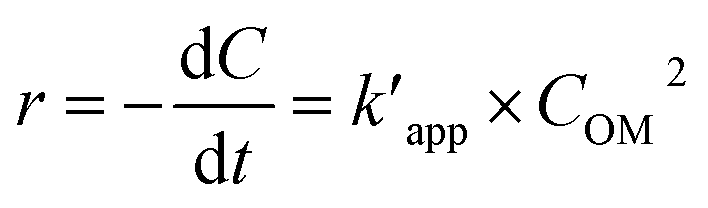
The pseudo-second order rate equation is given as follows (eqn (22)):
| |
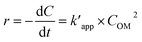 | (22) |
By integrating the eqn (22), the linear pseudo second order model can be achieved as eqn (23):
| |
 | (23) |
where
Ce is the equilibrium concentration of COD degration,

is the apparent pseudo-second-order rate constant. The pseudo second order rate constant was achieved from the plot of
t/
C versus t. Values of
kapp and

can be obtained from the plots of ln
(
Co/
C) against
t and
t/
C against
t, respectively.
The kinetics data of COD degradation under different temperatures are given in Table 2. Reaction kinetics at different temperature was plotted according to pseudo-first and second-order models as can be seen in Fig. 9. It was found that the data fitted well with the pseudo first-order kinetic model (R2 > 0.92) rather than the second-order kinetics (R2 > 0.89). Thus, it means that decomposition of organic compounds as in EFP would be achieved as pseudo-first-order kinetics. In addition, Table 2 indicates the obtained values of kapp,  and half-life times, t1/2 from pseudo-first- and pseudo-second-order kinetics. The negative rate constant derived from the pseudo second order kinetic model indicated that this model was not suitable to describe the experimental data as the value of rate constant is always positive.27 The pseudo-first-order rate constants were inversely proportional to an increase of temperature due to the decomposition of hydrogen peroxide at higher temperature (Table 2). Particularly, the rate constant decreased by a factor of 1.6 with increasing temperature from 25 °C to 35 °C. It is worth noting that the rate of COD degradation is influenced by the production rate of hydroxyl radicals which in turn depend on the amount of hydrogen peroxide. Herein, the kinetic study showed that the first order kinetic model is more appropriate for the description of COD degradation in the used treatment system. This result is quite similar to those reported by the previous studies.27,35,36
Table 2 Kinetic rate constant (kapp) and half-life times (t1/2) of COD degradation in EFP
| T (°C) |
Pseudo-first-order model |
Pseudo-second-order model |
| kapp (min−1) |
t1/2 (min) |
R2 |

(min−1) |
t1/2 (min) |
R2 |
| 25 |
0.0194 |
36.0938 |
0.9855 |
−1.6611 |
21.5506 |
0.9659 |
| 30 |
0.0144 |
48.1251 |
0.9229 |
−0.8592 |
41.8659 |
0.8951 |
| 35 |
0.0121 |
57.2727 |
0.9771 |
−0.5889 |
61.8206 |
0.9499 |
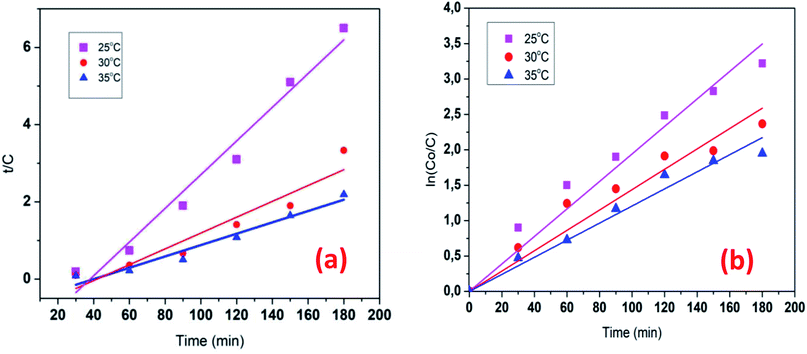 |
| | Fig. 9 Reaction kinetics plot for differential temperature: pseudo first-order (a) pseudo-second-order (b) model for the COD degradation. Conditions: V = 500 mL, J = 14.0 mA cm−2, t = 90 min, mDWTS = 2.0 g, and pH = 4.0. The symbol are the experimental data. The curve (a) presents the corresponding kinetics analysis assuming a pseudo first-order reaction, the curve (b) presents pseudo second-order reaction. | |
3.7. Thermodynamic for COD degradation
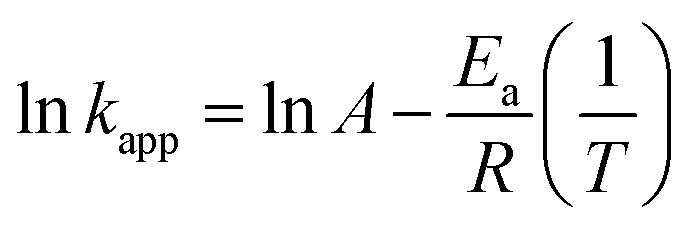
To investigate the temperature (298, 303, and 308 K) effect on COD degradation, thermodynamic parameters was assessed. Gibbs free energy ΔG° is calculated using equilibrium constant kapp as the following eqn (24):
The Fenton oxidation is found by using the Arrhenius (eqn (25)):
| |
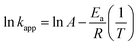 | (25) |
Standard enthalpy ΔH° and standard entropy ΔS° are obtained according to van't Hoff equation (eqn (26)):
| |
 | (26) |
where
kapp is the apparent rate constant for COD degradation,
Ea is the activation energy,
R is the ideal gas constant (8.314 J mol
−1 K
−1), and
T is the reaction absolute temperature.
kapp value is calculated from the following equation (eqn (27)):34
| |
 | (27) |
where
CAe is amount of COD degradation at equilibrium and
CSe is equilibrium concentration of COD degradation.
The activation energy (Ea) of the EFP was calculated from the slope of the Arrhenius plot in Ea to be −36.1 kJ mol−1. This value proved that meaning that the reaction slows down with increasing temperature. ΔH° and ΔS° were calculated as the slope and intercept of van't Hoff plots of lnkapp versus 1/T (Fig. 10). Linear relationship between the plot of lnkapp and 1/T was best fitted with R2 > 0.98. The Gibbs free energy ΔG°, standard enthalpy ΔH°, standard entropy ΔS° and thermodynamic parameters for COD degradation are shown in Table 3. The negative value of ΔG° indicates that COD degradation process was spontaneous in EFP. The negative value of activation enthalpy (ΔH°) was obtained (−36 kJ mol−1) showing that the oxidative reaction is exothermic27,37 and the degree of spontaneity of oxidation reaction decreased with increasing temperature.
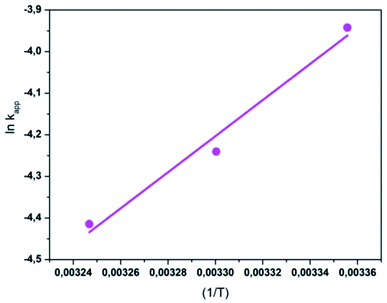 |
| | Fig. 10 The plot of lnkapp and (1/T) for the degradation of COD. | |
Table 3 Thermodynamic parameters for COD degradation in EFP
| T (K) |
ΔG° (kJ mol−1) |
lnkapp |
ΔH° (kJ mol−1) |
ΔS° (J mol−1 K−1) |
| 298 |
−80.958 |
−3.9425 |
−36.0719 |
153.9814 |
| 303 |
−82.728 |
−4.2405 |
| 308 |
−83.498 |
−4.4145 |
3.8. Characterization of DWTS
XRD analysis was performed for DWTS before and after electro-Fention reaction. As shown in Fig. 11, the diffraction peaks of magnetite (Fe3O4) and maghemite (γ-Fe2O3) were observed in all samples,38–42 indicating that these crystal substances were formed on DWTS. Interestingly, an obvious appearance of diffraction peaks of Fe(OH)3 crystals was observed in DWTS sample after EFP, revealing that the Fe(OH)3 could be generated in electro-Fenton process, which is corresponded with the reaction in eqn (28)–(32).
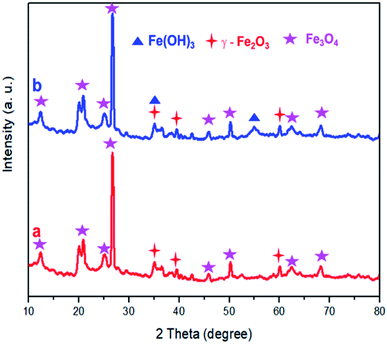 |
| | Fig. 11 XRD pattern of DWTS before (a) and after (b) electro-Fenton reaction. | |
To verify the changes of morphology after treatment process, the SEM images of DWTS were shown in Fig. 12. SEM images of DWTS indicated no significant changes in the surface morphology except for the precipitation Fe(OH)3 into porous structures after electro-Fenton reactions (Fig. 12a–c) much likely as a result of (eqn (31) and (32)). TEM images revealed the presence of the amorphous ferrihydrite matrix (Fig. 12d). It seems likely that the darker and denser aggregates are visible in the ferrihydrite matrix in DWTS. This finding is were in good agreement with Macera et al., (2020)41 reports.
| | |
Fe3+ + OH− ↔ Fe(OH)2+
| (28) |
| | |
Fe(OH)2+ + OH− ↔ Fe(OH)2+
| (29) |
| | |
Fe(OH)2+ + OH− ↔ Fe(OH)3
| (30) |
| | |
Fe(OH)3 + Fe(OH)3 ↔ precip
| (31) |
| | |
Fe(OH)3 + precip ↔ precip
| (32) |
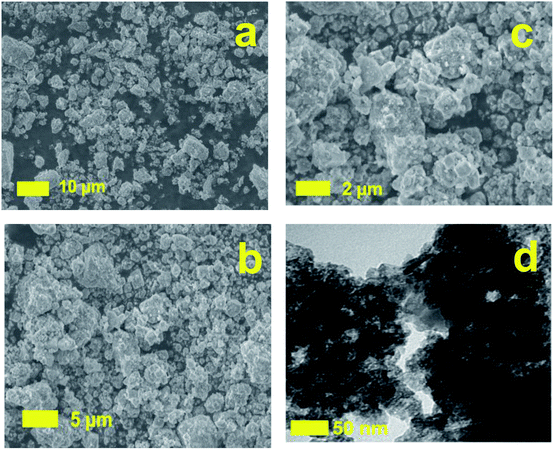 |
| | Fig. 12 Scanning electron microscopy microphotographs of DWTS before (a), after (b, c) reaction and TEM (d) images of DWTS electro-Fenton reaction. | |
SVI is one of the fundamental parameter to evaluate the settling properties of sludge. SVI value from the EFP was determined 22.0 mL g−1 in optimum condition at pH 4.0, current density 14.0 mA cm−2, dosage of DWTS 2.0 g. Tchobanoglous et al., (2003)43 reported that SVI value below 100.0 mL g−1 is considered as the high settling sludge. This might be attributed to the formation of Fe(OH)3, as explained above, that helps improve the sedimentation characteristics of sludge. This result is also in good agreement in many studies stating that SVI value for the electro-Fenton was lower than 100.0 mL g−1.24,28,29,44
3.9. Cost evaluation and perspectives
The operating cost of EFP can be calculated, including chemical cost, energy cost, sludge management and other costs, e.g. anode consumption, etc. In case of 14.0 mA cm−2, the energy cost of DWTS for dyeing wastewater in this study was about $0.15 m−3 ($3.1 kg−1 COD), which are calculated from Vietnam electricity price of $0.12 kW h−1. For optimum conditions of current density (14.0 mA cm−2) and operating time, EEC of obtained DWTS was calculated at 37.5 kW h per ton. Hence, chemical cost was estimated to be 0.68 L−1 as chemical prices are H2SO4 (98% w/w) at $2.6 kg−1, NaOH at $3.5 kg−1 for pH adjustment. Remarkably, the EFP in this work is no addition H2O2 and FeSO4·nH2O, which are used as an external to compare with previous studies.13,17,21,24 It is already known that majority cost of electro-Fenton is chemical cost and here we showed that the premises are applicable to treat dye wastewater as using DWTS in EFP. Specifically, Vargas et al., (2019)8 reported that the majority of operating cost in electro-Fenton reactions represent at 64%, then energy cost (29%), sludge management (6%) and others.
The use of no additional chemicals in this study except for pH adjustment chemicals is of great significance in reducing actual operating costs. In addition, the percentage of chemical costs that account for the majority of wastewater treatment costs makes the application of this technology more practical due to the significant savings cost. Moreover, the use of FeSO4·nH2O as a supplements makes the higher production of sludge because of more precipitation of Fe(OH)3.20 It means that the application of EFP using DWTS not only reduces the cost of sludge treatment or management but also contributes to the environmentally green solutions in case of reusing sludge sources. Therefore, it has been demonstrated that DWTS has been shown excellent potential capacity to improve removal of contaminants form wastewater as a practical dye wastewater treatment.
4 Conclusions
This study developed a new way to generate a low cost catalyst to enhance the removal of contaminants in dye wastewater. Herein, the performance of EFP was investigated using a DWTS to generate complex Fe2+/Fe3+ catalyst. The results of EFP under different experimental conditions demonstrated that the optimal parameters for EFP are mDWTS = 2.0 g, V = 20.0 V, J = 14 mA cm−2, d = 3.0 cm, pH 4.0 and at 25 °C of temperature. The decolorization and COD degradation were obtained at 97.8% and 89.8%, respectively. The pseudo-first-order kinetic model was found to best fitted with the experimental data. The negative value of ΔG° and positive value of ΔH° obtained indicated that the oxidation of dye contaminants by EFP was spontaneous and endothermic. The results showed that Fe(OH)3 crystals was achieved in DWTS sample and no significant changes in the surface morphology after EFP. Notably, the cost evaluation indicated that the practical application of this technology is highly potential. The findings of this research shows that the EFP with DWTS is a fully promising, efficient and low-cost method for the treatment of contaminants, especially in dying wastewater, and can be extensively implemented for other polluted waters in practice.
Conflicts of interest
The authors declare that they have no known competing financial interests or personal relationships that could have appeared to influence the work reported in this paper.
Acknowledgements
This work has been sponsored and funded by Ho Chi Minh City University of Food Industry under Contract No. 146/HĐ-DCT.
References
- C. Galindo, P. Jacques and A. Kalt, J. Photochem. Photobiol., A, 2001, 141, 47–56 CrossRef CAS.
- N. H. Ince, M. I. Stefan and J. R. Bolton, J. Adv. Oxid. Technol., 1997, 2, 442–448 CAS.
- K.-W. Jung, M.-J. Hwang, D.-S. Park and K.-H. Ahn, J. Environ. Manage., 2016, 181, 425–434 CrossRef CAS PubMed.
- J. Keeley, P. Jarvis and S. Judd, Desalination, 2012, 287, 132–137 CrossRef CAS.
- Q. Hou, P. Meng, H. Pei, W. Hu and Y. Chen, Mater. Lett., 2018, 229, 31–35 CrossRef CAS.
- A. Hidalgo, M. Murcia, M. Gomez, E. Gomez, C. Garcia-Izquierdo and C. Solano, J. Environ. Eng., 2017, 143, 04016088 CrossRef.
- J. Peralta-Hernández, Y. Meas-Vong, F. J. Rodríguez, T. W. Chapman, M. I. Maldonado and L. A. Godínez, Water Res., 2006, 40, 1754–1762 CrossRef PubMed.
- H. Olvera-Vargas, X. Zheng, O. Garcia-Rodriguez and O. Lefebvre, Water Res., 2019, 154, 277–286 CrossRef CAS PubMed.
- S. O. Ganiyu, E. C. T. de Araújo Costa, C. A. Martínez-Huitle and E. V. dos Santos, Sep. Purif. Technol., 2020, 243, 116776 CrossRef.
- T. Ahmad, K. Ahmad and M. Alam, Procedia Environ. Sci., 2016, 35, 950–955 CrossRef CAS.
- A. Apha, Standard Methods for the Examination of Water & Wastewater, American Public Health Association, American Water Works Association, and Water Environment Federation, 2007 Search PubMed.
- C. A. Basha, P. Soloman, M. Velan, L. R. Miranda, N. Balasubramanian and R. Siva, J. Hazard. Mater., 2010, 176, 154–164 CrossRef PubMed.
- A. R. Rahmani, D. Nematollahi, G. Azarian, K. Godini and Z. Berizi, Korean J. Chem. Eng., 2015, 32, 1570–1577 CrossRef CAS.
- E. Brillas, I. Sirés and M. A. Oturan, Chem. Rev., 2009, 109, 6570–6631 CrossRef CAS PubMed.
- F. Guenfoud, M. Mokhtari and H. Akrout, Diamond Relat. Mater., 2014, 46, 8–14 CrossRef CAS.
- B. Hameed and T. Lee, J. Hazard. Mater., 2009, 164, 468–472 CrossRef CAS PubMed.
- C.-T. Wang, W.-L. Chou, M.-H. Chung and Y.-M. Kuo, Desalination, 2010, 253, 129–134 CrossRef CAS.
- J. J. Pignatello, E. Oliveros and A. MacKay, Crit. Rev. Environ. Sci. Technol., 2006, 36, 1–84 CrossRef CAS.
- A. Babuponnusami and K. Muthukumar, Chem. Eng. J., 2012, 183, 1–9 CrossRef CAS.
- H. He and Z. Zhou, Crit. Rev. Environ. Sci. Technol., 2017, 47, 2100–2131 CrossRef CAS.
- C. Zhang, L. Zhou, J. Yang, X. Yu, Y. Jiang and M. Zhou, Environ. Sci. Pollut. Res., 2014, 21, 8398–8405 CrossRef CAS PubMed.
- N. Daneshvar, A. Oladegaragoze and N. Djafarzadeh, J. Hazard. Mater., 2006, 129, 116–122 CrossRef CAS PubMed.
- A. L. Estrada, Y.-Y. Li and A. Wang, J. Hazard. Mater., 2012, 227, 41–48 CrossRef PubMed.
- C.-T. Wang, J.-L. Hu, W.-L. Chou and Y.-M. Kuo, J. Hazard. Mater., 2008, 152, 601–606 CrossRef CAS PubMed.
- P. A. Vesilind and T. B. Ramsey, Waste Manage. Res., 1996, 14, 189–196 CrossRef.
- H.-y. Xu, M. Prasad and Y. Liu, J. Hazard. Mater., 2009, 165, 1186–1192 CrossRef CAS PubMed.
- A.-R. A. Giwa, I. A. Bello, A. B. Olabintan, O. S. Bello and T. A. Saleh, Heliyon, 2020, 6, e04454 CrossRef PubMed.
- A. M. Guedes, L. M. Madeira, R. A. Boaventura and C. A. Costa, Water Res., 2003, 37, 3061–3069 CrossRef CAS PubMed.
- J. H. Ramirez, C. A. Costa and L. M. Madeira, Catal. Today, 2005, 107, 68–76 CrossRef.
- Y. Deng and J. D. Englehardt, Water Res., 2006, 40, 3683–3694 CrossRef CAS PubMed.
- Y. Chu, Y. Qian, W. Wang and X. Deng, J. Hazard. Mater., 2012, 199, 179–185 CrossRef PubMed.
- M. Luan, G. Jing, Y. Piao, D. Liu and L. Jin, Arabian J. Chem., 2017, 10, S769–S776 CrossRef CAS.
- D. Yaseen and M. Scholz, Int. J. Environ. Sci. Technol., 2019, 16, 1193–1226 CrossRef CAS.
- S. Hashemian, J. Chem., 2013, 2013, 7 Search PubMed.
- I. Arslan and I. A. Balcioglu, J. Chem. Technol. Biotechnol., 2001, 76, 53–60 CrossRef CAS.
- Z. Abou-Gamra, Adv. Chem. Eng. Sci., 2014, 4, 285–291 CrossRef CAS.
- M. B. Brahim, R. Abdelhédi and Y. Samet, Desalin. Water Treat., 2014, 52, 6784–6791 CrossRef.
- A. Ruíz-Baltazar, R. Esparza, G. Rosas and R. Pérez, J. Nanomater., 2015, 2015, 8 Search PubMed.
- H. Miao, J. Li, Y. Lin, X. Liu, Q. Zhang and J. Fu, Chin. Sci. Bull., 2011, 56, 2383–2388 CrossRef CAS.
- V. Silva, P. Andrade, M. Silva, L. D. L. S. Valladares and J. A. Aguiar, J. Magn. Magn. Mater., 2013, 343, 138–143 CrossRef CAS.
- L. Macera, G. Taglieri, V. Daniele, M. Passacantando and F. D'Orazio, Nanomaterials, 2020, 10, 323 CrossRef CAS PubMed.
- K. Tian, X.-X. Wang, Z.-Y. Yu, H.-Y. Li and X. Guo, ACS Appl. Mater. Interfaces, 2017, 9, 29669–29676 CrossRef CAS PubMed.
- G. Tchobanoglous, F. L. Burton and H. D. Stensel, Wastewater Engineering: Treatment and Reuse, McGrawHill, International Edition, 2003, vol. 4, pp. 361–411 Search PubMed.
- M. Teymori, H. Khorsandi, A. A. Aghapour, S. J. Jafari and R. Maleki, Appl. Water Sci., 2020, 10, 1–14 CrossRef.
|
| This journal is © The Royal Society of Chemistry 2021 |
Click here to see how this site uses Cookies. View our privacy policy here. 
 Open Access Article
 This Open Access Article is licensed under a Creative Commons Attribution-Non Commercial 3.0 Unported Licence
 ,
Huy Hoang Phan Quang
,
Huy Hoang Phan Quang


 is the apparent pseudo-second-order rate constant. The pseudo second order rate constant was achieved from the plot of t/C versus t. Values of kapp and
  can be obtained from the plots of ln
 and half-life times, t1/2 from pseudo-first- and pseudo-second-order kinetics. The negative rate constant derived from the pseudo second order kinetic model indicated that this model was not suitable to describe the experimental data as the value of rate constant is always positive.27 The pseudo-first-order rate constants were inversely proportional to an increase of temperature due to the decomposition of hydrogen peroxide at higher temperature (Table 2). Particularly, the rate constant decreased by a factor of 1.6 with increasing temperature from 25 °C to 35 °C. It is worth noting that the rate of COD degradation is influenced by the production rate of hydroxyl radicals which in turn depend on the amount of hydrogen peroxide. Herein, the kinetic study showed that the first order kinetic model is more appropriate for the description of COD degradation in the used treatment system. This result is quite similar to those reported by the previous studies.27,35,36