 Open Access Article
Performance demonstration of gas-assisted gravity drainage in a heterogeneous reservoir using a 3D scaled model
Debin Kong *ab,
Peiqing Lianc,
Rongchen Zhengc and
Yiqiang Lib
aSchool of Civil and Resource Engineering, University of Science and Technology Beijing, Beijing 100083, China. E-mail: kongdb@ustb.edu.cn
bState Key Laboratory of Petroleum Resources and Prospecting, China University of Petroleum, Beijing 102249, China
cSINOPEC Petroleum Exploration and Production Research Institute, Beijing 100083, China
First published on 15th September 2021
Abstract
Gas-assisted gravity drainage (GAGD) is an effective method for oil recovery. Gravity increases the stability of the Gas–Oil Contact (GOC), thus delaying gas breakthrough and promoting crude oil production. Studying the effects of fluid and reservoir parameters on the stability of GOC could help understand the mechanism of GAGD. In this study, a series of high-pressure GAGD tests were conducted on a 3D heterogeneous scaled model established according to the heterogeneity of the oil reservoir. During the tests, GOC was monitored with electrical resistivity tomography (ERT) to study the effects of gas injection rate, gas type, and gas injection direction on GOC and oil recovery factor (RF). The results showed that N2-GAGD achieved the most stable GOC, the largest sweep volume but a poor RF. CO2-GAGD achieved the best RF of 63.33% at the injection rate of 0.15 m d−1 under 15 MPa. CO2 and CH4 could interact with crude oil and reduce the advancing rate and transverse swept area of GOC. CO2 and CH4 could lead to a higher RF as they reduce the viscosity of crude oil, cause swelling when dissolved, and have low tension. Therefore, the effects of gas dissolution, swelling, and viscosity reduction must be considered in addition to those of gravity, viscous force, and the capillary force so that RF could be increased while ensuring the stability of the displacement front. Accordingly, a new non-dimensional number Nnew was proposed with comprehensive considerations of gravity, viscous force, capillary force, gas–oil viscosity ratio, the viscosity reduction by gas, and reservoir properties. Finally, a prediction model was proposed, which could accurately predict the RF of heterogeneous reservoirs applying GAGD.
1 Introduction
Gas injection is one of the most frequently used approaches in enhanced oil recovery (EOR), which includes continuous gas injection (CGI) and water alternating gas (WAG). Although WAG is firstly proposed to solve gas overlapping, it still defies natural gravity separation. Therefore, gas-assisted gravity drainage (GAGD) has been proposed.1–4 With this method, crestal gas injection is conducted with the vertical well, and a Gas–Oil Contact (GOC) is formed with the density contrast between the injected gas and the oil. The GOC can move down steadily and expand horizontally, and the oil is pushed to the horizontal well above the GOC.5 Theoretical research and field practice has demonstrated that GAGD can inhibit viscous fingering and increase swept volume and ultimate recovery factor.6–9GAGD is influenced by many factors,10–13 including heterogeneity, wettability, and water saturation of the reservoir, fluid property, gas injection rate, and oil recovery factor. Dominant seepage zones or dominant seepage paths frequently occur in the reservoirs with high heterogeneity, leading to early gas breakthrough and sweep efficiency reduction during CGI or WAG. However, during GAGD, the low-permeability region in the heterogeneous reservoir can delay the gas breakthrough, and the high-permeability layer can promote the horizontal diffusion of the gas reservoir and inhibit the downward migration of the gas, improving the ultimate sweep efficiency.14–17 During GAGD, mobile water inhibits the contact between oil and gas, reducing the possibility of oil–water miscibility. Besides, the severe water seepage at the beginning of drainage can reduce the effect of the gas drive. Irreducible water can help to achieve low residual oil saturation.3,18,19 The final liquid production changes slightly at different water saturation. However, higher movable water saturation indicates poorer oil recovery, and movable water can reduce the recovery factor.20,21 Reservoir wettability influences the development mode because the wettability determines the oil–gas–water distribution in porous media and affects seepage characteristics of the fluid during oil displacement. In the oil-wet reservoir, since the crude oil exists as a continuous oil film on the particle surface, injected gas can contact the crude oil effectively, contributing to a higher recovery factor at low-gas phase saturation. However, in the water-wet reservoir, crude oil is dispersed in the pores. Because of the water partition effect, the injected water has to aggregate the dispersed crude oil to form a membrane oil with low flow resistance, inhibiting the formation of membrane flow and leading to a lower recovery factor of GAGD than that of the oil-wet reservoir.22,23 The distribution of fluid directly influences the recovery factor of gas drive, especially GAGD. The distribution and flow form of oil–gas–water in porous media can be described by the spreading coefficient,24 which represents the equilibrium relationship among the interface tension (IFT) of oil, water, and gas. If the spreading coefficient > 0, oil spreads on the water as oil film, and the contact between gas and water is reduced. If the spreading coefficient < 0, the oil spreads on the water as an oil drop or slug, inhibiting the continuous oil film and leading to a low recovery factor. Rao25,26 believed that a positive spreading coefficient could improve the recovery factor of gravity drainage.
GAGD takes full advantage of the gas override to enlarge the swept volume, inhibit the viscous fingering, and delay the gas breakthrough. However, since the oil–gas mobility ratio significantly affects the stability of GOC during gravity drainage, the gas breakthrough is delayed only when gas injection parameters are optimized. An excessively high gas injection rate can lead to GOC fingering and tonguing, unstable GOC migration, early gas breakthrough, low sweep efficiency, and low recovery factor. Besides, although an excessively low rate can contribute to stabilizing the migration of GOC, it increases displacement time and production cost. An appropriate injection rate can help obtain a stable fluid interface, and many scholars have calculated the maximum injection rate under a stable fluid interface. Therefore, it is meaningful to understand the oil displacement mechanism of GAGD by studying the migration law of GOC.
Many scholars have studied the influencing factors of GAGD, and a scaled physical model is frequently used to evaluate the mechanism and potential of GAGD. 1D natural core experiments under high pressure are more common to investigate the main controlling factors of GAGD, including but not limited to wettability, water saturation, fluid property, gas injection rate, etc.4,27–30 2D visual sand pack experiments are more common to investigate the migration law of the GOC of GAGD and the oil displacement mechanism of GAGD.4,20,22,27,31–34 The recovery factor of the 2D sand pack model is above 70–80%. However, as the pore structure of the 2D sank pack model is significantly different from that of the real reservoir, the results cannot be referenced. As the 1D natural core model ignores the vertical heterogeneity of the reservoir, the results cannot be applied. 3D models are rarely used to investigate GAGD. Peng et al.35 established an artificial scaled physical model to compare the applicability of different development modes of the heterogeneous carbonate reservoir under high pressure and high temperature. It is found that the combination of GAGD and water injection is feasible. In this paper, the method of Peng et al. was adopted to conduct heterogenous GAGD experiments under high pressure and high temperature.
Capillary number, bond number, and gravity number were used to describe the fluid flow according to the stress condition of the flowing fluid during GAGD. Having combined these non-dimensional numbers and fitted them with 1D and 2D experiments, many scholars found the relationship between the non-dimensional numbers and recovery factors of GAGD. To solve poor prediction of single-dimensional numbers, Kulkarni5,36,37 proposed the concept of gravity drainage number, which combined gravity number, bond number, and capillary number and concluded the logarithmic relation between recovery factor and gravity drainage number. Considering the influence of oil–gas density contrast, reservoir wettability, contact angle, and oil–gas viscosity ratio on recovery factor, many scholars established new dimensionless numbers to predict the gravity-driven process and recovery factor of gas injection.5,27,36,38,39 Rostami et al.28 defined viscosity coefficient, which can predict the GAGD recovery factor of a thickened oil reservoir with high permeability considering the viscosity reduction and dissolution of gas in crude oil. Chen et al.40 defined the oxidation number at low temperature and accurately predicted the recovery factor of oxygen-reduced-air-assisted gravity drainage considering the influence of oxidation reaction at low temperature. Kong et al.41 described the microscopic seepage mechanism of GAGD with numerical simulation of pore size. They proposed a non-dimensional number considering gravity, viscous force, capillary force, gas–oil viscosity ratio, and pore size. However, these non-dimensional numbers are based on simple experiments or numerical simulations without fully considering factors, such as complex heterogeneity and interactions between oil and gas under high pressure and high temperature.
In this paper, a series of 3D-scaled immiscible GAGD experiments were conducted, and the migration of GOC was monitored with electrical resistivity tomography. The focus was on the effects of gas injection rate, gas injection type, and gas injection direction on GOC and oil recovery. The oil displacement mechanism of heterogeneous reservoir GAGD was clarified through the migration of GOC. The relationship between dimensionless parameters and recovery factor was analyzed, and the prediction model for a GAGD recovery factor of the heterogeneous reservoir was established.
2 Experimental
2.1 Materials
| Ion composition | Na+ | K+ | Mg2+ | Ca2+ | Ba2+ | Cl− | Br− | SO42− | HCO3− | Salinity |
|---|---|---|---|---|---|---|---|---|---|---|
| Concentration mg L−1 | 63![[thin space (1/6-em)]](https://www.rsc.org/images/entities/char_2009.gif) 879 879 |
5203 | 271 | 10![[thin space (1/6-em)]](https://www.rsc.org/images/entities/char_2009.gif) 659 659 |
152 | 123![[thin space (1/6-em)]](https://www.rsc.org/images/entities/char_2009.gif) 036 036 |
545 | 12.8 | 20.0 | 202![[thin space (1/6-em)]](https://www.rsc.org/images/entities/char_2009.gif) 819 819 |
![[thin space (1/6-em)]](https://www.rsc.org/images/entities/char_2009.gif) :
:![[thin space (1/6-em)]](https://www.rsc.org/images/entities/char_2009.gif) 4; ③ N2: the purity was 99.99%. The density and viscosity of experimental gases under 15 MPa were calculated by the Peng–Robinson EOS42 (Table 2).
4; ③ N2: the purity was 99.99%. The density and viscosity of experimental gases under 15 MPa were calculated by the Peng–Robinson EOS42 (Table 2).
| Gas type | CO2 | N2 | Gas mixture |
|---|---|---|---|
| Density ρ, g cm−3 | 0.4762 | 0.14036 | 0.3164 |
| Viscosity μ, mPa s | 0.0374 | 0.0224 | 0.0279 |
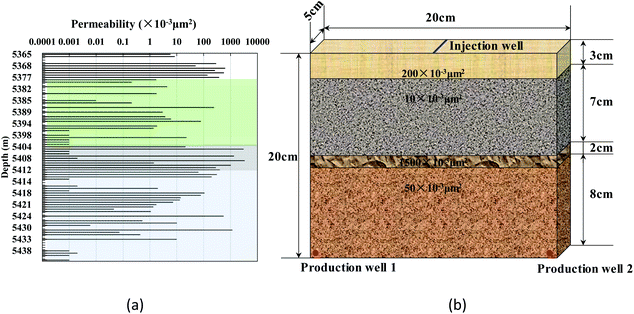 | ||
| Fig. 1 The vertical distribution of permeability (a) and schematic diagram of the 3D -scaled model (b). | ||
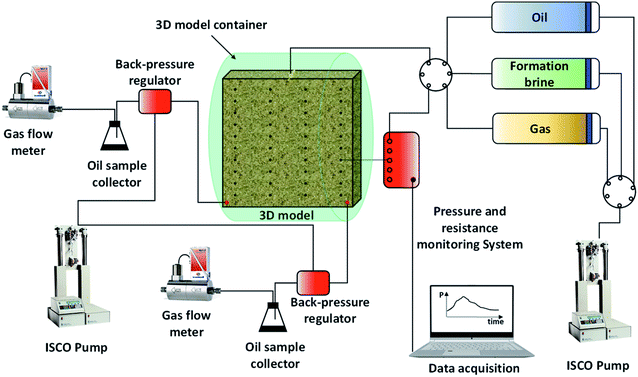
In the model, an injection well was arranged at the top of the model, and two production wells were at the bottom of the model. Nine wells were placed in the center, four angles, and four sides for saturated oil, respectively. Electrodes were evenly distributed on the core to measure the gas front. There were 4 × 10 = 40 electrode pairs with a horizontal distance of 5 cm and a vertical distance of 2 cm between each electrode pair.
2.2 Experiment setup
The experiment setup included a pressure vessel containing the 3D scaled core, a real-time resistivity test system, ISCO constant-rate and constant-pressure pump, an intermediate container, pressure monitoring equipment, controller of the mass and flux of the gas, back pressure device, and oil–gas–water separation device. The flow chart of the experiment is shown in Fig. 2.The experimental procedure was:
(1) An appropriate artificial carbonatite core was chosen for gas measuring permeability, and simulation water was vacuumized and saturated for porosity test.
(2) The core connection is shown in Fig. 2. Permeability was measured by water, and the resistivity at every point was measured at the reservoir temperature of 65.5 °C.
(3) After permeability measurement, simulation oil was saturated at a constant rate until no water outflowed from the core. Then irreducible water was generated, and its saturation was calculated. After that, the resistivity at every point at irreducible water saturation was measured.
(4) The core was matured under the reservoir temperature of 65.5 °C for 24 hours. Then, the gas was injected at a constant injection rate set in the experiment plan, and gas injection was stopped when no oil outflow came from the core. The confining pressure was always 2 MPa higher than the injection pressure during gas injection. The production of oil, water, and gas was recorded while the resistivity was collected until the end of the experiment.
2.3 Experiment design
In this paper, a 3D-scaled model similar to a heterogeneous reservoir was adopted for the study on the influence of gas injection rate, gas type, and gas injection direction on the development efficiency of GAGD. The experimental research focused on the immiscible injection. The experiment plan is shown in Table 3.| The number | Pore volume mL | Oil saturation% | Gas injection rate m d−1 | Gas type | Gas injection direction |
|---|---|---|---|---|---|
| 1 | 516.25 | 66.45 | 0.05 | CO2 | Vertical |
| 2 | 536.41 | 63.49 | 0.15 | CO2 | Vertical |
| 3 | 569.11 | 60.68 | 0.3 | CO2 | Vertical |
| 4 | 558.71 | 61.23 | 0.5 | CO2 | Vertical |
| 5 | 494.80 | 68.74 | 0.15 | N2 | Vertical |
| 6 | 513.82 | 66.90 | 0.15 | Gas mixture | Vertical |
| 7 | 501.57 | 67.76 | 0.15 | CO2 | Horizontal |
| 8 | 533.63 | 63.89 | 0.15 | Gas mixture | Horizontal |
Experiments (1–4) were used to investigate the effects of gas injection rate on GAGD and the injection rates of 0.05, 0.15, 0.3, and 0.5 m d−1, equivalent to the volume flow rate of chosen 0.08, 0.25, 0.48, and 0.80 mL min−1 are chosen. Experiments (2), (5), (6) were used to investigate the effects of gas types of CO2, N2, and gas mixture on GAGD. In experiments (2), (6), (7), (8), CO2 and gas mixture were used to study the effects of gas injection direction on GAGD.
3 Results and discussion
3.1 The influence law of gas injection rate
| Gas injection rate m d−1 | 0.05 | 0.15 | 0.3 | 0.5 |
|---|---|---|---|---|
| Gas breakthrough time, PV | 0.271 | 0.229 | 0.210 | 0.185 |
| Recovery factor at gas breakthrough, % | 36.55 | 33.73 | 31.31 | 25.85 |
| Ultimate recovery factor, % | 60.68 | 63.33 | 61.40 | 58.07 |
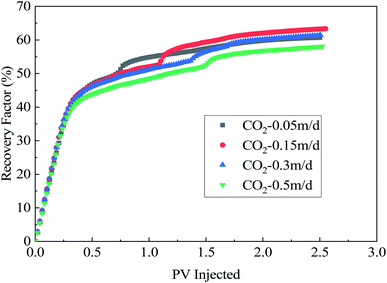
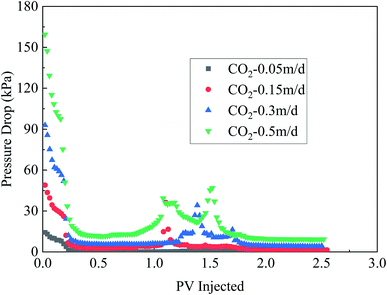
As shown in Fig. 4, at the beginning of gas injection, the pressure is the highest, and gas injection pressure and injection rate increase proportionately. At the later stage of injection, the correlation between injection pressure and injection rate is poor. When the gas injection rate is 0.05 m d−1, the highest pressure is 14.4 kPa, and the lowest pressure is close to zero. When the gas injection rate is 0.5 m d−1, the highest pressure is 159.5 kPa, and the lowest pressure is 9.3 kPa. The time for peak value of gas injection pressure is related to the recovery factor due to the heterogeneity of the model. When the gas breaks through, the front of GOC does not completely spread to the low-permeability regions of 10 mD and 50 mD, and there is still a large amount of remaining oil. With the increase of the gas injection rate, the remaining oil in the 10 mD and 50 mD regions is recovered by gravity, which can be reflected from the existence of two plateaus of the recovery curve in Fig. 5.
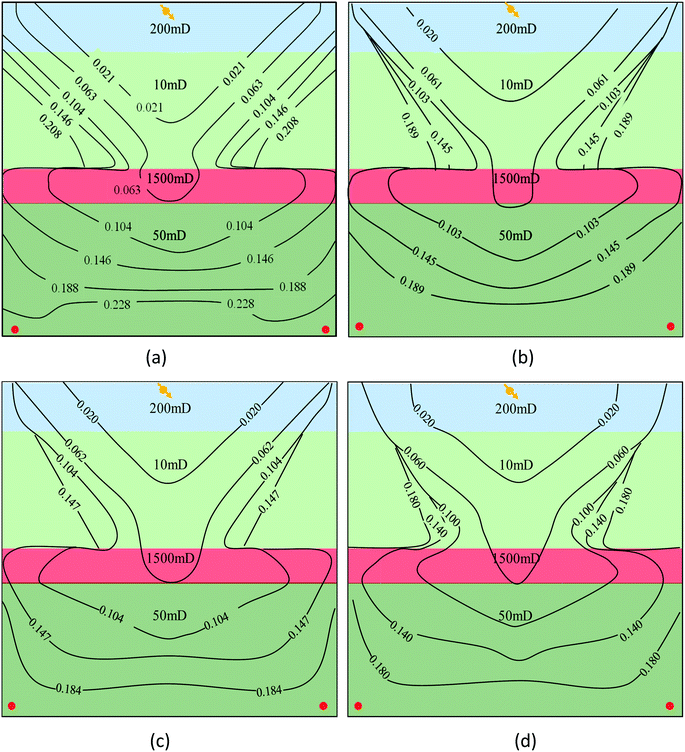 | ||
| Fig. 5 Changing law of GOC before gas breakthrough at different GAS injection rates. (a) 0.05 m d−1, (b) 0.15 m d−1, (c) 0.3 m d−1 and (d) 0.5 m d−1. | ||
According to Fig. 4, at the gas injection rate of 0.05 m d−1, the gas injection pressure is extremely low, and the average differential pressure is 2 kPa. Gravity plays a leading role during the displacement, driving crude oil to improve the recovery factor against the capillary force and the viscous force that is small at this time. With the increase of the gas injection rate, viscous force increases, so higher gas differential pressure is needed to make gravity drive crude oil against the capillary force and viscous force. At the gas injection rate of 0.05 m d−1, gravity delays gas breakthrough, the displacing front is stable, and the swept area is relatively large. When the injection rate is higher than 0.15 m d−1, displacement pressure increases significantly, with the viscous force playing a leading role. An early gas breakthrough can make the displacing front unstable and the recovery factor is low. The recovery factor at the gas injection rate of 0.15 m d−1 is the highest as the displacement is controlled by gravity, viscous force, and capillary force.
Therefore, during GAGD, proper capillary force, viscous force, and gravity can ensure the stability of the displacing front and improve the recovery factor of crude oil most significantly. An excessively high injection rate can increase viscous force, decrease sweep efficiency, thus degrading the development efficiency.
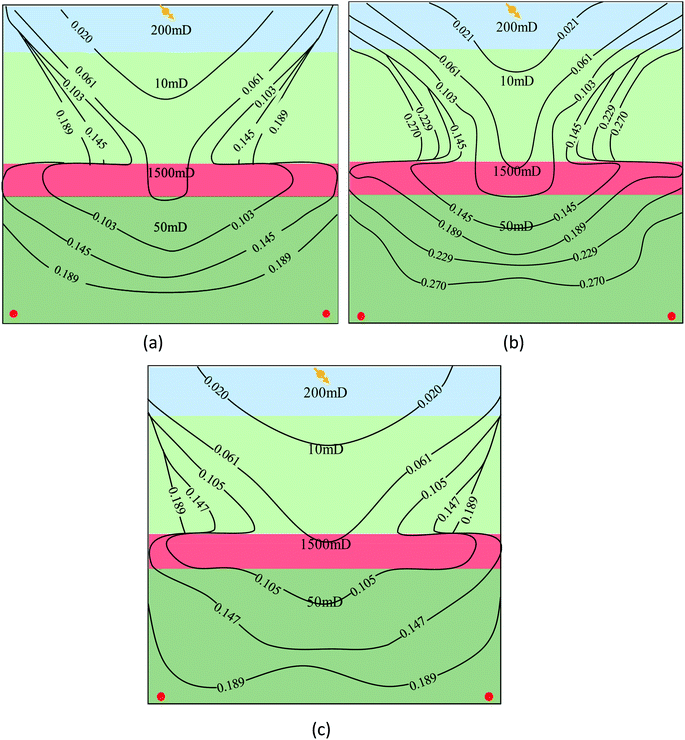
Fig. 5 indicates that a higher gas injection rate means a higher advancing rate of GOC. At the gas injection rate of 0.05 m d−1, GOC advances almost parallelly, and the gas has migrated from the 200 mD layer to the 10 mD layer at 0.021 PV. At the 10 mD layer, the angle between GOC and the horizontal plane is 30°, and GOC advances to 1500 mD. The unswept area of gas occurs at the 10 mD layer. The high-permeability layer promotes the diffusion of gas, and then the gas migrates to two wells evenly. With the increase of gas injection rate, the migration law of GOC is similar to that at 0.05 m d−1, except that the angle between GOC and the horizontal plane increases at the 10 mD layer. The largest angles under the gas injection rate of 0.15 m d−1, 0.3 m d−1, and 0.5 m d−1 are 45°, 75°, and 80°, respectively. Before the gas breakthrough, the unswept areas of the 200 mD layer and 10 mD layer expand with the increase of the gas injection rate. The time when GOC migrated to the production wells is the same as that for the gas breakthrough.
3.2 The influence law of gas type
| Gas type | CO2 | N2 | Gas mixture |
|---|---|---|---|
| Gas breakthrough time, PV | 0.229 | 0.208 | 0.292 |
| Recovery factor at gas breakthrough, % | 33.73 | 29.36 | 47.53 |
| Ultimate recovery factor, % | 63.33 | 36.62 | 63.27 |
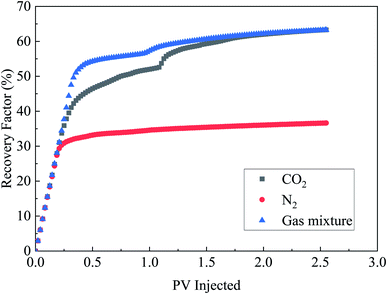
The oil recovery factor of different gas types is related to the change of the physical property of crude oil in the reservoir under high pressure. The IFT between CO2 and crude oil is lower than that between the gas mixture and crude oil and that between N2 and crude oil. Under the same conditions, CO2 can reduce the viscosity and density of crude oil, increasing the bulk coefficient of crude oil most significantly compared to gas mixture and N2. Viscosity reduction, swelling, and low tension make CO2 have the best oil recovery factor, so does the gas mixture with a high proportion of CO2. The recovery factor of the N2-GAGD is lower than that of the CO2-GAGD at the same injection rate of 0.15 m d−1, indicating that viscosity reduction, dissolution, swelling, and low tension of CO2 can effectively improve the recovery factor after gas breakthrough.
Although the density of N2 is the smallest, the solubility of N2 in crude oil is the lowest. The gas mixture with high solubility and small density can achieve the significant effect of gravity drainage with the latest gas breakthrough time. CO2 with high solubility and density is earlier in gas breakthrough than gas mixture but later than N2. These results are opposite to the calculated critical gas injection rate mainly because solubility, viscosity reduction, and gas swelling in crude oil is not considered in the theoretical calculation.
3.3 The influence law of gas injection direction
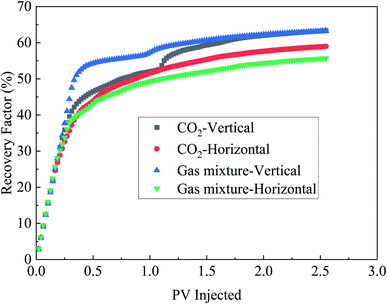
Recovery factors of different gas types in horizontal and vertical drive at the gas injection rate of 0.15 m d−1 are shown in Fig. 8. The model is laid flat, and then CO2 and gas mixture are injected. The recovery factors of horizontal CO2 and gas mixture-GAGD are 4.35% and 8.26% lower than those obtained in the vertical drive. In the horizontal drive, the recovery factor curve had a second step, and GAGD occurs after the gas breakthrough. Unswept crude oil in the pore or circumfluent residual oil slowly advances to the production well in the state of membrane flow. The second step during the vertical drive is exactly why the residual oil in the 10 mD permeability layer slowly advances to the production well in the state of membrane flow.
Table 6 shows that gas breakthrough time in the horizontal drive is earlier than that in the vertical drive. The recovery factor difference between horizontal and vertical gas mixture-GAGD is larger than that between horizontal and vertical CO2-GAGD. At the gas injection rate of 0.15 m d−1, the densities of CO2 and gas mixture are 0.4762 g cm−3 and 0.3164 g cm−3, respectively. Thus, it is shown that the differentiation effect of gravity is more significant under gas mixture-assisted drive, the stable displacing front is more easily achieved in horizontal CO2-GAGD, and the recovery factor difference between horizontal and vertical CO2-GAGD is small. Under high pressure (60 MPa), the density of CO2 is close to 1 g cm−3, a little higher than that of crude oil in the reservoir, and the recovery factor of CO2-assisted horizontal drive may be slightly higher than that of the vertical drive.43
| Gas type | CO2 | Gas mixture | ||
|---|---|---|---|---|
| Gas injection direction | Vertical | Horizontal | Vertical | Horizontal |
| Gas breakthrough time, PV | 0.229 | 0.208 | 0.292 | 0.189 |
| Recovery factor at gas breakthrough, % | 33.73 | 28.86 | 47.53 | 28.12 |
| Ultimate recovery factor, % | 63.33 | 58.98 | 63.27 | 55.69 |
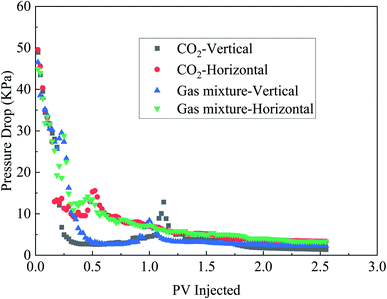
As shown in Fig. 9, at the beginning of gas injection, differential pressures are high, the displacement direction has little influence on differential pressure, and gravity plays a major role in the capillary force. After the gas breakthrough, the pressure decreases, and the differential pressure of the horizontal drive is a little higher than that of the vertical drive. The effect of gravity is significant, and GAGD contributes to the decrease of displacement differential pressure. In vertical displacement, the pressure increases twice between 1.05 PV and 1.25 PV, which is the same time when the second step occurs in the recovery factor curve. The pressure increases are mainly attributed to the slow advance to the production well residual oil in the 10 mD-permeability layers in the state of membrane flow.
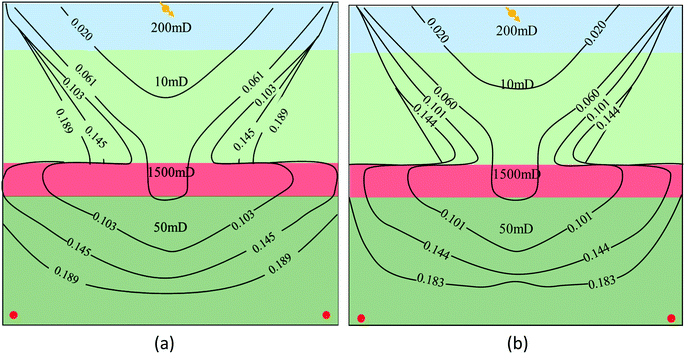 | ||
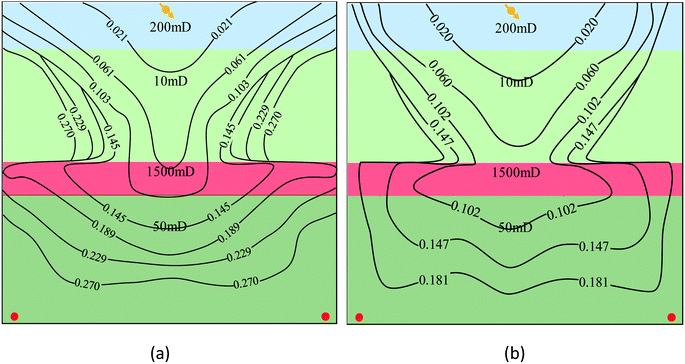
| Fig. 10 Migration characteristics of GOC with different injection directions during CO2-GAGD before the gas breakthrough. (a) Vertical CO2-GAGD and (b) horizontal CO2-GAGD. | ||
As shown in Fig. 11, the migration law of GOC during horizontal and vertical gas mixture-GAGD is the same. The migration rate of GOC during horizontal gas mixture-GAGD is a little higher than that during vertical gas mixture-GAGD. The swept area of the 10 mD-permeability layer during horizontal gas mixture-GAGD is slightly higher than that during vertical gas mixture-GAGD. The densities of CO2, gas mixture, and crude oil are 0.4762 g cm−3, 0.3164 g cm−3, and 0.9172 g cm−3, respectively. During gas mixture-GAGD, the effect of gravity drainage is more significant than that of CO2-GAGD. Therefore, the difference between vertical and horizontal gas mixture-GAGD is larger than that between vertical and horizontal CO2-GAGD.
3.4 The relationship between the non-dimensional number of GAGD and the oil recovery factor
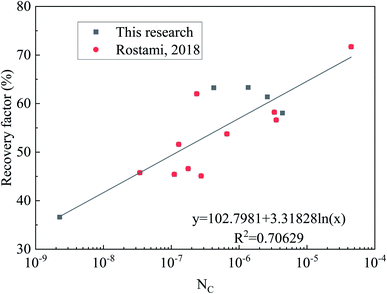
The capillary number indicates the relative magnitude of the viscous force and capillary force.44 The bond number represents the relative magnitude of gravity and capillary force. Therefore, the effects of viscous force, capillary force, and gravity on the gas drive can be analyzed by capillary number and bond number.28,39,44–49 Capillary number and bond number (the permeability under heterogeneous conditions is the thickness-weighted average permeability) in each experiment plan have been calculated. Due to the small number of groups in this research, the research results of Rostami et al.28 were included in the analysis of the relationship between the non-dimensional number and oil recovery factor. The results are shown in Fig. 12 and 13.As shown in Fig. 12, the recovery factor is positively related to the capillary number, indicating that a smaller capillary force means a higher oil recovery factor because crude oil trapped in small pores by capillary force is easier to be utilized. However, in this research, at the high gas injection rate, the capillary number increases, but the recovery factor degrades because the effect of gravity cannot be ignored during GAGD.
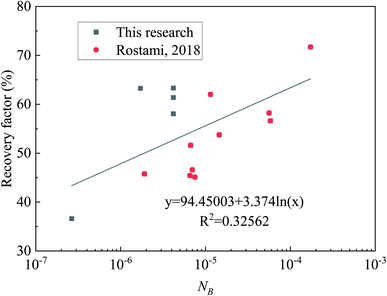
According to Fig. 13, a larger bond number contributes to a higher recovery factor during GAGD, and a high recovery factor can be achieved when gravity plays a leading role. However, the correlation between the recovery factor and gravity is poor. When the bond number is small during GAGD, the flow of oil and gas in porous media is dominated by viscous force, and the gas fingering caused by a higher injection rate is easy to occur.50,51 When the bond number is large, the flow of oil and gas in the porous medium is dominated by gravity. The remaining oil flows as a film under gravity41 with a hydraulic connection that can help overcome the capillary force in the low-permeability region and ensure the stability of the interface, a higher swept volume, and a higher recovery factor.
Based on the literature review, many methods can predicate the recovery factor with the non-dimensional number of GAGD. In 2018, Rostami et al.28 firstly proposed that the influence of the dissolution, swelling, and viscosity reduction of gas in crude oil should be considered when predicting the recovery factor of GAGD.
 | (1) |
Rostami et al.28 accurately predicated the non-dimensional number Ndis = NGμRatio2 of the recovery factor of GAGD in the high-permeability thickened oil reservoir when fitting α1 = 2 and α2 = 1 based on experimental results.
Where  is the gravity number, representing the relationship between gravity and viscous force. Rostami believed that the capillary force in high-permeability reservoirs is small and can be ignored. Therefore, the non-dimensional number obtained by fitting did not consider capillary force.
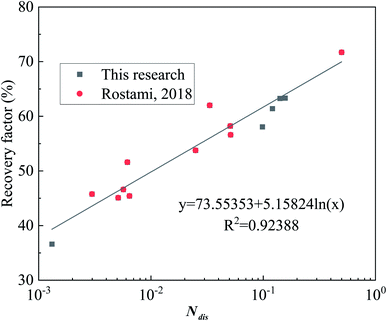
The large-scale 3D physical model adopted in this paper is a heterogeneous model with a permeability between 10 mD and 1500 mD with an average permeability of 200 mD. Therefore, the effect of capillary force cannot be ignored. According to formula (1), coefficients of association α1 = 2 and α2 = 0.4 are obtained, as shown in formula (2). In terms of Fig. 14, the coefficient of association of non-dimensional number and recovery factor obtained by fitting is only 0.92388, much lower than those of previous studies.
 | (2) |
Rostami28 chose six groups with the diameter of 2.54 cm and the length of 60 cm, two groups with the diameter of 2.54 cm and the length of 30 cm, and two groups with the diameter of 10.16 cm and the length of 50 cm of the natural core for fitting non-dimensional number. In the research, a large-scale 3D heterogeneous physical model of 20 cm × 20 cm × 5 cm was adopted. The recovery factor is influenced by the size and physical property of the mode, which should be considered when establishing the non-dimensional number. Based on the definition of the non-dimensional number of pore size, a new non-dimensional number Nnew considering the influence of gravity number, bond number, the physical property of the reservoir, thickness of the oil layer, gas–oil viscosity ratio, and viscosity reduction of the gas is proposed, as shown in formula (3).
 | (3) |
 is gas–oil viscosity ratio; H is the thickness of the oil layer; K and ϕ are the average permeability and porosity; α1, α2, and α3 are the contribution of capillary force, viscous force, gas–oil viscosity ratio, and viscosity coefficient to oil recovery factor, which are obtained by fitting based on the experimental results.
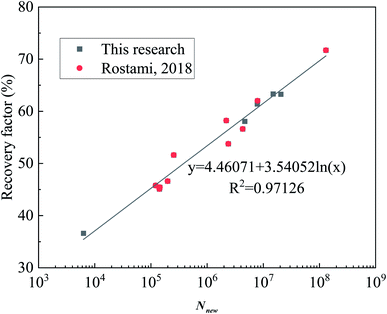
α1 = 1, α2 = 2, α3 = 1 are obtained by fitting the results in the research and the study of Rostami,28 as shown in Fig. 15. According to Fig. 15, the relationship between Nnew and recovery factor is RF = 4.46 + 3.54![[thin space (1/6-em)]](https://www.rsc.org/images/entities/char_2009.gif) ln
ln![[thin space (1/6-em)]](https://www.rsc.org/images/entities/char_2009.gif) Nnew, with the association coefficient reaching 0.97. That is,
Nnew, with the association coefficient reaching 0.97. That is,
 | (4) |
Nnew emphasizes the influence of gravity, viscous force, capillary force, gas–oil viscosity ratio, viscosity reduction of gas, and physical property and thickness of the reservoir, which can accurately predicate the oil recovery factor of GAGD in the heterogeneous reservoir with different permeability. When using Nnew, coefficients of association α1, α2, and α3 need to be confirmed with some indoor experiments to improve prediction accuracy.
4 Conclusion
In this paper, a series of 3D experiments were performed to investigate the effects of several variables on GAGD. The GOC migration law during GAGD was monitored with electrical resistivity tomography. Based on 3D GAGD experiments, and dimensional analysis, the results can be summarized as follows:(1) When the gas injection rate is low, the capillary force and viscous force are small. Gravity dominates the flow of oil and gas in the heterogeneous porous media. With the increase of gas injection rate, the flow of oil and gas in heterogeneous porous media changes to be dominated by capillary force, viscous force, and gravity. The mutual balance between these three factors determines the stability of the displacement front.
(2) N2-GAGD can maintain the stability of GOC, but the oil recovery factor is low. In CO2 and gas mixture GAGD, part of the gas is dissolved in the crude oil and exhausted, leading to the decrease of advancing rate and swept area of GOC. The viscosity reduction, swelling, and low tension of CO2 and gas mixture contribute to a high recovery factor. CO2-GAGD achieves the best recovery with the gas injection rate of 0.15 m d−1 at 15 MPa.
(3) The continuous remaining oil film has a hydraulic connection that can help overcome the capillary force in the low-permeability region and ensure the stability of the interface, a higher swept volume, and a higher recovery factor during GAGD. The influence of gravity, viscous force, capillary force, the dissolution and viscosity reduction and swelling of gas in crude oil need to be considered into GAGD. In this way, the stability of displacing front can be guaranteed, and the recovery factor can be improved most significantly.
(4) A new dimensional number Nnew that combines the gravity, viscous force, capillary force, gas–oil viscosity ratio, viscosity reduction of gas in crude oil, and the reservoir properties has been proposed. Nnew can accurately predicate the oil recovery factor of GAGD in heterogeneous reservoirs at different permeability.
Conflicts of interest
There is no conflict of interest among the authors.Acknowledgements
The authors acknowledge the financial support from the Fundamental Research Funds of the Central Universities (No. FRF-TP-20-006A1). This work was mostly completed during Debin Kong's stay at China University of Petroleum Beijing. Debin Kong wants to acknowledge the EOR lab of Yiqiang Li's in China University of Petroleum Beijing.References
- J. A. Klotz, J. Pet. Technol., 1953, 5, 19–21 CrossRef.
- J. Hagoort, SPE-9408-PA, 1980, 20, pp. 139–150 Search PubMed.
- A. Kantzas, I. Chatzis and F. A. L. Dullien, presented in part at the SPE Enhanced Oil Recovery Symposium, Tulsa, Oklahoma, 1988 Search PubMed.
- D. Rao, S. Ayirala, M. Kulkarni and A. Sharma, presented in part at the SPE/DOE Symposium on Improved Oil Recovery, Tulsa, Oklahoma, USA, 2004 Search PubMed.
- M. M. Kulkarni and D. N. Rao, presented in part at the AIChE Annual Meeting, San Francisco, CA, USA, 2006 Search PubMed.
- W. J. Al-Mudhafar and D. Rao, presented in part at the SPE Western Regional Meeting, 2017 Search PubMed.
- W. J. Al-Mudhafar, Energy Fuels, 2018, 32, 11067–11079 CrossRef CAS.
- W. Al-Mudhafar, D. Rao and E. McCreery, presented in part at the 79th EAGE Conference and Exhibition, Paris, France, 2017 Search PubMed.
- N. Akhlaghi, R. Kharrat and S. Mahdavi, Energy Sources, Part A, 2012, 34, 1619–1627 CrossRef CAS.
- B. Pedrera, H. Bertin, G. Hamon and A. Augustin, presented in part at the SPE Annual Technical Conference and Exhibition, San Antonio, Texas, 2002 Search PubMed.
- W. R. Paidin and D. N. Rao, presented in part at the International Symposium of the Society of Core Analysts, Calgary, Canada, 2007 Search PubMed.
- W. J. Al-Mudhafar, D. N. Rao and S. Srinivasan, Fuel, 2018, 221, 455–468 CrossRef CAS.
- W. J. Al-Mudhafar, D. N. Rao and S. Srinivasan, J. Pet. Sci. Eng., 2018, 166, 490–509 CrossRef CAS.
- Y. C. A. d. Itriago, M. Araujo and J. Molinaris, presented in part at the SPE Improved Oil Recovery Conference, Tulsa, Oklahoma, USA, 2018 Search PubMed.
- M. T. G. Janssen, F. Azimi and P. L. J. Zitha, presented in part at the SPE Improved Oil Recovery Conference, Tulsa, Oklahoma, USA, 2018 Search PubMed.
- H. Guo, J. Dong, Z. Wang, H. Liu, R. Ma, D. Kong, F. Wang, X. Xin, Y. Li and H. She, presented in part at the SPE Improved Oil Recovery Conference, Tulsa, Oklahoma, USA, 2018 Search PubMed.
- Z. Song, J. Hou, X. Liu, Q. Wei, H. Hao and L. Zhang, J. Pet. Sci. Eng., 2018, 166, 225–234 CrossRef CAS.
- J. Dumore and R. Schols, SPE-9408-PA, 1974, 14, pp. 437–444 Search PubMed.
- A. Skauge, O. O. Eleri, A. Graue and P. Monstad, presented in part at the SPE/DOE Improved Oil Recovery Symposium, Tulsa, Oklahoma, 1994 Search PubMed.
- A. Sharma and D. N. Rao, presented in part at the SPE Symposium on Improved Oil Recovery, Tulsa, Oklahoma, USA, 2008 Search PubMed.
- A. P. Sharma, Master thesis, Louisiana State University, 2005.
- C. A. Grattoni, X. D. Jing and R. A. Dawe, J. Pet. Sci. Eng., 2001, 29, 53–65 CrossRef CAS.
- H. Khorshidian, L. A. James and S. D. Butt, Energy Fuels, 2018, 32, 6438–6451 CrossRef CAS.
- M. Blunt, D. Zhou and D. Fenwick, Transp. Porous Media, 1995, 20, 77–103 CrossRef CAS.
- D. Rao, M. Girard and S. Sayegh, J. Can. Pet. Technol., 1992, 31, 47–55 CAS.
- D. Rao, Contact Angle, Wettability Adhes., 2003, 3, 1–20 Search PubMed.
- B. Rostami, R. Kharrat, M. Pooladi-Darvish and C. Ghotbi, Transp. Porous Media, 2010, 83, 725–740 CrossRef.
- B. Rostami, P. Pourafshary, A. Fathollahi, M. R. Yassin, K. Hassani, M. Khosravi, M. Mohammadifard and A. Dangkooban, Int. J. Multiphase Flow, 2018, 99, 273–283 CrossRef CAS.
- K. Ma, H. Jiang, J. Li, R. Zhang, K. Shen and Y. Zhou, Energies, 2020, 13, 402 CrossRef.
- P. Xiao, M. Cui, W. Zhang, Q. Hu, S. Zhao, R. Wang and Y. Tang, Energy Sources, Part A DOI:10.1080/15567036.2020.1763519 , published online..
- G. Meszaros, A. Chakma, K. Jha and M. Islam, presented in part at the SPE Annual Technical Conference and Exhibition, New Orleans, Louisiana, USA, 1990 Search PubMed.
- T. Mahmoud and D. N. Rao, presented in part at the SPE Symposium on Improved Oil Recovery, Tulsa, Oklahoma, USA, 2008 Search PubMed.
- Z. Mohiuddin and M. Haghighi, presented in part at the SPE Enhanced Oil Recovery Conference, Kuala Lumpur, Malaysia, 2011 Search PubMed.
- M. B. Moghaddam and M. R. Rasaei, SPE J., 2014, 20, 324–336 CrossRef.
- Y. Peng, Y. Li, H. K. Sarma, S. Gao and D. Kong, presented in part at the SPE Annual Technical Conference and Exhibition, Virtual, 2020 Search PubMed.
- M. M. Kulkarni and D. N. Rao, presented in part at the SPE Annual Technical Conference and Exhibition, 2006 Search PubMed.
- M. M. Kulkarni, A. P. Sharma and D. N. Rao, presented in part at the International Symposium of the Society of Core Analysts, Toronto, Canada, 2005 Search PubMed.
- K. Wu, X. Li, X. Wang, B. Yan and M. Ren, Pet. Sci. Technol., 2013, 31, 2527–2533 CrossRef CAS.
- M. M. Moshir Farahi, M. Reza Rasaei, B. Rostami and M. Alizadeh, J. Energy Resour. Technol., 2014, 136, 0229011–0229018 CrossRef.
- X. Chen, Y. Li, G. Liao, C. Zhang, S. Xu, H. Qi and X. Tang, Pet. Explor. Dev., 2020, 47, 836–845 CrossRef.
- D. Kong, P. Lian, W. Zhu and Y. Li, Phys. Fluids, 2020, 32, 122004 CrossRef CAS.
- R. C. Reid, J. M. Prausnitz and B. E. Poling, The properties of gases and liquids, McGraw Hill Book Co., New York, NY, 1987 Search PubMed.
- J. B. Moortgat, A. Firoozabadi, Z. Li and R. O. Espósito, SPE J., 2013, 18, 331–344 CrossRef CAS.
- M. Khosravi, A. Bahramian, M. Emadi, B. Rostami and E. Roayaie, Fuel, 2014, 117, 43–49 CrossRef CAS.
- F. J. Argüelles-Vivas and T. Babadagli, J. Pet. Sci. Eng., 2014, 118, 61–73 CrossRef.
- F. J. Argüelles-Vivas and T. Babadagli, Int. J. Heat Fluid Flow, 2015, 52, 1–14 CrossRef.
- B. Lepski, Z. Bassiouni and J. M. Wolcott, presented in part at the SPE/DOE Improved Oil Recovery Symposium, Tulsa, Oklahoma, 1998 Search PubMed.
- C. Coll, A. H. Muggeridge and X. D. Jing, SPE J., 2001, 6, 299–310 CrossRef.
- A. Rahman, F. A. Happy, S. Ahmed and M. E. Hossain, J. Pet. Sci. Eng., 2017, 158, 66–79 CrossRef CAS.
- S. E. Sadati and R. Kharrat, Energy Sources, Part A, 2013, 35, 629–634 CrossRef CAS.
- S. Sadati and R. Kharrat, Energy Sources, Part A, 2013, 35, 164–172 CrossRef.
| This journal is © The Royal Society of Chemistry 2021 |

