 Open Access Article
First-principles study on the electronic and optical properties of Bi2WO6†
Haseeb Ahmada,
Ali Rauf *b,
Afaq Ahmadc,
Ata Ulhaqa and
Shoaib Muhammadb
aDepartment of Physics, Lahore University of Management Sciences, Lahore, Pakistan
bDepartment of Chemistry and Chemical Engineering, Lahore University of Management Sciences, Lahore, Pakistan. E-mail: ali.rauf@lums.edu.pk
cCentre of Excellence in Solid State Physics, University of the Punjab, Quaid-i-Azam Campus, Lahore, Pakistan
First published on 30th September 2021
Abstract
Photocatalytic materials attract continued scientific interest due to their possible application in energy harvesting. These applications critically rely on efficient photon absorption and exciton physics, which are governed by the underlying electronic structure. We report the electronic properties and optical response of the Bi2WO6 bulk photocatalyst using first-principle methods. The density functional theory DFT-computed electronic band gap is corrected by including Hubbard potentials for W-5d and O-2p orbitals, and one of the most advanced methods, Quasi-Particle (QP) GW at different levels, with semi-core states of Bi (5s and 5p) and W (4f), carefully taken into account in GW calculations. The perplexing nature of band character of Bi2WO6 is examined, and it comes out to be direct at PBE level without SOC. However, it shows indirect nature at GW level or when Spin–Orbit Coupling (SOC) is turned on even at PBE level. The optical response of the material system is computed within independent-particle approximation (IPA), taking into account local field effects and employing the time-dependent DFT (TDDFT) method. Bethe–Salpeter equation (BSE) is used to capture the excitonic effect, and the results of these approximations are compared with the experimental data. Our first-principle calculations results indicate that electron–hole interaction significantly modifies optical absorption of Bi2WO6, thereby verifying the reported experimental observations.
1 Introduction
Since the inception of photocatalytic hydrogen production by water splitting using TiO2,1 there has been a growing interest in artificial photocatalysts active within the visible spectrum. TiO2 emerged as one of the most studied photocatalytic systems due to its easy availability, low cost, and non-toxic nature. However, due to the relatively large band gap, the photocatalytic activity of TiO2 is maximum only within a narrow region of the UV part of the electromagnetic spectrum. Considerable effort has been put into tuning the TiO2 band gap, either by doping2 or modifying the surface properties.3 Alternative strategies involve searching for new material systems with active photon harvesting capability for visible energies. Oxides of tungsten and metal–tungsten oxides, for instance, WO3, Sn2WO6, Bi2WO6, SnWO4 have evolved as promising materials with photo-harvesting capabilities within the visible region.4Bismuth tungsten oxide Bi2WO6 belongs to this class of W-based photocatalytic materials, which has already been explored experimentally5 and theoretically.6 It has lower photocatalytic activity as compared to TiO2; however, it's lower band gap makes it photo-active even at visible frequencies, albeit at the higher frequency end of the visible spectrum. However, it's band gap can be tuned,6 apart from it being photostable and environment-friendly.5 Several studies have attempted to improve the photocatalytic activity of Bi2WO6, including heterojunction structure,5 co-catalyst loading,7 and external doping.8
Experimental studies on the optical response of the material has been reported.5 However, there are still unanswered questions as the theoretical results do not fully explain observations from absorption and emission spectroscopy of this material system. A multitude of theoretical calculations have also been reported on Bi2WO6, most of them are studies carried out to enhance the photocatalytic activity via doping,6,8–10 or making heterostructure. However, almost all the previous study aims toward the relative study of Bi2WO6 with respect to the doped or modified system, and hence the comparison with the measured data was often overlooked. Therefore, we have tried to examine the reliability of different theoretical models against experimental data. For example, some of the experiments suggest an indirect band gap for Bi2WO6,5,11 however, most of the theoretically calculated electronic structure calculations predict a direct band gap.12,13 Furthermore, the presence of Bi and W suggests a role for spin–orbit coupling (SOC). However, previous theoretical calculations did not consider SOC in the calculations.6,8,14
Bi2WO6 might also exhibit strong excitonic effects; therefore, theoretical treatment using the Bethe–Salpeter Equation (BSE), based on many-body perturbation theory (MBPT) is the preferred choice for this material system. Recently reported theoretical studies utilize ab initio calculations using BSE for pure and doped-Bi2WO6.10 However, those calculations did not include spin–orbit coupling (SOC), and comparison with experimental data was not studied.
In this work, we report the electronic structure and visible light response of orthorhombic Bi2WO6 using detailed ab initio theoretical calculations using various theoretical frameworks and present a detailed comparison with experimental spectroscopy of this particular photocatalytic material system. The impact of pseudopotentials and valance–core partition has been found to be critical in GW,15 therefore for the GW calculations, we adopted pseudopotentials with different core–valance partitions. For optical response, different theoretical approximations, like random phase approximation (RPA), TDDFT, and Bethe–Salpeter Equation (BSE) were employed. The best agreement with the experimentally detected optical response is observed using BSE. Better modeling correspondence with experiments using BSE suggests strong excitonic effects in this material system. The inclusion of SOC, correcting the electronic states via G0W0 or scGW changes the direct band gap character of the material into an indirect one for pure Bi2WO6, which is in agreement with the experiments.5,11 Moreover, the indirect band gap of Bi2WO6 has also been theoretically investigated for the orthorhombic phase even without considering the SOC effects using a hybrid functional (HSE06).16 However, the direct band gap has also been obtained in recent findings using HSE06.17,18 Moreover, the band gap and the nature of the gap strongly depend on the structural parameters, which might be a reason for the different nature of gap in the literature. Lastly, the strong excitonic contribution points to a less efficient photocatalytic material; however, a better understanding of the role of semi-core states in GW and SOC in this material can pave the way for the selection of a more suitable tuning mechanism to enhance the photocatalytic activity of the material.
2 Theoretical and computational approach
2.1 Ground state calculations
We have used DFT19 to compute the Kohn–Sham states. Generalized Gradient Approximation (GGA) to account for the exchange interaction between the electrons and the correlation potential as implemented in the Perdew–Burke–Eruzerh (PBE)20 was employed. The calculations have been performed using the Quantum ESPRESSO code.21 Ions–electrons attractive interaction is modeled by using the norm-conserving pseudopotentials.22 Fully relativistic pseudopotentials were used for SOC calculations. All the calculations, except all GW's and BSE@QP (BSE@G0W0 or BSE@scGW), were performed using pseudopotentials taken from PesudoDojo,23 including Non-Linear Core Correction (NLCC). On the other hand, the SG15 potentials23 were used (full relativistic and scalar-relativistic) for MBPT calculations (all GW and BSE@GW) without NLCC and different core–valance partitioning. The details of the employed potentials are given in Table S3 (ESI†). In all the optical calculations, we have also included the non-local part of the pseudopotentials.24Electron wave functions are expanded in the form of a plane-wave basis set up to the cutoff energy 100 Ry, at which the total energy convergence of 5.5 × 10⁻⁶ Ry per atom is achieved. A k-points sampling under the Monkhorst–Pack25 scheme was used for the first Brillouin zone integration using the 6 × 2 × 6 k-mesh, which resulted in 40 k-points in the irreducible Brillouin zone. All the calculations are performed using the non-spin-polarized DFT to save computational time, as we had seen that pure Bi2WO6 has identical DOS for spin-up and spin-down configurations (Fig. S1†). To achieve the minimum potential energy configuration of the system, the atomic positions and structure constants are optimized by computing the Hellmann–Feynman forces using the Broyden–Fletcher–Goldfarb–Shanno procedure (BFGS).26 Optimization is performed until the total force on the system became as low as 0.005 Ry a.u−1.
2.2 Excited-state calculations
QP corrections at the G0W0 and the self-consistent GW (evGW) were computed using the Yambo code,30 and then later used for the BSE calculations. To compute the inverse dielectric matrix for the GW, the plasmon-pole approximation31 was applied with 20 Ry energy cutoff for the exchange part of the self-energy and 5 Ry was selected for the correlation cutoff (energy cut off in the screening). For the polarization and self-energy integration, 500 and 1000 bands were taken for without and with SOC respectively. The significance of self-consistency by updating the eigen energies of both G and W has been proved vital for many semiconductors in mitigating the effect of dependence of starting point in G0W0.32 We have also used self-consistent GW (evGW) approach to get the band gap close to the measured value. Fig. S2† shows the convergence test for the number of iterations for a scGW calculation. The QP correction after fully convergent third iteration was taken in the final BSE calculation, (BSE@scGW), for without SOC calculation.
Moreover, we have also used DFT+U33 to find the band structure with a gap close to the experimental value. To correct the band gap energies and to account for the onsite coulombic repulsion due to the correlated states, the Hubbard potentials (U) was applied not only to W-5d but also to the O-2p states with potential energy values of 6.2 eV![[thin space (1/6-em)]](https://www.rsc.org/images/entities/char_2009.gif) 34 and 5.9 eV,35 respectively. It has already been studied extensively that applying the Hubbard corrections to p-orbitals has a significant effect on the band gap,36 as it signifies the localized nature of O-2p state and is also evident from other transition metal oxide in a recent study.37 However, to correct the absorption onset in all the optical calculations, we applied either the GW correction or a rigid scissors correction (Δ value in eV) to correct the value of the fundamental gap (Hubbard U was not used in any optical calculation).
34 and 5.9 eV,35 respectively. It has already been studied extensively that applying the Hubbard corrections to p-orbitals has a significant effect on the band gap,36 as it signifies the localized nature of O-2p state and is also evident from other transition metal oxide in a recent study.37 However, to correct the absorption onset in all the optical calculations, we applied either the GW correction or a rigid scissors correction (Δ value in eV) to correct the value of the fundamental gap (Hubbard U was not used in any optical calculation).
2.2.2.1 Random phase approximation (RPA). We consider the independent particle approximation, including the local field effects (LFE), called the RPA level of theory.42 The local field is the result of the polarization inside the material caused by the applied electric field. LFE is important to describe the density inhomogeneity in a material.
2.2.2.2 Time-dependent DFT (TDDFT). TDDFT43 comes as a natural choice going beyond DFT for the excited states. These calculations are based on changing electron density as a function of the external potential.44 We also need the exchange-correlation (xc) kernel45 apart from the exchange-correlation potential for TDDFT. The functional derivative of xc potential with respect to time-dependent density is xc-kernel, which should be well defined. There are a lot of different kernels available. We have chosen a simple, long-range static corrected (LRC) kernel.46 LRC has proven good for some bulk semiconductors. The mathematical form of the kernel is given in eqn (1).
 | (1) |
In eqn (1) α is the empirical parameter that depends upon the material. This kernel incorporates the long-range component, which is missing at the level of the Adiabatic Local Density Approximation (ALDA). This kernel is non-local, static, and comprises the long-distance Coulomb tail. Since the α is the empirical or fitting parameter, therefore, we have computed TDDFT using different values for α. The two selected values were 0.59 and 0.70, the former value of α was calculated from the relation proposed between α and dielectric constant as given in Section (3.2.2) while the second value was chosen arbitrarily.
2.2.2.3 Bethe–Salpeter equation (BSE). Neutral excitations like optical absorption are well established in the solution of BSE,44,47 which also describes the physics of electron–hole pair, the exciton. The BSE is normally solved as an eigenvalue problem for the electron–hole Hamiltonian.44 We have used the Kohn–Sham wavefunctions for the DFT with the appropriate scissor shift (Δ) to correct the band gap and computed the matrix elements of the statically screened electron–hole attraction,48 and unscreened exchange interaction that accounts for the local field effects. Furthermore, the BSE (both, SOC and without SOC) calculations were also performed on top of Quasi-Particle (QP) corrected energies.49 The eigenvalues and eigenstates of this BSE matrix are then used to find the optical properties of the material.50
3 Results and discussion
3.1 Electronic properties
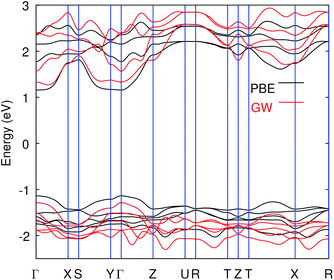
All the properties are calculated from the relaxed geometrical structure obtained by optimizing the orthorhombic Bi2WO6, crystallized in the Pca21 space group,51 in which it is mostly found. The experimental lattice parameters,51 a = 5.4372, b = 16.4302 and c = 5.4584 (in angstrom) were considered in the initial geometrical structure. The electronic properties of material play a vital role in understanding the dynamics of the charge carriers and hence their possible applications. We have calculated the band structure and density of states of Bi2WO6, and all the calculations are carried out on the PBE optimized structure as given in Table S1 (ESI†). Our calculated value of the band gap is much closer to the experimentally observed value as compared to the previous results.6,52,53 The computed band structure of Bi2WO6 without SOC is shown in Fig. 1a, and the obtained band gap is 2.32 eV. The experimental band gap of Bi2WO6 has been reported in the range 2.6 to 2.97 eV,5,54 and in this study, we have taken 2.8 eV as our reference value.55 Moreover, we have calculated the band structure along the k-path of Brillion zone (Fig. S7†), generated from automatic flow framework,56 which has not been explored before. Therefore, the calculated band structures help us gain an extensive overview of the electronic properties.The band structure shown in Fig. 1a depicts the direct band gap at the gamma point. However, the indirect nature of the band gap was suggested experimentally.5 Interestingly, with the inclusion of the spin–orbit effects, we get the indirect band gap of 2.26 eV, and the VB maxima and the CB minima are no-longer aligned at the same k-point as shown in Fig. 1b (double-headed arrows indicate the band maximum or minimum). The CB minimum was shifted to k = 0.16,0,0 point (reciprocal lattice units) of the BZ along the Γ–X direction when we turned-on the SOC. A similar effect was also observed after Quasi-Particle (QP) corrections (using SG15 PPs) on PBE band structure. The band gap from G0W0 and scGW are indirect even without SOC applied. However, in each case, the difference between the direct and indirect gap values remains small. For instance, one of G0W0 results in 2.37 eV indirect and 2.40 eV direct gap. The band gap values from PBE, and after different QP corrections including nature of the gap is summarized in Table 1.
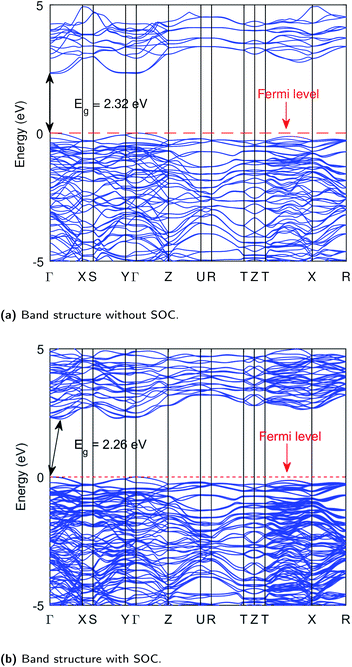 | ||
| Fig. 1 Band structures of Bi2WO6 at PBE level without Hubbard potential. Band structure without SOC (a), band structure with SOC (b), these computations were performed using PeseudoDojo potentials. | ||
| Model | Band gap (eV) | Nature of the gap |
|---|---|---|
| DFT (PBE) | 2.29 | Direct |
| G0W0 | 2.40 | Indirect |
| scGW | 2.55 | |
| G0W0-including Bi semi-core states | 2.38 | |
| scGW-including Bi semi-core states | 2.71 | |
| Experimental5 | 2.80 | |
| DFT (PBE) + SOC | 2.22 | |
| DFT (PBE) + SOC + G0W0 | 2.33 |
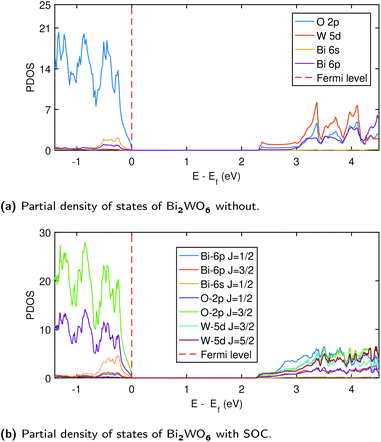
Despite the success of G0W0 for many materials, one of the biggest challenge arises in the materials where d electrons close to the Fermi energy hybridized with p electrons,57 leading to subtle exchange and correlation effects. Often when G0W0 fails, the self-consistent approach or better starting point (hybrid functional) is a possible remedy to obtain accurate electronic structure.15 In the case of Bi2WO6, the top of the valence band has the minimal W-5d density, however, it has a significant density at the bottom of the conduction band together with Bi-6p orbital (see Fig. 3a). We also found that the scGW approach might be efficient for Bi2WO6 as the G0W0 alone is not good enough to provide an accurate band gap.
Another well-known issue in GW is the choice of the valance–core partition of the pseudopotential.15,58,59 The GW corrections might contain substantial errors due to the core–valance exchange interactions when the spatial overlap between the valence and semi-core states is significant.60,61 This has led to some claims in the past regarding the failure of the pseudopotential method on GW.44,62 However, it has also been found that careful inclusion of semi-core states in the pseudopotentials, and including the full-shell of the d-block electrons in the valence can avoid those errors making GW results reliable.63 In this work, we have used different pseudopotentials (for QP corrections) with and without Bi 5s and 5p and including W-4f states. The details of these potentials are given in Table S3 (ESI†). The results presented in Table 1 without SOC show that we do not get band gap comparable to experiment using G0W0 whereas scGW improves the gap, particularly when Bi semi-core states are included in valence. Due to computational costs, we have avoided the scGW in the case of SOC. The band structure from scGW along with PBE is shown in Fig. 2. It is clear that, apart from opening the gap, QP–GW correction also has some effect on the curvature of the bands, and due to which the band gap's nature also changed as evident in GW band structure (see Fig. 2).
Moreover, the band gap values with the applied Hubbard potential turned out to be 2.71 eV and 2.61 eV without and with SOC, respectively. However, the indirect gap was revealed when SOC is considered, also in the Hubbard calculations. The obtained band gaps with and without Hubbard potentials are summarized in Table S2,† and band structure with Hubbard potentials with and without SOC are also presented in Fig. S8 and S9.†
In SOC, the states are split depending upon the total angular momenta obtained by J = L + S to J = L − S![[thin space (1/6-em)]](https://www.rsc.org/images/entities/char_2009.gif) 64 as depicted in Fig. (3b). Therefore, in SOC, we have J = 1/2, and J = 3/2 for O-2p (L = 1) and J = 3/2, 5/2 for W-5d (L = 2). The higher density of states in the SOC is expected due to the spinor nature of wave function and is also evident from the band structure plot (1). The top of the conduction band is mainly composed of Bi-6p (J = 1/2) state, O-2p (J = 3/2), and W-5d (J = 3/2) states. Fig. S11 (ESI†) shows that states comprising conduction band minima have moved towards the Fermi level, which results in an overall decrease in the band gap when SOC is taken into account. The band gap values from TDOS are 2.26 eV and 2.32 eV with and without SOC, respectively, consistent with the band structure calculations with PBE using PseudoDojo potentials.
64 as depicted in Fig. (3b). Therefore, in SOC, we have J = 1/2, and J = 3/2 for O-2p (L = 1) and J = 3/2, 5/2 for W-5d (L = 2). The higher density of states in the SOC is expected due to the spinor nature of wave function and is also evident from the band structure plot (1). The top of the conduction band is mainly composed of Bi-6p (J = 1/2) state, O-2p (J = 3/2), and W-5d (J = 3/2) states. Fig. S11 (ESI†) shows that states comprising conduction band minima have moved towards the Fermi level, which results in an overall decrease in the band gap when SOC is taken into account. The band gap values from TDOS are 2.26 eV and 2.32 eV with and without SOC, respectively, consistent with the band structure calculations with PBE using PseudoDojo potentials.
3.2 Optical properties
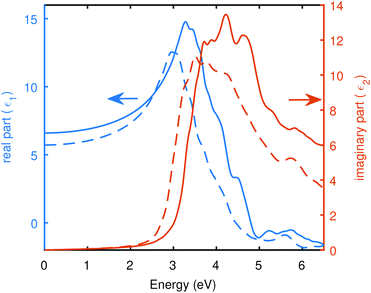
Fig. 4 depicts the real and imaginary parts of the dielectric function computed from BSE@(DFT+Δ), the BSE was computed with Spin–Orbit Coupling (BSE + SOC) and without SOC, to highlight the difference between SOC and without SOC. SOC seems to have a clear effect on absorption. The absorption onset decreases with an enhanced absorption at lower energies when SOC effects are taken into account. Absorption peaks are also red-sifted in the presence of SOC. The scissor shift (Δ) of 0.54 eV and 0.48 eV was applied to correct the DFT band gap with and without SOC, respectively. We found in this case, the static dielectric constant is 6.60, which gives a static refractive index of 2.57 in the absence of SOC. And a value of 5.72 for static dielectric constant in the presence of SOC yields a static refractive index to be 2.39. The static refractive index was obtained by n(0) = ε1(0), and the static dielectric constants are evident from Fig. 4.
| α = 4.615ε∞−1 − 0.213 | (2) |
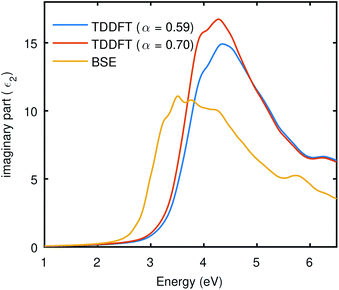
By using the static dielectric of 5.72 from BSE@(DFT+Δ) with SOC, we found α should be 0.59. The TDDFT results (including SOC) presented in Fig. 6 also uses α = 0.59. The result of TDDFT-LRC shown in Fig. 6 is better than RPA and close to the BSE curves (both comparing with SOC and without SOC), despite the fact that the bare ground state wave functions were taken from DFT for these optical calculations. However, LRC also seems to underestimate the excitonic effects as it provides a slightly blue-shifted curve. We can switch to the empirical approach and vary the α to try to get close to the BSE curve or experimental result. The result of this analysis is demonstrated in Fig. 5, performed with SOC, which shows that TDDFT with a higher value of α can bring the spectra towards BSE (including SOC calculations), but it also enhances the intensity of the spectrum. The LRC kernel for Bi2WO6 shows limitations. LRC is best known for the continuum excitation, and it does not perform well in materials having bound excitons and misses the correlation term.46
The optical absorption was also computed with SOC, and the comparison of SOC is conceived using the BSE spectra, Fig. 6 shows the comparison of theories, again without starting from GW wave functions and energies, and therefore, a rigid shift (Δ) was applied to match with the experimental gap. The optical absorption starts at lower energy for BSE@(DFT+Δ) + SOC, and the peak at around 300 nm is not present in this case. This establishes that BSE@(DFT+Δ) + SOC results are in better agreement with the experiment.
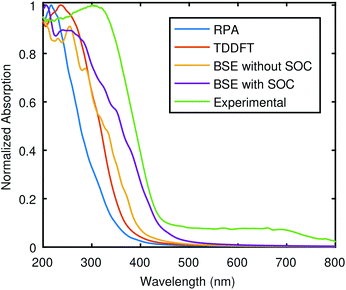 | ||
| Fig. 6 Comparison of absorption calculated using different theoretical approximations with the experimental data.5 The Bethe–Salpeter equation (BSE) results are shown for both SOC (BSE + SOC) and without SOC, while other theoretical results are for SOC case only. The used potentials are from PseudoDojo and scissor corrections was used to correct the band gap. | ||
To incorporate the QP corrections in the optical calculations, we have also computed the BSE (both with and without SOC) starting from G0W0 or scGW. Here, the shape of BSE curve, especially in without SOC case, as shown in Fig. 7 is almost identical to what we get from BSE@(DFT+Δ and without SOC). Once again, the BSE curve with SOC looks closer to the experiment qualitatively. However, interesting thing here is that all theoretical curves are blue-shifted with respect to the experiment despite the fact that the underlying fundamental band gap from the QP correction was small compared to the experimental value in each case. To reiterate, in the SOC case, we are presenting the result of BSE@(G0W0) only, and we have avoided scGW. The deviation of BSE results (in both the cases, SOC and without SOC) (obtained by including GW energies) from the experimental data needs further investigation to better understand the electronic structure of Bi2WO6. Moreover, there are also some spurious wiggles from around 210 nm to 310 nm in theoretical calculations, which might be due to finite k-point sampling.
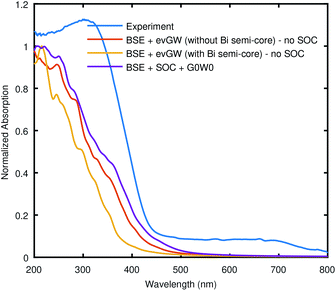 | ||
| Fig. 7 The comparison of the Bethe–Salpeter equation (BSE) calculations starting from GW, with experimental data. In the legend “no SOC” refers to “without SOC”. The used pseudopotentials were taken from SG15 library or generated from ONCV code as listed in Table S3 (ESI†). | ||
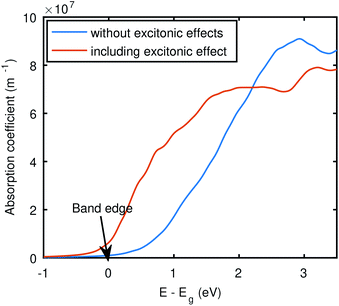
Furthermore, to examine the optical absorption near the band edge, we have plotted the absorption coefficients obtained by BSE@(DFT+Δ) + SOC along with the RPA@(DFT+Δ) + SOC. If the incident photon energy is less than the material's band gap, then valence electrons will not be able to make transitions to the conduction bands, and hence no absorption occurs. However, due to the excitonic states below the conduction band, we have a small absorption even before the electronic gap that is captured by the BSE, shown in Fig. 8. It is evident that the BSE curve shows non-zero absorption below the electronic gap, which indicates the presence of excitonic states. Moreover, we also have seen an enormous red-shift in all the BSE data as compared to RPA curves, due to electron–hole attraction, as evident in Fig. 6, which signifies the importance of electron–hole attraction for Bi2WO6. However, this significant effect of electron–hole attraction needs to be probed further with more involved theories. For example we have not included the lattice screening,66 and the effect of phonons,67 in our calculations.
4 Conclusions
We have found that DFT with scissor correction (DFT+Δ) is an appropriate scheme to study the electronic and optical properties of Bi2WO6. The effect of spin–orbit coupling and QP corrections are crucial for Bi2WO6 as the nature of the band gap is changed when these are applied. Moreover, the band gap obtained considering Bi semi-core states from scGW was in best agreement with the experimental value.In the optical calculations, comparison of optical absorption with the experimental data suggests that BSE + SOC (both BSE on top of DFT+Δ and QP energies) is the most accurate theoretical treatment among all others which we have applied for the studied material. The electron–hole attraction also plays a vital role in the optical response of Bi2WO6, as the RPA and BSE curves differ immensely. The BSE (both with and without SOC) has been found to be crucial to get the absorption close to the experimental one. However, the excitonic analysis needs further careful investigations to compute the exciton binding energy. Our results provide an improved understanding of the optical response of this photocatalytic material (Bi2WO6) and can help in devising strategies to tune its properties.
Conflicts of interest
There are no conflicts to declare.Acknowledgements
This work was supported by the Research Grant STG-126 provided by Lahore University of Management Sciences (LUMS). Furthermore, we acknowledge valuable discussions with André Schleife (Blue Waters Assistant Professor, Affiliated Assistant Professor of Computational Science and Engineering, University of Illinois at Urbana–Champaign, USA) for helping in the analysis of the BSE calculations, and also Daniele Varsano (CNR Researcher, Institute of Nanoscience, Modena, Italy) for providing technical help regarding the Yambo code. All the calculations for this work were performed using the LUMS HPC resources.Notes and references
- A. Fujishima and K. Honda, Nature, 1972, 238, 37–38 CrossRef CAS PubMed.
- S. Ansari, M. Khan, M. Ansari and M. Cho, New J. Chem., 2016, 40(4), 3000–3009 RSC.
- J. Low, B. Cheng and J. Yu, Appl. Surf. Sci., 2017, 392, 658–686 CrossRef CAS.
- B. Huang and J. N. Hart, Phys. Chem. Chem. Phys., 2020, 22, 1727–1737 RSC.
- A. Rauf, M. Ma, S. Kim, M. S. A. S. Shah, C. H. Chung, J. H. Park and P. J. Yoo, Nanoscale, 2018, 10, 3026–3036 RSC.
- F. Ren, J. Zhang and Y. Wang, RSC Adv., 2015, 5, 29058–29065 RSC.
- C. Sun and R. Wang, New J. Chem., 2020, 44, 10833–10839 RSC.
- P. V. Hai and T. P. T. Linh, J. Phys. Soc. Jpn., 2020, 89, 044707 CrossRef.
- T. P. T. Linh, N. D. Phu, P. Van Hai and L. H. Hoang, J. Electron. Mater., 2021, 50, 4027–4033 CrossRef CAS.
- J. Zhang, P. Deng, M. Deng, H. Shen, Z. Feng and H. Li, ACS Omega, 2020, 5, 29081–29091 CrossRef CAS.
- X. Meng and Z. Zhang, J. Photochem. Photobiol., A, 2015, 310, 33–44 CrossRef CAS.
- T. Jing, Y. Dai, W. Wei, X. Ma and B. Huang, Phys. Chem. Chem. Phys., 2014, 16, 18596–18604 RSC.
- K. Lai, W. Wei, Y. Zhu, M. Guo, Y. Dai and B. Huang, J. Solid State Chem., 2012, 187, 103–108 CrossRef CAS.
- H. Ait ahsaine, A. El Jaouhari, A. Slassi, M. Ezahri, A. Benlhachemi, B. Bakiz, F. Guinneton and J. R. Gavarri, RSC Adv., 2016, 6, 101105–101114 RSC.
- I. Aguilera, J. Vidal, P. Wahnón, L. Reining and S. Botti, Phys. Rev. B: Condens. Matter Mater. Phys., 2011, 84, 085145 CrossRef.
- F. Opoku, K. K. Govender, C. G. C. E. van Sittert and P. P. Govender, Appl. Surf. Sci., 2018, 427, 487–498 CrossRef CAS.
- Y. Wu, J. Zhang, B. Long and H. Zhang, Appl. Surf. Sci., 2021, 548, 149053 CrossRef CAS.
- M. Li, Y. Dai, W. Wei and B. Huang, Phys. Chem. Chem. Phys., 2018, 20, 9221–9227 RSC.
- P. Hohenberg and W. Kohn, Phys. Rev., 1964, 136, B864 CrossRef.
- J. P. Perdew, K. Burke and M. Ernzerhof, Phys. Rev. Lett., 1996, 77, 3865–3868 CrossRef CAS PubMed.
- P. Giannozzi, S. Baroni, N. Bonini, M. Calandra, R. Car, C. Cavazzoni, D. Ceresoli, G. L. Chiarotti, M. Cococcioni, I. Dabo, A. Dal Corso, S. De Gironcoli, S. Fabris, G. Fratesi, R. Gebauer, U. Gerstmann, C. Gougoussis, A. Kokalj, M. Lazzeri, L. Martin-Samos, N. Marzari, F. Mauri, R. Mazzarello, S. Paolini, A. Pasquarello, L. Paulatto, C. Sbraccia, S. Scandolo, G. Sclauzero, A. P. Seitsonen, A. Smogunov, P. Umari and R. M. Wentzcovitch, J. Phys.: Condens. Matter, 2009, 21, 395502 CrossRef PubMed.
- D. R. Hamann, M. Schlüter and C. Chiang, Phys. Rev. Lett., 1979, 43, 1494–1497 CrossRef CAS.
- D. R. Hamann, Phys. Rev. B: Condens. Matter Mater. Phys., 2013, 88, 085117 CrossRef.
- A. F. Starace, Phys. Rev. A, 1971, 3, 1242–1245 CrossRef.
- H. J. Monkhorst and J. D. Pack, Phys. Rev. B, 1976, 13, 5188–5192 CrossRef.
- H. B. Schlegel, J. Comput. Chem., 1982, 3, 214–218 CrossRef CAS.
- M. S. Hybertsen and S. G. Louie, Phys. Rev. B: Condens. Matter Mater. Phys., 1986, 34, 5390–5413 CrossRef CAS.
- L. J. Sham and M. Schlter, Phys. Rev. Lett., 1983, 51, 1888–1891 CrossRef.
- L. Hedin, Phys. Rev., 1965, 139, A796 CrossRef.
- D. Sangalli, A. Ferretti, H. Miranda, C. Attaccalite, I. Marri, E. Cannuccia, P. Melo, M. Marsili, F. Paleari, A. Marrazzo, G. Prandini, P. Bonfà, M. O. Atambo, F. Affinito, M. Palummo, A. Molina-Sánchez, C. Hogan, M. Grüning, D. Varsano and A. Marini, J. Phys.: Condens. Matter, 2019, 31, 325902 CrossRef CAS PubMed.
- R. W. Godby and R. J. Needs, Phys. Rev. Lett., 1989, 62, 1169 CrossRef PubMed.
- I. A. Sarsari, C. D. Pemmaraju, H. Salamati and S. Sanvito, Phys. Rev. B, 2013, 87, 245118 CrossRef.
- V. I. Anisimov, J. Zaanen and O. K. Andersen, Phys. Rev. B, 1991, 44, 943–954 CrossRef CAS PubMed.
- N. A. McDowell, K. S. Knight and P. Lightfoot, Chem. - Eur. J., 2006, 12, 1493–1499 CrossRef CAS PubMed.
- G. Mattioli, C. Melis, G. Malloci, F. Filippone, P. Alippi, P. Giannozzi, A. Mattoni and A. Amore Bonapasta, J. Phys. Chem. C, 2012, 116, 15439–15448 CrossRef CAS.
- R. Gaspari, F. Labat, L. Manna, C. Adamo and A. Cavalli, Theor. Chem. Acc., 2016, 135, 73 Search PubMed.
- K. Harun, N. A. Salleh, B. Deghfel, M. K. Yaakob and A. A. Mohamad, Results Phys., 2020, 16, 102829 Search PubMed.
- A. Schleife, C. Rödl, F. Fuchs, J. Furthmüller and F. Bechstedt, Phys. Rev. B: Condens. Matter Mater. Phys., 2009, 80, 035112 CrossRef.
- D. Rocca, Y. Ping, R. Gebauer and G. Galli, Phys. Rev. B: Condens. Matter Mater. Phys., 2012, 85, 045116 CrossRef.
- R. Haydock, Comput. Phys. Commun., 1980, 20, 11–16 CrossRef.
- A. Schleife, P. Rinke, F. Bechstedt and C. G. Van De Walle, J. Phys. Chem. C, 2013, 117, 4189–4193 CrossRef CAS.
- D. Bohm and D. Pines, Phys. Rev., 1951, 82, 625–634 CrossRef CAS.
- E. Runge and E. K. Gross, Phys. Rev. Lett., 1984, 52, 997–1000 CrossRef CAS.
- G. Onida, L. Reining and A. Rubio, Electronic excitations: Density-functional versus many-body Green’s-function approaches, 2002, https://journals.aps.org/rmp/abstract/10.1103/RevModPhys.74.601 Search PubMed.
- F. Aryasetiawan and O. Gunnarsson, Phys. Rev. B: Condens. Matter Mater. Phys., 2002, 66, 1–7 CrossRef.
- S. Botti, F. Sottile, N. Vast, V. Olevano, L. Reining, H. C. Weissker, A. Rubio, G. Onida, R. Del Sole and R. W. Godby, Phys. Rev. B: Condens. Matter Mater. Phys., 2004, 69, 155112 CrossRef.
- E. E. Salpeter and H. A. Bethe, Phys. Rev., 1951, 84, 1232–1242 CrossRef.
- C. Rödl, F. Fuchs, J. Furthmüller and F. Bechstedt, Phys. Rev. B: Condens. Matter Mater. Phys., 2009, 79, 235114 CrossRef.
- C. Rödl, F. Fuchs, J. Furthmüller and F. Bechstedt, Phys. Rev. B: Condens. Matter Mater. Phys., 2008, 77, 184408 CrossRef.
- S. Albrecht, L. Reining, R. Del Sole and G. Onida, Phys. Rev. Lett., 1998, 80, 4510–4513 CrossRef CAS.
- K. S. Knight, Mineral. Mag., 1992, 56, 399–409 CrossRef CAS.
- H. Djani, P. Hermet and P. Ghosez, J. Phys. Chem. C, 2014, 118, 13514–13524 CrossRef CAS.
- V. Koteski, J. Belošević-Čavor, V. Ivanovski, A. Umićević and D. Toprek, Appl. Surf. Sci., 2020, 515, 146036 CrossRef CAS.
- M. Ge, Y. Li, L. Liu, Z. Zhou and W. Chen, J. Phys. Chem. C, 2011, 115, 5220–5225 CrossRef CAS.
- T. Saison, P. Gras, N. Chemin, C. Chanéac, O. Durupthy, V. Brezová, C. Colbeau-Justin and J. P. Jolivet, J. Phys. Chem. C, 2013, 117, 22656–22666 CrossRef CAS.
- S. Curtarolo, W. Setyawan, G. L. Hart, M. Jahnatek, R. V. Chepulskii, R. H. Taylor, S. Wang, J. Xue, K. Yang, O. Levy, M. J. Mehl, H. T. Stokes, D. O. Demchenko and D. Morgan, Comput. Mater. Sci., 2012, 58, 218–226 CrossRef CAS.
- J. Vidal, S. Botti, P. Olsson, J.-F. Guillemoles and L. Reining, Phys. Rev. Lett., 2010, 104, 056401 CrossRef PubMed.
- H. Dixit, R. Saniz, D. Lamoen and B. Partoens, Comput. Phys. Commun., 2011, 182, 2029–2031 CrossRef CAS.
- P. Umari and S. Fabris, J. Chem. Phys., 2012, 136, 174310 CrossRef CAS PubMed.
- P. Scherpelz, M. Govoni, I. Hamada and G. Galli, J. Chem. Theory Comput., 2016, 12, 3523–3544 CrossRef CAS PubMed.
- B. Shih, Y. Xue, P. Zhang, M. Cohen and S. Louie, Phys. Rev. Lett., 2010, 105, 146401 CrossRef PubMed.
- F. Bruneval, N. Vast and L. Reining, Phys. Rev. B: Condens. Matter Mater. Phys., 2006, 74, 045102 CrossRef.
- M. Rohlfing, P. Krüger and J. Pollmann, Phys. Rev. Lett., 1995, 75, 3489 CrossRef CAS PubMed.
- R. Winkler, S. Papadakis, E. De Poortere and M. Shayegan, Spin-Orbit Coupling in Two-Dimensional Electron and Hole Systems, Springer, 2003, vol. 41 Search PubMed.
- F. Liu, N. Feng, L. Yang, Q. Wang, J. Xu and F. Deng, J. Phys. Chem. C, 2018, 122, 10948–10955 CrossRef CAS.
- A. Schleife, M. D. Neumann, N. Esser, Z. Galazka, A. Gottwald, J. Nixdorf, R. Goldhahn and M. Feneberg, New J. Phys., 2018, 20, 053016 CrossRef.
- E. Cannuccia, B. Monserrat and C. Attaccalite, Theory of phonon-assisted luminescence in solids: application to hexagonal boron nitride, 2019 Search PubMed.
Footnote |
| † Electronic supplementary information (ESI) available. See DOI: 10.1039/d1ra03784f |
| This journal is © The Royal Society of Chemistry 2021 |

