 Open Access Article
Preparation, characterization, and analysis of multi-walled carbon nanotube-based nanofluid: an aggregate based interpretation
Mohamed Abubakrab,
Tarek A. Osmana,
Hossam A. Kishawyc,
Farida Elharouni b,
Hussien Hegabc and
Amal M. K. Esawi
 *b
*b
aMechanical Design and Production Engineering Department, Cairo University, Giza 12613, Egypt
bDepartment of Mechanical Engineering, The American University in Cairo (AUC), AUC Avenue, P. O. Box 74, New Cairo 11835, Egypt. E-mail: a_esawi@aucegypt.edu; Tel: +20 2 26153102
cMachining Research Laboratory, University of Ontario Institute of Technology, Oshawa, ON L1H7K4, Canada
First published on 23rd July 2021
Abstract
Nanofluids are gaining attention as an attractive solution for the sustainable machining of difficult-to-cut materials. Despite the enormous recent work in the literature, there are still contradictions concerning the effect of different preparation factors on the characteristics of nanofluids and the underlying mechanisms governing them. In the present study, the effect of varying the preparation factors, namely, multi-walled carbon nanotube (MWCNT) concentration, sonication time, and surfactant amount on various nanofluid characteristics and the interactions among these characteristics were studied. The characteristics are divided into two categories: (a) dispersion/stability and (b) viscosity/wettability. The analysis showed strong interactions between these two categories which were mainly attributed to aggregates' formation and dynamics. For the stability/dispersion responses, the effect of aggregation and saturation phenomena is discussed in relation to the different preparation factors. Our analysis shows that the nanofluid viscosity is strongly dependent on aggregate morphology. As for wettability, a novel mechanism is proposed and used to explain the nanoparticles' influence on wettability based on the nanolayering theory. Finally, multi objective optimization (MOO) based on grey relational analysis (GRA) was performed. It was found that moderate MWCNT concentration, high sonication time, and low surfactant amount show the optimal characteristics within the current study design variables search domain. The novelty in the present study lies in its consideration of the simultaneous interaction between the nanofluids' properties and stability. Unlike the common practice in the literature, which focuses on one or two aspects of nanofluids, our approach broadens the analysis and provides in-depth insights into the nanofluid as a complete physical system.
1. Introduction
Optimizing the energy consumption and providing safe and environmentally friendly conditions are two essential requirements for sustainable machining processes. The inappropriate application of cutting fluids during machining operations is well known to impact the quality and cause economic, environmental, and health problems. The wider application of advanced materials such as titanium alloys, nickel-based alloys, structural ceramics, composites, and magnesium alloys in aerospace, automotive, oil and gas, and biomedical industries has been compromised due to several difficulties that arise during their machining. The use of nanofluids during machining difficult-to-cut materials can offer an attractive solution since they provide significant enhancements in the tribological and heat transfer characteristics which facilitate the machining process especially when combined with recent more sustainable lubrication techniques such as minimum quantity lubrication (MQL).Different types of nanoparticles have been added to cutting fluids. For example, multi-walled carbon nanotubes (MWCNTs) were added to the cutting fluid while turning Ti–6Al–4V,1 while in another work, a hybrid of MWCNTs and aluminum oxide (Al2O3) nanoparticles was added during machining Inconel 718 and the tool wear mechanisms were investigated.2 It was reported that both nanofluids showed better performance compared to traditional cutting fluids. A model that verified the benefit of using a MWCNT-based nanofluid during the machining process was provided in ref. 3. The superior performance of the nanofluids is attributed to their outstanding thermal and tribological characteristics, especially for MWCNT-based nanofluids. The advantages of the utilization of nanoparticles are not limited to one particular field. As a matter of fact, they have numerous applications such as in high capacity batteries4 and nanoelectronics,5 and they are also used in high performance heat transfer fluids in solar absorbers.6,7
Preparing a uniform and stable nanofluid is critical for utilizing the full nanofluid potential. In fact, this is one of the main challenges hindering its wider utilization in industrial applications. This motivated researchers to develop different techniques to enhance the dispersion of nanoparticles in nanofluids through chemical modification (i.e., covalent and non-covalent nanoparticles' surface treatment) or mechanical methods (i.e., sonication and milling). The effectiveness of steric stabilization using Gum Arabic as a surfactant was studied in ref. 8. An optimum surfactant concentration of 1 wt% was reported to extend the stability up to 40 days. Sonication time was also studied, and the optimum time of 4 h was reported. However, extended sonication times beyond this value were found to lower the stability. The author postulated that initially sonication led to detangling the aggregates, thus enhancing stability. However, excessive sonication can lead to breaking the MWCNTs, thus lowering stability. The decrease in aggregate size with sonication by photon correlation spectroscopy (PCS) measurements was confirmed in ref. 9. TEM was used in ref. 10 to show that nanoparticles were re-clustering again with increasing sonication time. Although nanofluid stability is a critical factor to take into consideration, most end users are interested not in the stability itself but rather in its effect on the final nanofluid properties. In the literature, the interaction between nanofluid stability and its physical properties is one aspect that needs further investigation.
The effect of the Al2O3 aggregation on the aqueous based nanofluid viscosity was investigated in ref. 11. They reported that the relative viscosity decreased from 43 to only 1.6 due to aggregates breakage by re-sonication. In addition, they also reported that before re-sonication samples showed obvious shear thinning behavior, especially for the 5 vol% concentration sample. However, after re-sonication, all samples showed shear thickening behavior. This demonstrates that aggregates existence can shift nanofluids' rheological characteristics from Newtonian to non-Newtonian. An increase in viscosity with sonication up to 7 min, followed by a final drop with further sonication has been reported.12 The initial increase was claimed to be due to the detangling of aggregates by sonication. However, this claim contradicts the effects of aggregates reported in other studies. It was argued that, aggregates' existence boosts the viscosity of the NF.13 Regarding the final drop in ref. 12, the authors attributed it to the breakage of CNTs due to excessive sonication.
The effect of surfactant concentration on the viscosities of two nanofluids was investigated and a complex non-linear relation with the general trend of decreasing viscosity with increasing the surfactant concentration was reported for sodium dodecylbenzene sulfonate (SDBS) surfactant.14 Contradicting results for MWCNT and different surfactants, including SDBS was reported.15 All surfactants showed an increase in viscosity compared to base oil, with a different increase for each surfactant. Based on these contradicting findings, it is believed that the effect of the surfactant must be influenced by base fluid and particle type.
One of the important nanofluid properties that lacks attention is nanofluid wettability. The effect of the addition of bismuth telluride nanoparticles in water on the contact angle as an indicator for wettability was investigated in ref. 16. The authors reported an increase in contact angle with nanoparticle loading until a certain value before it started decreasing again. The effect of adding silica nanoparticles to water was investigated and a decrease in surface tension and contact angle with increasing concentration was reported.17 The authors attributed the decrease in contact angle to the decrease in surface tension. The layering of nanoparticles on the solid surface supporting the droplet was postulated to contribute to the contact angle variation. In contrast, in ref. 18, the authors reported that the surface tension of nanofluid-type fuels increased due to suspended Al2O3 or MWCNT, especially at high concentrations. Likewise, it was reported that surfactant concentration has an influence but in a different way. Based on the reviewed literature, it is evident that the wettability of nanofluids is much less discussed compared to rheological and thermal properties. In addition, the few works available are reporting contradicting results and no clear explanation for these results. Also, another factor that is overlooked in the literature is the effect of sonication and nanoparticles' aggregation on the contact angle. In the current study, this effect is studied for the first time, and attempts to explain it are made.
Based on the above-reviewed literature, it is evident that despite the increasing number of research efforts conducted on nanofluid properties and stability, there are still gaps that require investigation. For example, the role of the aggregates in altering nanofluid properties is usually overlooked in the literature, even though, in some cases, it shows the most significant contribution. This motivated the inclusion of the interaction between viscosity, wettability, and the aggregates' morphology in our analysis. Also, as noted earlier, another property that needs more attention is nanofluids' wettability and how aggregates' existence, surfactant quantity, MWCNTs concentration, and sonication time affect the nanofluid wettability. In the current study, a novel mechanism is introduced in this regard. Our study offers a platform that deals with nanofluid preparation, characterization, and stability as an inseparable unit. This approach guarantees a complete understanding of nanofluid's unique nature, where all aspects are interconnected.
2. Preparation, characterization, and methodology
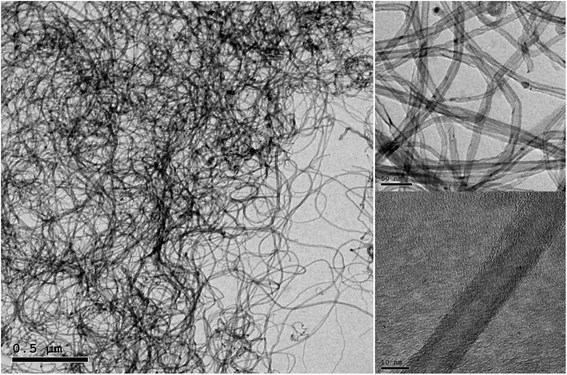
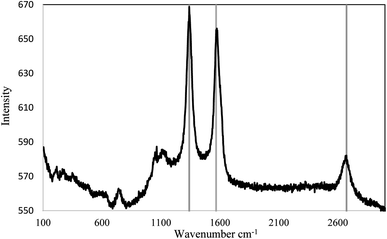
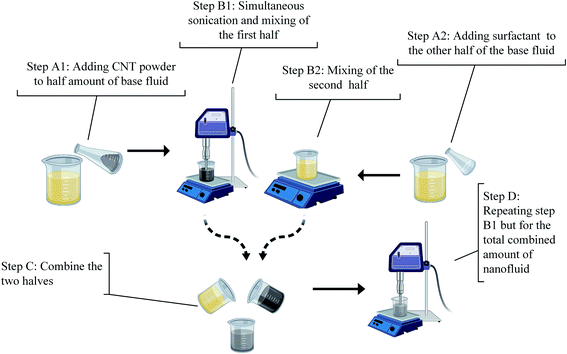
In this study, both mechanical and non-covalent techniques were applied during the preparation process. Since the base fluid used is organic (vegetable oil), Triton X (TRx) with >99% purity purchased from Sigma Aldrich was used, which is a non-ionic surfactant. 70–90% purity Elicarb MWCNTs purchased from Thomas Swan (UK), shown in Fig. 1, with an average diameter between 10–12 nm, and tens of microns lengths were used. Fig. 2 shows the Raman spectroscopy analysis of the pristine MWCNTs. The figure shows three distinctive peaks at 1340, 1568, and 2674 cm−1. These three peaks correspond to the D, G, and G′ bands. The G band is the result of carbon atom vibration along the MWCNTs walls, while the G′ is the second harmonics of the D band. Finally, the peak located at the D band corresponds to impurities and structural damage of the MWCNTs. The quality factor (i.e., the ratio between the G to D band intensities) is 0.98.In the current study, the nanofluid preparation is based on the unzipping mechanism. Initial sonication and then subjecting the MWCNT bundles to surfactants would improve the uniformity of surfactant on the MWCNT and boost its de-agglomeration.19 The procedures described in Fig. 3 were designed to prompt the unzipping mechanism and assure uniform adsorption of the surfactant on the MWCNT surface. Initially, MWCNTs were added to 250 ml of oil and pre-sonicated/mixed. Afterwards, another 250 ml of the oil-surfactant mixture were added, making the total sample volume 500 ml. Finally, the 500 ml sample was re-sonicated/mixed for the second time. Using Q Sonica 700 sonicator, a 15 s pulse on and 15 s pulse off program was used to avoid overheating the sample and the probe during sonication. The average sonication energies for pre-sonication and second sonication are shown in (Table 1).
| Time [min] | Pre-sonication [kilojoule] | Second sonication [kilojoule] |
|---|---|---|
| 2.5 | 13.9 | 18.2 |
| 5 | 26 | 34.6 |
| 15 | 81.7 | 114.4 |
2.1 Characterization of nanofluid
![[thin space (1/6-em)]](https://www.rsc.org/images/entities/char_2009.gif) :
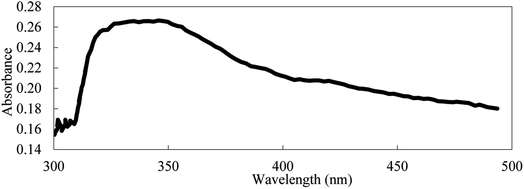
:![[thin space (1/6-em)]](https://www.rsc.org/images/entities/char_2009.gif) 250, as described, for the UV samples, to overcome the high viscosity and opacity of the samples.
250, as described, for the UV samples, to overcome the high viscosity and opacity of the samples.2.2 Methodology: design of experiment and optimization
In the current study, the L9OA design in Table 2 was adopted with three factors (i.e., design variables) and three levels for each factor. The factors and levels were chosen based on the most common values in the literature, as shown in Table 3. Special attention was paid to cover as wide a range as possible, keeping in mind the limitations of available measuring instruments and taking advantage of the non-linear capabilities of the chosen 3 level array. The relation between factors and responses was computed using the response graph (i.e., main effect plot).| Run | MWCNTs concentration (volume%) | Sonication time (min) | Surfactant per MWCNTs (weight ratio) |
|---|---|---|---|
| 1 | 0.1 | 5 | 1![[thin space (1/6-em)]](https://www.rsc.org/images/entities/char_2009.gif) : :![[thin space (1/6-em)]](https://www.rsc.org/images/entities/char_2009.gif) 10 10 |
| 2 | 0.1 | 10 | 1![[thin space (1/6-em)]](https://www.rsc.org/images/entities/char_2009.gif) : :![[thin space (1/6-em)]](https://www.rsc.org/images/entities/char_2009.gif) 1 1 |
| 3 | 0.1 | 30 | 10![[thin space (1/6-em)]](https://www.rsc.org/images/entities/char_2009.gif) : :![[thin space (1/6-em)]](https://www.rsc.org/images/entities/char_2009.gif) 1 1 |
| 4 | 0.4 | 5 | 1![[thin space (1/6-em)]](https://www.rsc.org/images/entities/char_2009.gif) : :![[thin space (1/6-em)]](https://www.rsc.org/images/entities/char_2009.gif) 1 1 |
| 5 | 0.4 | 10 | 10![[thin space (1/6-em)]](https://www.rsc.org/images/entities/char_2009.gif) : :![[thin space (1/6-em)]](https://www.rsc.org/images/entities/char_2009.gif) 1 1 |
| 6 | 0.4 | 30 | 1![[thin space (1/6-em)]](https://www.rsc.org/images/entities/char_2009.gif) : :![[thin space (1/6-em)]](https://www.rsc.org/images/entities/char_2009.gif) 10 10 |
| 7 | 0.7 | 5 | 10![[thin space (1/6-em)]](https://www.rsc.org/images/entities/char_2009.gif) : :![[thin space (1/6-em)]](https://www.rsc.org/images/entities/char_2009.gif) 1 1 |
| 8 | 0.7 | 10 | 1![[thin space (1/6-em)]](https://www.rsc.org/images/entities/char_2009.gif) : :![[thin space (1/6-em)]](https://www.rsc.org/images/entities/char_2009.gif) 10 10 |
| 9 | 0.7 | 30 | 1![[thin space (1/6-em)]](https://www.rsc.org/images/entities/char_2009.gif) : :![[thin space (1/6-em)]](https://www.rsc.org/images/entities/char_2009.gif) 1 1 |
| Factor | Level 1 | Level 2 | Level 3 |
|---|---|---|---|
| X: (ml MWCNT per ml oil%) | 0.1 | 0.4 | 0.7 |
| Y: (sonication time in minutes) | 5 | 10 | 30 |
Z: TRx![[thin space (1/6-em)]](https://www.rsc.org/images/entities/char_2009.gif) : :![[thin space (1/6-em)]](https://www.rsc.org/images/entities/char_2009.gif) MWCNT (ratio between surfactant weight to MWCNTs weight) MWCNT (ratio between surfactant weight to MWCNTs weight) |
1![[thin space (1/6-em)]](https://www.rsc.org/images/entities/char_2009.gif) : :![[thin space (1/6-em)]](https://www.rsc.org/images/entities/char_2009.gif) 10 10 |
1![[thin space (1/6-em)]](https://www.rsc.org/images/entities/char_2009.gif) : :![[thin space (1/6-em)]](https://www.rsc.org/images/entities/char_2009.gif) 1 1 |
10![[thin space (1/6-em)]](https://www.rsc.org/images/entities/char_2009.gif) : :![[thin space (1/6-em)]](https://www.rsc.org/images/entities/char_2009.gif) 1 1 |
The variations in viscosity, UV absorbance with time were calculated as follows:
 | (1) |
While the drop in viscosity due to shear thinning was calculated as follows:
 | (2) |
3. Results and discussion
The measured responses are summarized in Table 4. This section analyzes these responses, starting with the dispersion-stability characteristics followed by a discussion of viscosity then contact angle (property-related characteristics). Throughout the entire discussion, the interaction between both the property-related and the dispersion-stability characteristics are addressed.| Run | UV fresh | UV one day | Viscosity (cP) fresh @ 100 rpm | Viscosity (cP) one day @ 100 rpm | Viscosity (cP) fresh @ 600 rpm | Effective size (nm) fresh | Effective size (nm) one day | Contact angle (degree) |
|---|---|---|---|---|---|---|---|---|
| 1 | 0.23 | 0.01 | 55.6 | 30.0 | 43.8 | 634.9 | 800 | 22 |
| 2 | 0.316 | 0.29 | 83.8 | 89.2 | 71.2 | 430.8 | 500 | 25 |
| 3 | 0.36 | 0.31 | 80.8 | 85.9 | 71.7 | 450 | 460 | 17 |
| 4 | 0.67 | 0.5 | 216.8 | 227.3 | 147.1 | 959.2 | 1200 | 30.6 |
| 5 | 0.55 | 0.4 | 245.4 | 248.3 | 189.2 | 900 | 1120 | 28 |
| 6 | 0.71 | 0.7 | 268.1 | 265.0 | 201.4 | 818 | 1115 | 40 |
| 7 | 0.5 | 0.44 | 244 | 298.8 | 149.7 | 1000 | 1400 | 30 |
| 8 | 0.65 | 0.64 | 219 | 240.8 | 136.0 | 1200 | 1600 | 35 |
| 9 | 0.82 | 0.7 | 293 | 314.3 | 202.2 | 1000 | 1200 | 37 |
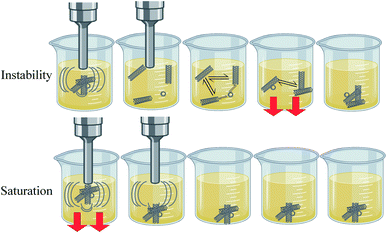
Optimum dispersion is only achieved if all the added powder is broken into the smallest possible size and uniformly distributed throughout the fluid. This is realized when instantaneous sedimentation (saturation phenomena), as discussed in the next section, is eliminated. In addition, uniform dispersion is not guaranteed to last unless stability is also fulfilled. To achieve stability, the van der Waals attraction forces and Brownian collisions should be resisted by electrostatic repulsion forces or steric hindrance. A comparison between instability and dispersion inadequacy (i.e. saturation) is shown in Fig. 5.
3.1 Dispersion and saturation
Increasing MWCNTs concentration is expected to magnify their influence on the physical properties of the nanofluid. Unfortunately, this is not always guaranteed since, in some instances, when the dispersion mechanism is not suitable, aggregates will instantaneously sediment due to their large size and higher density (relative to the base fluid), as shown in Fig. 5. In such cases, the properties of the nanofluid will not be enhanced upon further addition of nanoparticles.3.2 Stability
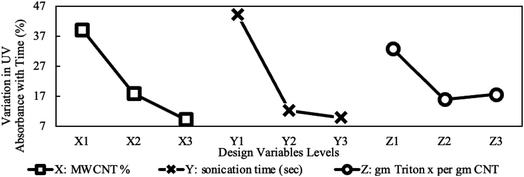
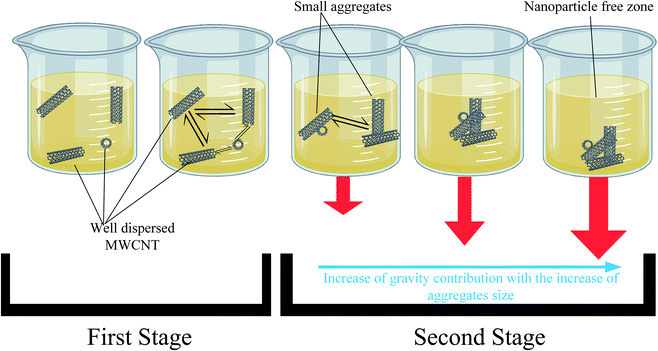
In the current study, the nanofluids stability was investigated by calculating the UV absorbance with time (i.e., after 24 hours) according to eqn (1). Based on Beer–Lambert law, this variation to the UV absorbance is directly related to the change in concentration. According to Stokes law, the sedimentation velocity is affected by several factors, including the size of particles and viscosity. Higher viscosity and smaller particle size will lead to a lower sedimentation rate. To further explain this, the sedimentation process of nanoparticle should be considered. After the nanoparticles are dispersed, their size should be at its smallest value, and according to Stokes law, sedimentation is insignificant. However, under certain conditions, the aggregates will start to form due to van der Waal's forces. In the first stage of the sedimentation process, the effective viscosity and Brownian diffusion overcome the gravitational force wherein during the second stage gravity is dominant and sedimentation becomes significant.Another parameter that affects the sedimentation velocity is the initial particle size. If the dispersion technique used is too weak, the initial size of aggregates is too large and accordingly stage one is skipped and sedimentation (i.e., stage two) starts straight away, which in extreme cases leads to saturated nanofluids, as discussed earlier. Thus, various parameters affect the sedimentation rate differently. The initial particle size is proportional to the sedimentation rate, whereas the viscosity of the nanofluid is inversely related. The influence of these two parameters will be utilized in the next section to explain the variation in effective concentration after one day, as shown in Fig. 8.
![[thin space (1/6-em)]](https://www.rsc.org/images/entities/char_2009.gif) :
:![[thin space (1/6-em)]](https://www.rsc.org/images/entities/char_2009.gif) 1 TRx
1 TRx![[thin space (1/6-em)]](https://www.rsc.org/images/entities/char_2009.gif) :
:![[thin space (1/6-em)]](https://www.rsc.org/images/entities/char_2009.gif) MWCNT. However, excessive surfactant decreases stability due to micelle formation in the bulk fluid after the critical micelle concentration is reached. These micelles grow in size until finally, they start to self-aggregate. Surfactant molecules can also accumulate on the nanoparticle's surfaces, forming dense mono or double layers thus leading to higher sedimentation and lower dispersion due to bridging of adjacent nanoparticles rather than separating them. This explains sedimentation at the highest surfactant loading shown in Fig. 8.
MWCNT. However, excessive surfactant decreases stability due to micelle formation in the bulk fluid after the critical micelle concentration is reached. These micelles grow in size until finally, they start to self-aggregate. Surfactant molecules can also accumulate on the nanoparticle's surfaces, forming dense mono or double layers thus leading to higher sedimentation and lower dispersion due to bridging of adjacent nanoparticles rather than separating them. This explains sedimentation at the highest surfactant loading shown in Fig. 8.3.3 Viscosity
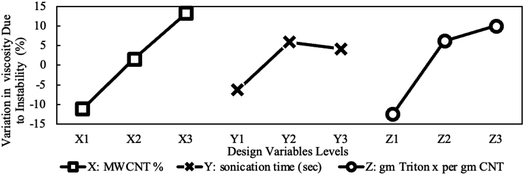
The variation in viscosity-drop due to shear thinning, defined in eqn (2), is presented in Fig. 10 for the studied design variables. The figure shows that viscosity-drop increases as concentration increases also reported in a previous study.23 As discussed earlier, the shear-thinning behavior is due to the breakage or alignment of aggregates, and therefore, it is expected that the viscosity drop due to shear thinning increases if more aggregates exist. Fig. 7 shows that the average particle size increased with concentration. This confirms the existence of more and larger aggregates and explains the higher viscosity-drop at higher concentrations. The opposite can be assumed for sonication time and the surfactant amount. Increasing any of them leads to a decrease in particle size, thus causing a lower viscosity-drop due to shear thinning as shown in Fig. 10. Finally, the MWCNT concentration showed the most noticeable influence on the viscosity drop due to shear thinning. The influence of different preparation factors is quantified as can be seen in the main plot effects in Fig. 10. It is evident that MWCNTs concentration is considered the most significant design variable followed by the sonication time and surfactant concentration.
Fig. 11 exemplifies the false stability mentioned earlier for the highest nanoparticle loading. It shows that 0.7% caused a more substantial increase in viscosity compared to 0.4% even though the 0.7% showed a lower change in concentration as UV absorbance indicates in Fig. 8. As explained earlier, this can be attributed to the higher capabilities of 0.7% sample to hold larger aggregates without sedimentation. The maximum stability achieved by the 0.4% sample suggests that the combination of its moderate aggregate size (less than the 0.7% sample) and moderate effective viscosity (more than the 0.1% sample) add up to maximize stability. Finally, the trend of the surfactant effect in Fig. 11 aligns perfectly with the change in concentration shown earlier in Fig. 8. Fig. 11 also shows that the three studied design variables have comparable importance. However, the MWCNTs concentration and surfactant concentration are the two most significant design variable, while the sonication time is less significant.
3.4 Contact angle
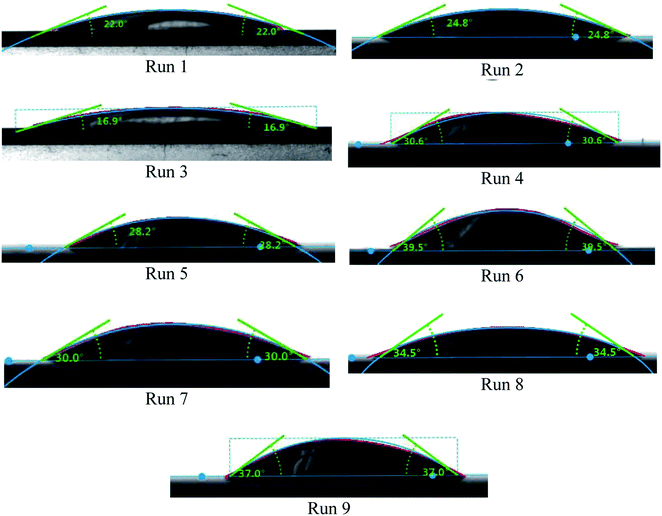
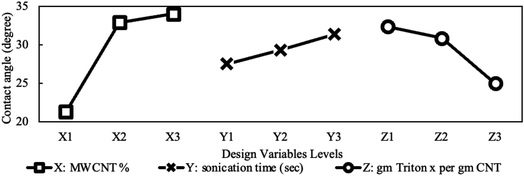
One of the essential properties of any fluid is its wetting behavior. This was analyzed in the present study using contact angle measurements, as presented in Table 4, Fig. 13 and 14.The contact angle is directly related to surface tension. This is a force generated from the cohesion between fluid molecules that minimize the surface of a given droplet volume. The increase in contact angle indicates an increase in this force. Many theories tried to find out the effect of nanoparticles on this force. For functionalized nanoparticles in polar solutions, functionalized groups attached to the surface of MWCNTs was considered as the main driver to increasing the attraction force.27 However, since un-functionalized nanoparticles, as in our case and others, showed the same increase in contact angle, this effect could not be solely responsible for the observed increase in contact angle and surface tension.
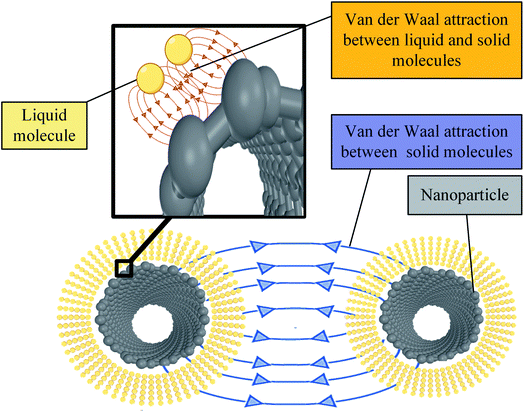
Another factor that could contribute to increasing base fluid molecule adhesion is the formation of nanolayers. The existence of nanoparticles in the base fluid is associated with an ordered layer of base fluid around the nanoparticle. The reason behind this layered fluid formation is due to high particle to liquid molecule interaction force. This force leads to attracting and organizing the liquid molecules in a strong solid-like structure, as shown in Fig. 15. Thus, at this ordered layer, liquid particles are forced to get closer, forming a packed, organized structure that is difficult to disturb. Such a constrained structure can be thought of as an immobilization mechanism for NF droplet spreading (wettability). This is because spreading requires the liquid molecules to be flexible to move around freely and be re-oriented to form a thin film maximizing the wetted surface area. The effect of forming these ordered nanolayers resembles a powerful cohesion force between layered molecules. Additionally, the extra MWCNT to MWCNT van der Waal's attraction force will add to the droplet's internal attraction. This further works on immobilizing the relative motion between different formed nanolayers around different MWCNT particles, thus boosting the fluid cohesion and lowering its wettability.
Another mechanism believed to be playing a role in influencing the contact angle is related to the contact line dynamics. It was proposed that spreading of droplets is controlled by the contact line's displacement on the solid surface as follows, the contact line will spread by moving between adsorption sites until it reaches equilibrium at one of those sites.28 Based on this theory, the increase in the contact angle and accordingly the lower spreading was attributed to roughening of the surface due to pinning of the contact line by the nanoparticles.29 Contrary to this view, other researchers suggested and reported the opposite. For example, it was suggested that nanoparticles enhance the contact line's spreading by a rolling and lubricating effect.30 This point of view is suggested for spherical nanoparticles because of their high rolling capacities. The difference in the form (spherical or tubular) might be the reason behind the different proposed effects. In conclusion, in this study, the two mechanisms related to the cohesion enhancement in Fig. 15 and the contact line pinning were consistent with our findings.
3.5 Multi objective optimization
Due to the conflict between the studied characteristics at different levels of the studied design variables, gray relation analysis (GRA) was adopted. GRA is a flexible and computationally straightforward multi objective optimization technique. Table 5 shows the followed optimization criteria. Concentration and viscosity variations due to instability were set to a minimum is better. The same goes for the nanofluid viscosity. This is to reduce the increase in the pumping power associated with nanoparticles' addition. Finally, the contact angle was set to maximum is better. The higher contact angle can lead to a better lubricating effect due to stronger lubricating film.| Responses | Objective |
|---|---|
| Concentration variation | Minimum is better |
| Viscosity variation | Minimum is better |
| Contact angle fresh | Maximum is better |
| Viscosity fresh | Minimum is better |
A detailed outline of the procedures followed in the present study to calculate the GRC and GRG in Table 6 can be found in ref. 31. Optimum runs for individual responses are shown in italics.. The disagreement of the different optimum runs for each response elucidates the importance of multi-objective optimization.
| Run | GRC | GRG | |||
|---|---|---|---|---|---|
| UV variation | Viscosity drop | Viscosity fresh | CA fresh | ||
| 1 | 0.33 | 1.00 | 0.33 | 0.39 | 0.51 |
| 2 | 0.87 | 0.81 | 0.90 | 0.43 | 0.75 |
| 3 | 0.79 | 0.82 | 0.90 | 0.33 | 0.71 |
| 4 | 0.66 | 0.42 | 0.92 | 0.55 | 0.64 |
| 5 | 0.65 | 0.38 | 1.00 | 0.49 | 0.63 |
| 6 | 1.00 | 0.36 | 0.99 | 1.00 | 0.84 |
| 7 | 0.82 | 0.39 | 0.71 | 0.53 | 0.61 |
| 8 | 0.99 | 0.42 | 0.84 | 0.70 | 0.74 |
| 9 | 0.78 | 0.33 | 0.88 | 0.79 | 0.70 |
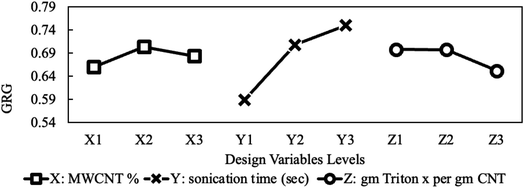
The mean plot effect of the GRG in Fig. 16 indicates that the mid MWCNT concentration, max sonication time showed optimum overall characteristics. It also depicts the adverse effect of using too much surfactant. The figure shows that the sonication time possesses the most influential impact, followed by MWCNT concentration and the surfactant amount, respectively. It is critical to note that optimums presented in Fig. 16 are only valid for the criteria specified in Table 6. If other criteria are desired, the above-mentioned optimums are no longer valid, and the optimization problem must be re-visited.
4. Conclusions
In the present study, the interaction between different nanofluid characteristics was studied with a special focus on aggregates' role and how this role is affected by the preparation factors. Three different preparation factors were tuned, namely, nanoparticle concentration, sonication time, and surfactant amount. The effect of these factors on nanofluid stability, dispersion, rheological properties, and wettability were investigated. The holistic inter-connected approach that was followed allowed an in-depth physical understanding of the nanofluid response to different preparation conditions. Results show a significant influence of aggregates formation and dynamics on nanofluids, which can be summarized in the following points:• Nanofluid saturation can explain the plateau in nanofluid characteristics when the nanoparticle concentration increases to higher values.
• Nanofluid samples with higher sample concentration could show higher sample stability due to their higher viscosity.
• Nanofluid instability can influence the nanofluid viscosity in two distinctive ways (i.e., increase or decrease it) based on aggregation dynamics.
• The aggregate size is directly correlated to the nanofluid degree of shear-thinning.
• Liquid nanolayering and contact line pinning are two valid theories that can be utilized to explain the role of nanoparticles in increasing the nanofluid's contact angle.
• Based on the GRA, nanofluid prepared with mid MWCNT concentration, high sonication time, and low surfactant amount showed optimum characteristics.
Conflicts of interest
There are no conflicts to declare.Acknowledgements
The authors acknowledge the financial support of the Egyptian Academy of Scientific Research and Technology (ASRT), Bridge and Development (JESOR) program.References
- H. Hegab, W. Abdelfattah, S. Rahnamayan, A. Mohany and H. Kishawy, Multi-Objective Optimization During Machining Ti-6Al-4V Using Nano-Fluids, in Progress in Canadian Mechanical Engineering, York University Libraries, 2018, available from: http://hdl.handle.net/10315/35212 Search PubMed.
- H. Hegab, U. Umer, M. Soliman and H. A. Kishawy, Effects of nano-cutting fluids on tool performance and chip morphology during machining Inconel 718, Int. J. Adv. Manuf. Technol., 2018, 96(9–12), 3449–3458 CrossRef.
- H. Hegab, H. A. Kishawy, U. Umer and A. Mohany, A model for machining with nano-additives based minimum quantity lubrication, Int. J. Adv. Manuf. Technol., 2019, 102(5–8), 2013–2028 CrossRef , available from: http://link.springer.com/10.1007/s00170-019-03294-0.
- K. Mala, Y. Jadhav, W. Malik, D. Late, S. I. Patil and S. Jejurikar, Impact of MWCNT passivation on single crystal silicon electrode: an investigation of electrochemical performance and SEI formation, Surf. Interfaces, 2020, 19, 100476 CrossRef CAS , available from: https://linkinghub.elsevier.com/retrieve/pii/S2468023019305942.
- R. B. Sharma, D. J. Late, D. S. Joag, A. Govindaraj and C. N. R. Rao, Field emission properties of boron and nitrogen doped carbon nanotubes, Chem. Phys. Lett., 2006, 428(1–3), 102–108 CrossRef CAS , available from: https://linkinghub.elsevier.com/retrieve/pii/S0009261406009031.
- A. Kaood, M. Abubakr, O. Al-Oran and M. A. Hassan, Performance analysis and particle swarm optimization of molten salt-based nanofluids in parabolic trough concentrators, Renewable Energy, 2021, 177, 1045–1062 CrossRef CAS , available from: https://linkinghub.elsevier.com/retrieve/pii/S0960148121009150.
- O. Al-Oran and F. Lezsovits, A Hybrid Nanofluid of Alumina and Tungsten Oxide for Performance Enhancement of a Parabolic Trough Collector under the Weather Conditions of Budapest, Appl. Sci., 2021, 11(11), 4946 CrossRef , available from: https://www.mdpi.com/2076-3417/11/11/4946.
- M. Khalid, N. M. Mubarak, I. Sopyan, W. Rashmi, A. F. Ismail, A. T. Jameel and et al, ., Stability and thermal conductivity enhancement of carbon nanotube nanofluid using gum arabic, J. Exp. Nanosci., 2011, 6(6), 567–579 CrossRef.
- I. M. Mahbubul, T. H. Chong, S. S. Khaleduzzaman, I. M. Shahrul, R. Saidur, B. D. Long and et al, . Effect of Ultrasonication Duration on Colloidal Structure and Viscosity of Alumina–Water Nanofluid, Ind. Eng. Chem. Res., 2014, 53(16), 6677–6684, DOI:10.1021/ie500705j.
- N. Enomoto, S. Maruyama and Z. Nakagawa, Agglomeration of silica spheres under ultrasonication, J. Mater. Res., 1997, 12(5), 1410–1415 CrossRef CAS , available from: https://www.cambridge.org/core/product/identifier/S088429140003987X/type/journal_article.
- M. Kole and T. K. Dey, Effect of aggregation on the viscosity of copper oxide–gear oil nanofluids, Int. J. Therm. Sci., 2011, 50(9), 1741–1747, DOI:10.1016/j.ijthermalsci.2011.03.027.
- R. Sadri, G. Ahmadi, H. Togun, M. Dahari, S. N. Kazi, E. Sadeghinezhad and et al, ., An experimental study on thermal conductivity and viscosity of nanofluids containing carbon nanotubes, Nanoscale Res. Lett., 2014, 9(1), 151 CrossRef PubMed , available from: http://www.dl.begellhouse.com/journals/46784ef93dddff27,65dad0407c8ce877,4cc83e50526bd05a.html.
- F. Duan, D. Kwek and A. Crivoi, Viscosity affected by nanoparticle aggregation in Al2O3-water nanofluids, Nanoscale Res. Lett., 2011, 6(1), 248 CrossRef PubMed , available from: https://nanoscalereslett.springeropen.com/articles/10.1186/1556-276X-6-248.
- M. A. Khairul, K. Shah, E. Doroodchi, R. Azizian and B. Moghtaderi, Effects of surfactant on stability and thermo-physical properties of metal oxide nanofluids, Int. J. Heat Mass Transfer, 2016, 98, 778–787, DOI:10.1016/j.ijheatmasstransfer.2016.03.079.
- T. Gao, C. Li, Y. Zhang, M. Yang, D. Jia, T. Jin and et al, ., Dispersing mechanism and tribological performance of vegetable oil-based CNT nanofluids with different surfactants, Tribol. Int., 2019, 131, 51–63, DOI:10.1016/j.triboint.2018.10.025.
- S. Vafaei, T. Borca-Tasciuc, M. Z. Podowski, A. Purkayastha, G. Ramanath and P. M. Ajayan, Effect of nanoparticles on sessile droplet contact angle, Nanotechnology, 2006, 17(10), 2523–2527 CrossRef CAS PubMed.
- S. Lim, H. Horiuchi, A. D. Nikolov and D. Wasan, Nanofluids Alter the Surface Wettability of Solids, Langmuir, 2015 Jun 2, 31(21), 5827–5835, DOI:10.1021/acs.langmuir.5b00799.
- S. Tanvir and L. Qiao, Surface tension of Nanofluid-type fuels containing suspended nanomaterials, Nanoscale Res. Lett., 2012, 7(1), 226 CrossRef PubMed , available from: https://nanoscalereslett.springeropen.com/articles/10.1186/1556-276X-7-226.
- M. S. Strano, V. C. Moore, M. K. Miller, M. J. Allen, E. H. Haroz, C. Kittrell and et al, . The Role of Surfactant Adsorption during Ultrasonication in the Dispersion of Single-Walled Carbon Nanotubes, J. Nanosci. Nanotechnol., 2003, 3(1), 81–86 CrossRef CAS PubMed , available from: http://www.ingentaselect.com/rpsv/cgi-bin/cgi?ini=xref%26body=linker%26reqdoi=10.1166/jnn.2003.194.
- H.-H. Perkampus, Photometers and Spectrophotometers, in UV-VIS Spectroscopy and Its Applications, Springer Berlin Heidelberg, Berlin, Heidelberg, 1992, p. 10–25, available from: http://www.springerlink.com/index/10.1007/978-3-642-77477-5_3 Search PubMed.
- J. Chevalier, O. Tillement and F. Ayela, Structure and rheology of SiO2 nanoparticle suspensions under very high shear rates, Phys. Rev. E: Stat., Nonlinear, Soft Matter Phys., 2009, 80(5), 1–7 CrossRef PubMed.
- H. Chen, Y. Ding, A. Lapkin and X. Fan, Rheological behaviour of ethylene glycol-titanate nanotube nanofluids, J. Nanopart. Res., 2009, 11(6), 1513–1520 CrossRef CAS , available from: http://link.springer.com/10.1007/s11051-009-9599-9.
- S. Halelfadl, P. Estellé, B. Aladag, N. Doner and T. Maré, Viscosity of carbon nanotubes water-based nanofluids: influence of concentration and temperature, Int. J. Therm. Sci., 2013, 71, 111–117 CrossRef CAS , available from: https://linkinghub.elsevier.com/retrieve/pii/S129007291300080X.
- E. B. Haghighi, N. Nikkam, M. Saleemi, M. Behi, S. A. Mirmohammadi, H. Poth and et al, ., Shelf stability of nanofluids and its effect on thermal conductivity and viscosity, Meas. Sci. Technol., 2013, 24(10), 105301 CrossRef , available from: http://stacks.iop.org/0957-0233/24/i=10/a=105301?key=crossref.055b3b963231128a276d4565d81f60cc.
- Y. Zhang, C. Li, D. Jia, D. Zhang and X. Zhang, Experimental evaluation of the lubrication performance of MoS2/CNT nanofluid for minimal quantity lubrication in Ni-based alloy grinding, Int. J. Mach. Tool Manufact., 2015, 99, 19–33, DOI:10.1016/j.ijmachtools.2015.09.003.
- J. Chinnam, D. Das, R. Vajjha and J. Satti, Measurements of the contact angle of nanofluids and development of a new correlation, Int. Commun. Heat Mass Transfer, 2015, 62, 1–12, DOI:10.1016/j.icheatmasstransfer.2014.12.009.
- A. Karthikeyan, S. Coulombe and A. M. Kietzig, Wetting behavior of multi-walled carbon nanotube nanofluids, Nanotechnology, 2017, 28(10), 105706 CrossRef CAS PubMed , available from: http://stacks.iop.org/0957-4484/28/i=10/a=105706?key=crossref.c47b12feb5366cc3b9aeb141bdebaf0e.
- T. Blake and J. De Coninck, The influence of solid–liquid interactions on dynamic wetting, Adv. Colloid Interface Sci., 2002, 96(1–3), 21–36 CrossRef CAS PubMed , available from: https://linkinghub.elsevier.com/retrieve/pii/S0001868601000732.
- M. Radiom, C. Yang and W. K. Chan, Characterization of surface tension and contact angle of nanofluids, Proc. SPIE 7522, Fourth International Conference on Experimental Mechanics, 14 April 2010, p. 75221D, DOI:10.1117/12.851278.
- K. Sefiane, J. Skilling and J. MacGillivray, Contact line motion and dynamic wetting of nanofluid solutions, Adv. Colloid Interface Sci., 2008, 138(2), 101–120 CrossRef CAS PubMed.
- A. Panda, A. K. Sahoo and A. K. Rout, Multi-attribute decision making parametric optimization and modeling in hard turning using ceramic insert through grey relational analysis: a case study, Decis. Sci. Lett., 2016, 5(4), 581–592 CrossRef , available from: http://www.growingscience.com/dsl/Vol5/dsl_2016_9.pdf.
| This journal is © The Royal Society of Chemistry 2021 |

