 Open Access Article
Study on extraction methods of polysaccharides from a processed product of Aconitum carmichaeli Debx.
Kuncheng Qiua,
Zunjiang Lia,
Yingxin Longa,
Zhongyu Lua and
Wei Zhu *ab
*ab
aThe Second Clinical College of Guangzhou University of Chinese Medicine, Guangzhou University of Chinese Medicine, Guangzhou 510120, China. E-mail: zhuwei9201@163.com
bGuangdong Provincial Key Laboratory of Clinical Research on Traditional Chinese Medicine Syndrome, China
First published on 16th June 2021
Abstract
Traditional Chinese medicine PaoTianXiong (PTX) is a processed product of Aconitum carmichaeli Debx. with polysaccharide as the main ingredient. The properties of PTX polysaccharide (PTXP) may be affected by different extraction methods. To develop and utilize PTXP better, it is of great significance to study the extraction methods of PTXP. Thus, we extracted PTXPs with dilute alkaline water extraction, ultrasound-assisted extraction, cellulase-assisted extraction, and hot water extraction (HWE), respectively. The characterizations of PTXPs extracted by different methods were analyzed based on purity determination, infrared analysis, molecular weight and monosaccharide composition. And antioxidant experiments of PTXPs were conducted. The results showed that PTXPs extracted by the four extraction methods were all glucan. After purification, the PTXPs showed similar antioxidant activity in vitro. The molecular weight of polysaccharides extracted by the cellulase-assisted method was different from that extracted by the other three methods. Our results showed that not only the yield but also the effect of extraction methods on the properties of PTXP should be considered when selecting the best extraction method. Therefore, HWE was considered to be the best extraction method of PTXP. The yield and purity of purified PTXP were 24.5% and 97.1%, respectively. The optimized extraction conditions were: an extraction temperature of 90 °C, extraction time of 2.17 h, solid–liquid ratio of 1![[thin space (1/6-em)]](https://www.rsc.org/images/entities/char_2009.gif) :
:![[thin space (1/6-em)]](https://www.rsc.org/images/entities/char_2009.gif) 29 (g mL−1), and number of extractions of 2.
29 (g mL−1), and number of extractions of 2.
1 Introduction
Traditional Chinese medicine PaoTianXiong (PTX), one of the processed products of the tuber of Aconitum carmichaeli Debx., is charactered by main active alkaloids and polysaccharides. Processing, an ancient Chinese pharmaceutic technique (including roasting, baking, stir-frying, etc.), aims to reduce the content of toxic alkaloids in PTX.1,2 However, the complex processing process also results in different properties of polysaccharide of PTX (PTXP) extracted from the tuber of Aconitum carmichaeli Debx. In recent years, polysaccharides have attracted much attention because of their various activities, including anti-inflammatory, antioxidant, anti-tumor, immunomodulatory, and other activities.3–7 However, polysaccharides are difficult to synthesize artificially. A reliable extraction method is very important for the development, research and quality control of PTXP.The extraction methods of polysaccharides mainly include hot water extraction (HWE),8 cellulase-assisted extraction (CAE),9 ultrasonic-assisted extraction (UAE),10 dilute alkaline extraction (DAE),11 etc. HWE works by letting water into plant cells to dissolve the polysaccharides which are then extracted by diffusing from a higher concentration to a lower concentration. UAE uses ultrasound to break down plant cell walls, thus accelerating the dissolution and diffusion of the polysaccharides. Different from the UAE, CAE uses enzymes to break down plant cell walls and speeds up the dissolution of polysaccharides. DAE had better extraction efficiency for acidic polysaccharides. Each method has its special advantages and disadvantages in terms of extraction efficiency, economic cost and environmental impact. Besides, according to the research on the structural modification of polysaccharides, the structure of polysaccharides can be changed,12 which is commonly charactered by monosaccharide composition, infrared analysis and molecular weight.13,14 Based on different extraction principles, PTXP extracted by different extraction methods may have different properties. To the best of our knowledge, there is no information on the effect of different extraction methods on the properties of PTXP. In addition, the current research on the extraction technology of polysaccharides mainly takes the extraction yield of polysaccharides as the index but ignores the purity of polysaccharides.10,15,16 We held that the reported polysaccharide activity is not convincing without considering the purity of the polysaccharide. In order to better study, develop and use PTXP, it is very important to research and contrast the extraction methods of PTXP.
Therefore, in the present study, we extracted crude PTXPs with CAE, HWE, DAE and UAE methods, respectively. To improve the purity of PTXP, anion exchange chromatography was used in the screening process of PTXP extraction methods for the first time. Then the characterizations of PTXPs extracted by different methods were analyzed based on infrared analysis, molecular weight and monosaccharide composition. Except for information about the preliminary structural feature, we also conducted in vitro antioxidant experiments to compare the effects of different extraction methods on the activity of PTXP. Based on the above physical and chemical analysis methods, we finally screened the best extraction method of PTXP and then optimized it.
2 Materials and methods
2.1 Chemical and reagents
Cellulase was supported by Dalian Meilun Biological Technology Co., Ltd (Dalian, China). DEAE Sepharose™ fast flow was purchased from GE Healthcare Life Science (Piscataway, NJ, USA). Phenol, potassium persulfate, 1,1-diphenyl-2-picrylhydrazyl (DPPH) were purchased from Shanghai Macklin Biochemical Co., Ltd (Shanghai, China). Sodium hydroxide, ethanol, chloroform, N-butanol, sodium chloride and sulfuric acid were of analytical grade and were obtained from Guangzhou Reagent Co., Ltd (Guangzhou, China). 2,2′-Azino-bis(3-ethylbenzothiazoline-6-sulfonic acid)diammonium salt (ABTS) was purchased from Sigma Life Science (St. Louis, MO, USA). Rhamnose, L-arabinose, L-fucose, DL-xylose, D-mannose, D-glucose, and D-galactose were purchased from Shanghai Yuanye Bio-Technology Co. Ltd (Shanghai, China). All other chemicals and reagents used were of analytical grade.2.2 Plant material
PTX (lot number YPA8C0001) was purchased from Guangzhou medicine company, Chinese medicine Yinpian factory. The preparation method of PTX adopted the unique preparation method of traditional Chinese medicine. Briefly, the tuber of Aconitum carmichaeli Debx. was soaked in sodium chloride solution and then was dried in the sun. This process was repeated until sodium chloride crystals appeared on the surface of the tuber of Aconitum carmichaeli Debx. Subsequently, 1200 mL water was added to 1000 g of the product, and refreshed the water twice a day for a total of five days. Then the product was soaked in 1000 mL water extract of ginger and steamed in a pressure cooker for 1.5 h. After drying at 80 °C, it was stir-fried with hot sand at 210–230 °C until it become brown. The obtained PTX was powdered and sifted through no. 65 mesh before use.2.3 Extraction and purification of PTXPs
![[thin space (1/6-em)]](https://www.rsc.org/images/entities/char_2009.gif) :
:![[thin space (1/6-em)]](https://www.rsc.org/images/entities/char_2009.gif) 15 (g mL−1).
15 (g mL−1).![[thin space (1/6-em)]](https://www.rsc.org/images/entities/char_2009.gif) :
:![[thin space (1/6-em)]](https://www.rsc.org/images/entities/char_2009.gif) 25 (g mL−1).
25 (g mL−1).![[thin space (1/6-em)]](https://www.rsc.org/images/entities/char_2009.gif) :
:![[thin space (1/6-em)]](https://www.rsc.org/images/entities/char_2009.gif) 25 (g
25 (g![[thin space (1/6-em)]](https://www.rsc.org/images/entities/char_2009.gif) :
:![[thin space (1/6-em)]](https://www.rsc.org/images/entities/char_2009.gif) mL), and then pH was adjusted to 4.5 with hydrochloric acid. 150 mg of cellulase was added at the dosage of 6000 U g−1 and extracted at 55 °C for 3 h.
mL), and then pH was adjusted to 4.5 with hydrochloric acid. 150 mg of cellulase was added at the dosage of 6000 U g−1 and extracted at 55 °C for 3 h.![[thin space (1/6-em)]](https://www.rsc.org/images/entities/char_2009.gif) :
:![[thin space (1/6-em)]](https://www.rsc.org/images/entities/char_2009.gif) 21.2 (g
21.2 (g![[thin space (1/6-em)]](https://www.rsc.org/images/entities/char_2009.gif) :
:![[thin space (1/6-em)]](https://www.rsc.org/images/entities/char_2009.gif) mL), and then reflux extraction was conducted at 90 °C for 0.5 h.
mL), and then reflux extraction was conducted at 90 °C for 0.5 h.The PTXP solution extracted by above methods were concentrated to 100 mL, centrifuged at 3000 rpm for 10 min, then anhydrous ethanol was added until the ethanol content was 80%, and the precipitation of PTXP was collected by centrifugation. The precipitated PTXP was dissolved in water and precipitated again with ethanol for another 2 times, and then the protein was removed by the Sevage method. After dialysis and freeze-drying, we obtained four kinds of crude PTXP, named HWE-PTXP, UAE-PTXP, CAE-PTXP and DAE-PTXP.
2.4 Yield and purity determination
The extraction yield (W1) and purity (W3) of crude PTXP were calculated respectively. After purification by anion exchange chromatography, we calculated the extraction yield (W2) and purity (W4) of purified PTXPs. W4 was determined by the phenol-sulfate method.16 The standard curve equation is Y = 0.0052X + 0.1939 (R2 = 0.990). Where X is the concentration of PTXP samples and Y is the absorbance. The equations of W1, W2 and W3 were as follows:where m1 is the mass of crude PTXP obtained, m2 is the mass of extracted PTX, m3 is the mass of purified PTXP, m4 is the mass of crude PTXP used for purification, C0 is the configured sample concentration of purified PTXP, and C1 is the concentration of PTXP calculated by the standard curve. In the formula of W4, 0.9 is the conversion factor.
2.5 Determination of molecular weight
The molecular weight of PTXPs was determined by high performance gel permeation chromatography (HPGPC) using a Waters instrument equipped with tandem Ultrahydrogel 1000 column (300 mm × 7.8 mm i.d., 12 μm) and Ultrahydrogel 500 column (300 mm × 7.8 mm i.d., 10 μm). The samples were dissolved in the mobile phase at 2 mg mL−1, respectively. The mobile phase was 0.02 mol L−1 potassium dihydrogen phosphate at the flow rate of 0.8 mL min−1. The column temperature was 35 °C and the injection volume was 20 μL.2.6 FTIR-ATR analysis
The FTIR-ATR spectra of purified PTXPs were recorded in the range of 600–4000 cm−1 on a Fourier transform spectrometer in combination with a KBr beam splitter. Measurements have been performed in dry atmosphere to avoid dirty contributions.20 The experimental parameters setting of the resolution was 4 cm−1 and the number of the scans was 16 times.2.7 Monosaccharide composition
Under the protection of N2, 10 mg of purified PTXPs were hydrolyzed with 4 mL of 2 mol L−1 trifluoroacetic acid at 120 °C, respectively. Acetylation was then carried out with 10 mg of hydroxylamine hydrochloride and 1 mL of pyridine for 40 min at 90 °C. When the reaction solution was cooled, 1 mL of acetic anhydride was added and heated continuously for 40 min. The acetate derivative was analyzed by GC/MS (Agilent 7890A/5975C, USA) method with a HP-5 capillary column (30 nm × 0.32 mm i.d., film thickness 0.25 mm). The parameters of the instrument were as follows: the initial column temperature was 120 °C (maintained for 3 min), and the temperature was programmed to 220 °C at a rate of 5 °C min−1. Auxiliary heater temperature was 240 °C; the carrier gas was HE, the flow rate was 1 mL min−1, the injection volume was 1 μL, the split ratio was 10![[thin space (1/6-em)]](https://www.rsc.org/images/entities/char_2009.gif) :
:![[thin space (1/6-em)]](https://www.rsc.org/images/entities/char_2009.gif) 1, and the scanning range was 50–550 amu. D-Glucose, D-galactose, D-mannose, D-xylose, rhamnose, L-fucose and L-arabinose were used as the monosaccharide standards and myoinositol was used as the interior standard.21
1, and the scanning range was 50–550 amu. D-Glucose, D-galactose, D-mannose, D-xylose, rhamnose, L-fucose and L-arabinose were used as the monosaccharide standards and myoinositol was used as the interior standard.21
2.8 Antioxidant activity analysis in vitro
![[thin space (1/6-em)]](https://www.rsc.org/images/entities/char_2009.gif) :
:![[thin space (1/6-em)]](https://www.rsc.org/images/entities/char_2009.gif) 1, and then vibrated uniformly and reacted in the dark for 15 min. After the reaction, the absorbance at the wavelength of 517 nm was measured. The sample concentration ranges from 200 to 1000 μg mL−1. The DPPH radical scavenging activity was calculated as follows:
1, and then vibrated uniformly and reacted in the dark for 15 min. After the reaction, the absorbance at the wavelength of 517 nm was measured. The sample concentration ranges from 200 to 1000 μg mL−1. The DPPH radical scavenging activity was calculated as follows:where A0, A1, and A2 are the absorbance of the water with DPPH solution, the sample was mixed with the DPPH solution, and the sample in anhydrous ethanol, respectively.
![[thin space (1/6-em)]](https://www.rsc.org/images/entities/char_2009.gif) :
:![[thin space (1/6-em)]](https://www.rsc.org/images/entities/char_2009.gif) 1. The absorbance was measured at 734 nm after the reaction at room temperature for 15 min. ABTS radical scavenging activity was calculated by the following formula.
1. The absorbance was measured at 734 nm after the reaction at room temperature for 15 min. ABTS radical scavenging activity was calculated by the following formula.where B0, B1, and B2 are the absorbance of the water with ABTS solution, the sample mixed with the ABTS solution, and the sample in distilled water, respectively.
2.9 Optimization of the extraction process by response surface method
HWE method was considered to be the best extraction method of PTXP (analysis process was in results section). The extraction conditions were optimized with the extraction yield of PHWE-PTXP as an index. In this experiment, the standard curve built in Section 2.4 was still used. The calculation formula was as follows:where C is the concentration of PHWE-PTXP measured by the standard curve, V is the volume of the solution of PHWE-PTXP, N is the dilution factor of PHWE-PTXP solution, m is the mass weight of the extracted PHWE-PTXP, and 0.9 is the conversion factor.
![[thin space (1/6-em)]](https://www.rsc.org/images/entities/char_2009.gif) :
:![[thin space (1/6-em)]](https://www.rsc.org/images/entities/char_2009.gif) 10, 1
10, 1![[thin space (1/6-em)]](https://www.rsc.org/images/entities/char_2009.gif) :
:![[thin space (1/6-em)]](https://www.rsc.org/images/entities/char_2009.gif) 15, 1
15, 1![[thin space (1/6-em)]](https://www.rsc.org/images/entities/char_2009.gif) :
:![[thin space (1/6-em)]](https://www.rsc.org/images/entities/char_2009.gif) 20, 1
20, 1![[thin space (1/6-em)]](https://www.rsc.org/images/entities/char_2009.gif) :
:![[thin space (1/6-em)]](https://www.rsc.org/images/entities/char_2009.gif) 25, 1
25, 1![[thin space (1/6-em)]](https://www.rsc.org/images/entities/char_2009.gif) :
:![[thin space (1/6-em)]](https://www.rsc.org/images/entities/char_2009.gif) 30 g
30 g![[thin space (1/6-em)]](https://www.rsc.org/images/entities/char_2009.gif) :
:![[thin space (1/6-em)]](https://www.rsc.org/images/entities/char_2009.gif) mL), extraction temperature (50, 60, 70, 80, 90 °C), extraction time (1, 1.5, 2, 2.5, 3 h), number of extraction (1, 2, 3, 4, 5 times) on the yield of PHWE-PTXP were investigated to screen out the best factor level.
mL), extraction temperature (50, 60, 70, 80, 90 °C), extraction time (1, 1.5, 2, 2.5, 3 h), number of extraction (1, 2, 3, 4, 5 times) on the yield of PHWE-PTXP were investigated to screen out the best factor level.3 Results and discussion
3.1 Yield and purity determination of PTXPs
The yield and purity of PTXPs were shown in Table 1. The extraction yield (W1) order of crude PTXPs was as follows: HWE > DAE > UAE > CAE. After purification by anion exchange chromatography, the extraction yield (W2) order of purified PTXPs was changed to HWE > CAE > UAE > DAE. By comparing W1 and W2, we found that the extraction yield of crude PTXPs decreased significantly after the purification by anion exchange chromatography. Therefore, the extraction yield order of purified PTXPs also changed, which was caused by the difference of the purity of crude PTXPs (W3). After purification, the purity (W4) of purified PTXPs were all above 95%, which laid a foundation for the subsequent experiments. For both crude PTXPs and purified PTXPs, the extraction yield of the HWE method was the highest.![[x with combining macron]](https://www.rsc.org/images/entities/i_char_0078_0304.gif) ± s, n = 3)a
± s, n = 3)a
| W1 | W2 | W3 | W4 | |
|---|---|---|---|---|
| a W1 compared with W2: *P < 0.05, **P < 0.01; DAE, UAE, CAE compared with HWE: #P < 0.05, ##P < 0.01, ###P < 0.001; W3 compared with W4: ΔP < 0.05, ΔΔP < 0.01, ΔΔΔP < 0.001; DAE, UAE, HWE compared with CAE: ∇P < 0.05, ∇∇P < 0.01, ∇∇∇P < 0.001. | ||||
| DAE | 29.4 ± 2.9*### | 15.3 ± 2.5# | 52.1 ± 5.1ΔΔΔ | 95.6 ± 0.9 |
| UAE | 28.4 ± 1.9*# | 18.1 ± 4.0 | 63.8 ± 14.3ΔΔΔ | 96.5 ± 3.0 |
| CAE | 25.2 ± 2.3** | 20.3 ± 1.9 | 80.4 ± 4.5∇∇ | 96.7 ± 0.9 |
| HWE | 38.7 ± 2.0### | 24.5 ± 4.7 | 63.3 ± 9.0ΔΔΔ | 97.1 ± 2.5 |
The activities and extraction yield of crude polysaccharides were often used to screen different extraction methods.23–25 Our results indicated that only the extraction yield or activities of crude polysaccharides were taken as evaluation indicators might be inaccurate in screening different extraction methods. The purity of crude polysaccharides might vary greatly, and crude polysaccharides still contained many small non-polysaccharides molecules, which might interfere with the activities of polysaccharides. Therefore, in our experiment, we used anion exchange chromatography to purify the crude PTXPs. After purification, the PTXPs had high purity, so that the yield could accurately reflect the efficiency of different extraction methods, and the activities of PTXPs could be accurately measured without interference from small molecules.
3.2 Molecular weight of purified PTXPs
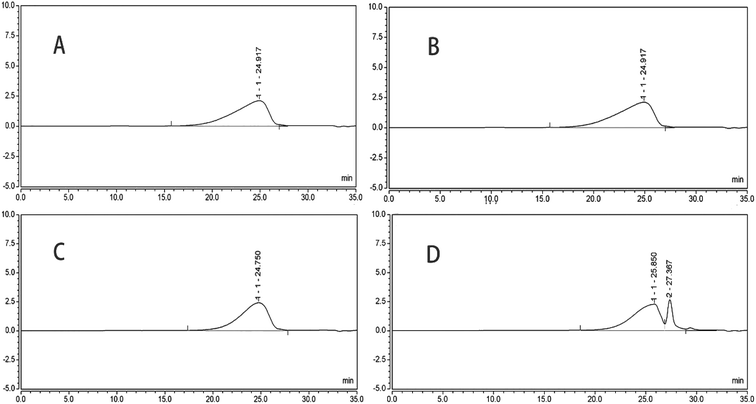
Since crude PTXPs were purified only by anion exchange chromatography, it was difficult to determine the molecular weight accurately. If the molecular weight of polysaccharides was to be determined accurately, they were usually purified by anion exchange chromatography and further separated by gel column chromatography.17,26 But with the help of HPGPC, we could know whether the molecular weight of PTXPs extracted by different extraction methods was different. HPGPC, a type of size exclusion chromatography that separates analytes on the basis of molecular size, is suitable for the analysis of the molecular weight of PTXPs.27 The molecular weight of PTXPs could be compared through the distribution range of retention time and chromatographic peak shape. As shown in Fig. 1A–C, there was almost no difference in the retention time of DAE-PTXP, UAE-PTXP and HWE-PTXP. The chromatographic peak shape of CAE-PTXP was different from the other three (Fig. 1D). The result showed that the CAE method affected the molecular weight of CAE-PTXP in the process of extraction and purification under the conditions of this experiment.3.3 FTIR-ATR analysis of purified PTXPs
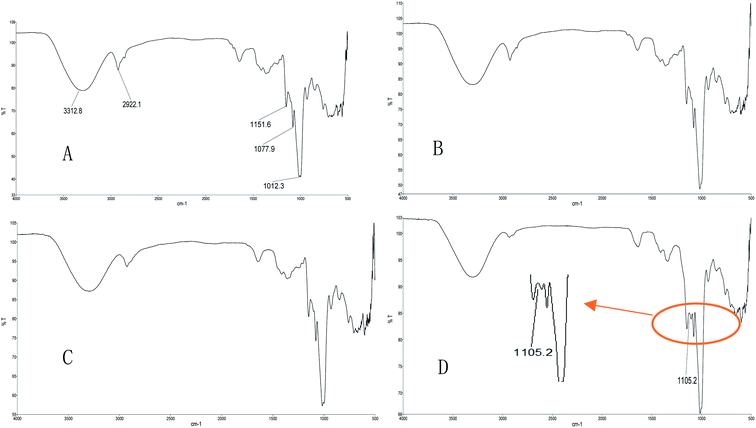
Infrared spectrum scanning can identify the characteristic functional groups in polysaccharides. Taking Fig. 2A as an example, 3312 cm−1 corresponded to the OH stretching vibrations of hydroxyl groups, 2922 cm−1 corresponded to the C–H stretching vibrations of CH2 groups, and 1151, 1077 and 1012 cm−1 indicated that DAE-PTXP was a pyranose. As shown in Fig. 2, the infrared spectrum of DAE-PTXP, UAE-PTXP and HWE-PTXP had no difference. And the infrared spectrum of CAE-PTXP has an additional absorption peak at 1105 cm−1 (Fig. 2D), which might correspond to C–O or C–N stretching vibrations. Thus, it could be seen that CAE did have an impact on the structure of CAE-PTXP.3.4 Monosaccharide composition of purified PTXPs
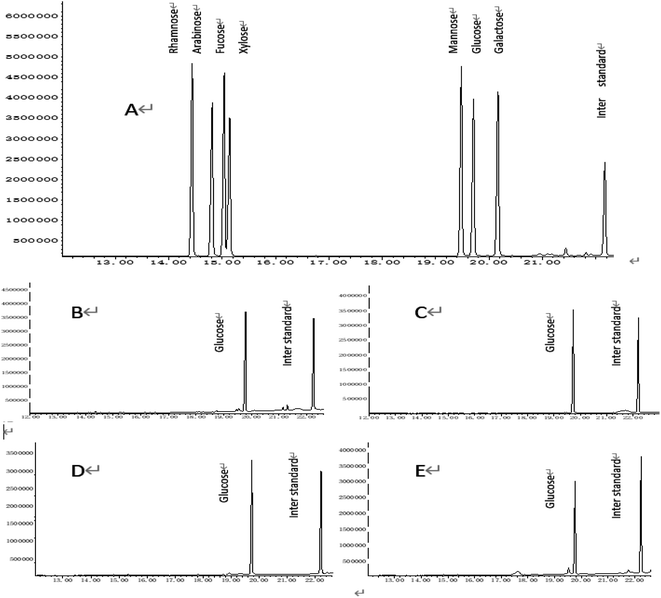
The polysaccharides are complex carbohydrates. Different polysaccharides have different monosaccharide compositions.7 The analysis of monosaccharide composition is an important method to characterize the structure of polysaccharides. But as shown in Fig. 3, DAE-PTXP, UAE-PTXP, HWE-PTXP and CAE-PTXP were all composed of glucose compared to the GC chromatogram of the standards. According to the results of molecular weight determination and infrared spectrum scanning, the effect of CAE on the structure of PTXP was mainly on the molecular weight and some functional groups. In our experiment, the CAE method affected the structure of PTXP, but this does not mean that the CAE method cannot be used to extract PTXP. If the CAE method is to be used, the extraction conditions should be further studied and strictly controlled.3.5 In Vitro antioxidant activity of PTXPs and purified PTXPs
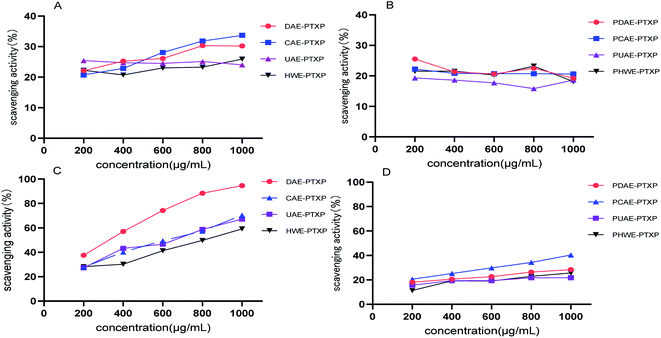
DPPH and ABTS radicals were widely used to evaluate the antioxidant ability of polysaccharides.22,28,29 As shown in Fig. 4A, the scavenging activity of crude polysaccharides DAE-PTXP, CAE-PTXP and HWE-PTXP on DPPH increased gradually when their concentrations increased, and the scavenging rate of UAE-PTXP for DPPH did not change. In general, the scavenging activity order of PTXPs for DPPH free radical was as follows: DAE-PTXP > CAE-PTXP > UAE-PTXP > HWE-PTXP. After purification, the DPPH radical scavenging activity of purified PTXPs was not in a dose-dependent manner (Fig. 4B). At this time, there was no significant difference in DPPH scavenging activity between PDAE-PTXP, PCAE-PTXP and PHWE-PTXP, and the activity was slightly better than that of PCAE-PTXP.As shown in Fig. 4A, the crude PTXPs had good ABTS free radical scavenging activity in a dose-dependent manner, especially polysaccharides DAE-PTXP. The order of scavenging activity was as follows: DAE-PTXP > CAE-PTXP = UAE-PTXP > HWE-PTXP. But after purification, the scavenging activity of purified PTXPs on ABTS free radical was significantly reduced (Fig. 4D). In general, there was no significant difference in ABTS free radical scavenging activity between PDAE-PTXP, PUAE-PTXP and PHWE-PTXP, and their activity was slightly lower than that of PCAE-PTXP.
The results showed that the purity of PTXP had an effect on their antioxidant activities in vitro. If the scavenging activity of crude PTXPs on ABTS free radicals was used to screen the best extraction method among DAE, CAE, UAE and HWE, the DAE method had an obvious advantage. However, the purified PTXPs showed no significant difference in scavenging activity against ABTS and DPPH free radicals. This indicated that the purity of PTXP has a great influence on its antioxidant activity or other activities, and the use of anion-exchange chromatography for purification can be a good solution to this problem. Based on the extraction yield, monosaccharide composition, molecular weight distribution and infrared spectroscopy results, we considered that HWE was the most suitable method for the extraction of PTXP. The structure of PHWE-PTXP was not significantly affected by the HWE method, and its activity was no worse than that of PTXP extracted by other methods. Therefore, the HWE method was optimized in the following experiment.
In the previous experiment, if only considering the extraction yield without detecting the structure of PTXP, we would not find the CAE method under the extraction conditions in this paper could influence the structure of PTXP. And if crude PTXPs were not purified, the DAE method would be mistaken as the best extraction method because of the best ABT-scavenging activity of DAE-PTXP. Our results suggested that the quality of polysaccharides should be controlled also by the structure and activity, rather than just considering the extraction yield before the study of PTXP in depth. Similarly, it is important to study and optimize extraction methods even for other polysaccharides.
3.6 Optimization of the HWE method by response surface method
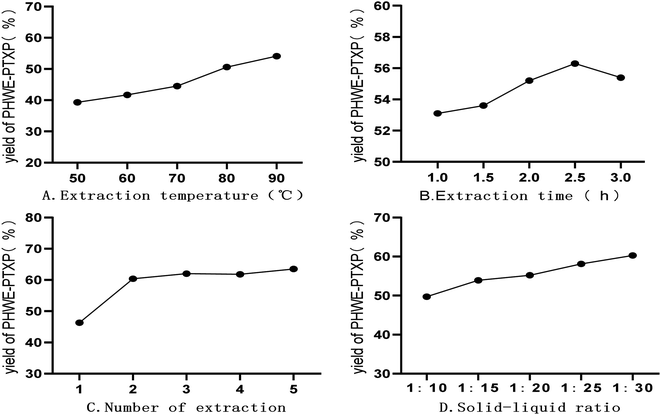 | ||
| Fig. 5 Effects of different independent factors on extraction yield of purified hot water extraction-polysaccharide of PTX (PHWE-PTXP). | ||
As the extraction time changed from 1 h to 3 h, the extraction yield of PHWE-PTXP increased firstly and then decreased, and the extraction yield was the highest at 2.5 h (Fig. 5B). When the extraction time exceeded 2.5 h, the yield of PHWE-PTXP decreased, which might be related to the degradation of PHWE-PTXP. As shown in Fig. 5C, when PHWE-PTXP was extracted only once, the yield was very low. When the extraction times reached more than 2 times, the yield remained at about 60%. At the same time, we could find that when the solid–liquid ratio changed from 1![[thin space (1/6-em)]](https://www.rsc.org/images/entities/char_2009.gif) :
:![[thin space (1/6-em)]](https://www.rsc.org/images/entities/char_2009.gif) 10 to 1
10 to 1![[thin space (1/6-em)]](https://www.rsc.org/images/entities/char_2009.gif) :
:![[thin space (1/6-em)]](https://www.rsc.org/images/entities/char_2009.gif) 30, the yield of HWE-PTXP kept increasing (Fig. 5D).
30, the yield of HWE-PTXP kept increasing (Fig. 5D).
| Y (%) = 56.8 + 2.9X1 + 0.24X2 + 1.68X3 + 11.32X4 − 1.55X1X2 + 0.025X1X3 − 1.43X1X4 + 0.43X2X3 − 1.5X2X4 + 0.075X3X4 + 0.45X12 − 1.66X22 − 1.06X32 − 7.78X42 |
| Independent variables | Factor levels | ||
|---|---|---|---|
| −1 | 0 | 1 | |
| Extraction temperature (°C) | 70 | 80 | 90 |
| Extraction time (h) | 2 | 2.5 | 3 |
Solid–liquid ratio (mL![[thin space (1/6-em)]](https://www.rsc.org/images/entities/char_2009.gif) : :![[thin space (1/6-em)]](https://www.rsc.org/images/entities/char_2009.gif) g) g) |
1![[thin space (1/6-em)]](https://www.rsc.org/images/entities/char_2009.gif) : :![[thin space (1/6-em)]](https://www.rsc.org/images/entities/char_2009.gif) 20 20 |
1![[thin space (1/6-em)]](https://www.rsc.org/images/entities/char_2009.gif) : :![[thin space (1/6-em)]](https://www.rsc.org/images/entities/char_2009.gif) 25 25 |
1![[thin space (1/6-em)]](https://www.rsc.org/images/entities/char_2009.gif) : :![[thin space (1/6-em)]](https://www.rsc.org/images/entities/char_2009.gif) 30 30 |
| Number of extraction | 1 | 2 | 3 |
| Run | Extraction temperature (°C) | Extraction time (h) | Solid–liquid ratio (g![[thin space (1/6-em)]](https://www.rsc.org/images/entities/char_2009.gif) : :![[thin space (1/6-em)]](https://www.rsc.org/images/entities/char_2009.gif) mL) mL) |
Number of extraction | Extraction yield (%) |
|---|---|---|---|---|---|
| 1 | −1 | 0 | 0 | −1 | 33.6 |
| 2 | 0 | 1 | 0 | 1 | 60.1 |
| 3 | 0 | 0 | 0 | 0 | 56.9 |
| 4 | 0 | −1 | 0 | 1 | 60.4 |
| 5 | 0 | −1 | 1 | 0 | 55.3 |
| 6 | 0 | 0 | 1 | 1 | 60.2 |
| 7 | 0 | 1 | 1 | 0 | 57.5 |
| 8 | 0 | −1 | −1 | 0 | 51.3 |
| 9 | −1 | 0 | 0 | 1 | 56.1 |
| 10 | −1 | 0 | −1 | 0 | 53.8 |
| 11 | 0 | 1 | −1 | 0 | 51.8 |
| 12 | 0 | 0 | 0 | 0 | 55.6 |
| 13 | 0 | 0 | 0 | 0 | 57.9 |
| 14 | 0 | −1 | 0 | −1 | 33.3 |
| 15 | −1 | 1 | 0 | 0 | 52.4 |
| 16 | 1 | 0 | 0 | 1 | 62.3 |
| 17 | −1 | 0 | 1 | 0 | 57.3 |
| 18 | 1 | −1 | 0 | 0 | 60.4 |
| 19 | −1 | −1 | 0 | 0 | 51.9 |
| 20 | 1 | 0 | −1 | 0 | 56.7 |
| 21 | 0 | 0 | −1 | 1 | 58.4 |
| 22 | 1 | 1 | 0 | 0 | 54.7 |
| 23 | 1 | 0 | 0 | −1 | 45.5 |
| 24 | 0 | 1 | 0 | −1 | 39.0 |
| 25 | 0 | 0 | 1 | −1 | 35.9 |
| 26 | 1 | 0 | 1 | 0 | 60.3 |
| 27 | 0 | 0 | −1 | −1 | 34.4 |
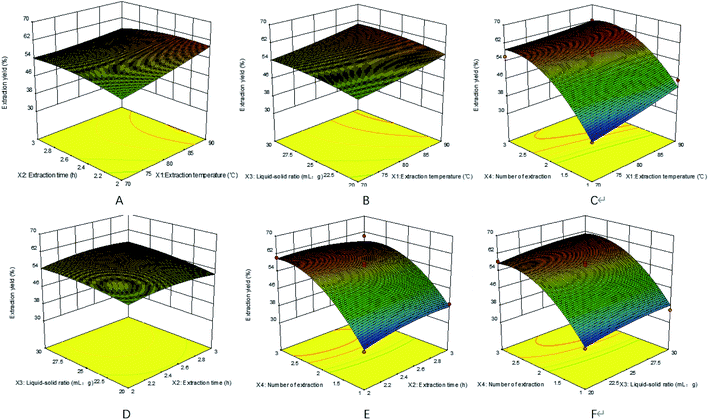
We used F-test and ANOVA analysis to estimate the significance and applicability of the regression model (Table 4). The regression model of PHWE-PTXP yield was extremely significant (P < 0.0001), the correlation coefficient (R2) was 0.9696 and the lack of fit had no significant effect (P > 0.05). The results showed that the model represented the data satisfactorily. It could be seen that X1, X3, X4 and X42 had a significant effect on the extraction yield of HWE-PTXP.
| Source | Sum of squares | df | Mean square | F value | P-value prob > F | |
|---|---|---|---|---|---|---|
| Model | 2081.269 | 14 | 148.662 | 27.340 | <0.0001 | Significant |
| X1 | 100.920 | 1 | 100.920 | 18.560 | 0.0010 | |
| X2 | 0.701 | 1 | 0.701 | 0.129 | 0.7258 | |
| X3 | 33.668 | 1 | 33.668 | 6.192 | 0.0285 | |
| X4 | 1536.803 | 1 | 1536.803 | 282.627 | <0.0001 | |
| X1X2 | 9.610 | 1 | 9.610 | 1.767 | 0.2084 | |
| X1X3 | 0.003 | 1 | 0.003 | 0.000 | 0.9832 | |
| X1X4 | 8.122 | 1 | 8.122 | 1.494 | 0.2451 | |
| X2X3 | 0.722 | 1 | 0.722 | 0.133 | 0.7218 | |
| X2X4 | 9.000 | 1 | 9.000 | 1.655 | 0.2225 | |
| X3X4 | 0.023 | 1 | 0.023 | 0.004 | 0.9498 | |
| X12 | 1.080 | 1 | 1.080 | 0.199 | 0.6638 | |
| X22 | 14.741 | 1 | 14.741 | 2.711 | 0.1256 | |
| X32 | 6.021 | 1 | 6.021 | 1.107 | 0.3134 | |
| X42 | 322.403 | 1 | 322.403 | 59.292 | <0.0001 | |
| Residual | 65.251 | 12 | 5.438 | |||
| Lack of fit | 62.591 | 10 | 6.259 | 4.706 | 0.1879 | Not significant |
| Pure error | 2.660 | 2 | 1.330 | |||
| Cor total | 2146.520 | 26 | ||||
| R2 | 0.9696 |
![[thin space (1/6-em)]](https://www.rsc.org/images/entities/char_2009.gif) :
:![[thin space (1/6-em)]](https://www.rsc.org/images/entities/char_2009.gif) 28.5, the number of extraction was 2.69, and the maximum predicted extraction yield was 64.61%. Considering the feasibility and convenience in the actual operation, the actual conditions were changed slightly: the extraction temperature was 90 °C, the extraction time was 2.17 h, the solid–liquid ratio was 1
28.5, the number of extraction was 2.69, and the maximum predicted extraction yield was 64.61%. Considering the feasibility and convenience in the actual operation, the actual conditions were changed slightly: the extraction temperature was 90 °C, the extraction time was 2.17 h, the solid–liquid ratio was 1![[thin space (1/6-em)]](https://www.rsc.org/images/entities/char_2009.gif) :
:![[thin space (1/6-em)]](https://www.rsc.org/images/entities/char_2009.gif) 29, the number of extraction was 2. Under these conditions, the yield of HWE-PTXP was 63.1%, which was only 1.5% different from 64.61%. The analysis result showed that the experimental values were in good agreement with the predicted values, and also suggested the established model was satisfactory and accurate.
29, the number of extraction was 2. Under these conditions, the yield of HWE-PTXP was 63.1%, which was only 1.5% different from 64.61%. The analysis result showed that the experimental values were in good agreement with the predicted values, and also suggested the established model was satisfactory and accurate.
4 Conclusion
In the present study, the effect of DAE, UAE, CAE and HWE on yield, characteristics, and antioxidant activities of PTXPs were investigated to determine the optimal extraction method. The results showed that CAE-PTPX, HWE-PTXP, UAE-PTXP and DAE-PTXP had the same monosaccharide composition. They all have the typical characteristics of polysaccharides based on infrared analysis but CAE-PTPX was slightly different from the other three. The molecular weight of CAE-PTXP was also different from HWE-PTXP, UAE-PTXP and DAE-PTXP. In addition, the purity and antioxidant activity of crude PTXPs were significantly different from that of purified PTXPs. These results indicated that the properties of PTXPs extracted by different extraction methods were different. In the process of extracting PTXP, not only the extraction yield but also the effects of different extraction methods on the properties should be considered. When the activity and structure of polysaccharides were determined, the purity of PTXPs should not be ignored, which supported our previous points. The HWE had the highest extraction yield and had little effect on the properties of PTXP, so it was considered to be the best extraction method of PTXP. Next, with the help of the optimized HWE, we will conduct an in-depth study on the biological activity of PTXP.Author contributions
Kuncheng Qiu: conceptualization, methodology, investigation, writing-original draft. Zunjiang Li: methodology, investigation, formal analysis. Yingxin Long: investigation, validation, visualization. Zhongyu Lu: software, validation. Wei Zhu: conceptualization, funding acquisition, supervision, writing-review & editing, project administration.Conflicts of interest
The authors declare that they have no known competing financial interests or personal relationships that could have appeared to influence the work reported in this paper.Acknowledgements
This work was supported by the special foundation of Guangzhou Key Laboratory (No. 202002010004); Science and Technology Planning Project of Guangdong Province (2017B030314166), Guangdong Provincial Hospital of Chinese Medicine Science and Technology Research Program (YN2019MJ11).References
- X. Wu, S. Wang, J. Lu, Y. Jing, M. Li, J. Cao, B. Bian and C. Hu, Chin. Med., 2018, 13, 4 CrossRef PubMed.
- E. Nyirimigabo, Y. Xu, Y. Li, Y. Wang, K. Agyemang and Y. Zhang, J. Pharm. Pharmacol., 2015, 67, 1–19 CrossRef CAS PubMed.
- S. G. Sousa, L. A. Oliveira, D. de Aguiar Magalhaes, T. V. de Brito, J. A. Batista, C. M. C. Pereira, M. de Souza Costa, J. C. R. Mazulo, M. de Carvalho Filgueiras, D. F. P. Vasconselos, D. A. da Silva, F. C. N. Barros, V. G. Sombra, A. L. P. Freitas, R. C. M. de Paula, J. P. de Andrade Feitosa and A. L. Dos Reis Barbosa, Carbohydr. Polym., 2018, 197, 515–523 CrossRef CAS PubMed.
- G. Huang, X. Mei and J. Hu, Curr. Drug Targets, 2017, 18, 1296–1300 CAS.
- Y. Fu, L. Shi and K. Ding, Int. J. Biol. Macromol., 2019, 141, 693–699 CrossRef CAS PubMed.
- C. Y. Shen, J. J. Jiang, M. Q. Li, C. Y. Zheng and W. Zhu, J. Funct. Foods, 2017, 35, 352–362 CrossRef CAS.
- C. Y. Shen, W. L. Zhang and J. G. Jiang, J. Funct. Foods, 2017, 34, 118–129 CrossRef CAS.
- H. Feng and L. Tian, Molecules, 2021, 26, 2359 CrossRef CAS PubMed.
- Z. G. Qian, Carbohydr. Polym., 2014, 101, 432–434 CrossRef CAS PubMed.
- J. Gu, Q. Li, J. Liu, Z. Ye, T. Feng, G. Wang, W. Wang and Y. Zhang, Int. J. Biol. Macromol., 2021, 167, 423–433 CrossRef CAS PubMed.
- Z. He, Y. Zhu, X. Bao, L. Zhang, N. Li, G. Jiang and Q. Peng, Molecules, 2019, 24, 2221 CrossRef CAS PubMed.
- F. Chen and G. Huang, Int. J. Biol. Macromol., 2018, 112, 211–216 CrossRef CAS PubMed.
- Y. Han, Y. Wu, G. Li, M. Li, R. Yan, Z. Xu, H. Lei, Y. Sun, X. Duan, L. Hu and R. Huang, Food Chem., 2021, 342, 128537 CrossRef CAS PubMed.
- H. Wang, J. Chen, P. Ren, Y. Zhang and S. Omondi Onyango, Ultrason. Sonochem., 2021, 70, 105355 CrossRef CAS PubMed.
- T. Wang, H. Zhao, Y. Bi and X. Fan, J. Food Sci., 2021, 86, 977–986 CrossRef CAS PubMed.
- Y. B. Ji and F. L. Wang, Bioengineered, 2021, 12, 382–391 CrossRef CAS PubMed.
- X. Yang, Y. Wu, C. Zhang, S. Fu, J. Zhang and C. Fu, Int. J. Biol. Macromol., 2020, 143, 314–324 CrossRef CAS PubMed.
- W. L. Chen, L. H. Xiao, W. Zhu and J. Qin, J. Northwestern Pharm., 2018, 33, 584–588 Search PubMed.
- C. Zhao, M. Li, Y. Luo and W. Wu, Carbohydr. Res., 2006, 341, 485–491 CrossRef CAS PubMed.
- R. Stancanelli, R. Ficarra, C. Cannava, M. Guardo, M. L. Calabro, P. Ficarra, R. Ottana, R. Maccari, V. Crupi, D. Majolino and V. Venuti, J. Pharm. Biomed. Anal., 2008, 47, 704–709 CrossRef CAS PubMed.
- Y. Chen, M. Y. Xie, Y. X. Wang, S. P. Nie and C. Li, Phytochem. Anal., 2009, 20, 503–510 CrossRef CAS PubMed.
- P. Rozi, A. Abuduwaili, P. Mutailifu, Y. Gao, R. Rakhmanberdieva, H. A. Aisa and A. Yili, Int. J. Biol. Macromol., 2019, 131, 97–106 CrossRef CAS PubMed.
- G. Chen, C. Fang, C. Ran, Y. Tan, Q. Yu and J. Kan, Int. J. Biol. Macromol., 2019, 130, 903–914 CrossRef CAS PubMed.
- H. Dong, S. Lin, Q. Zhang, H. Chen, W. Lan, H. Li, J. He and W. Qin, Int. J. Biol. Macromol., 2016, 93, 179–185 CrossRef CAS PubMed.
- S. Jia, F. Li, Y. Liu, H. Ren, G. Gong, Y. Wang and S. Wu, Int. J. Biol. Macromol., 2013, 62, 66–69 CrossRef CAS PubMed.
- J. Song, Y. Wu, X. Ma, L. Feng, Z. Wang, G. Jiang and H. Tong, Carbohydr. Polym., 2020, 230, 115586 CrossRef CAS PubMed.
- J. Xu, S. L. Li, R. Q. Yue, C. H. Ko, J. M. Hu, J. Liu, H. M. Ho, T. Yi, Z. Z. Zhao, J. Zhou, P. C. Leung, H. B. Chen and Q. B. Han, Anal. Bioanal. Chem., 2014, 406, 6409–6417 CrossRef CAS PubMed.
- S. N. Li, S. H. Tang, Q. He, J. X. Hu and J. Zheng, J. Dairy Sci., 2020, 103, 1120–1130 CrossRef CAS PubMed.
- T. L. Gunathilaka, K. W. Samarakoon, P. Ranasinghe and L. D. C. Peiris, Molecules, 2019, 24, 3708 CrossRef CAS PubMed.
- K. Qiu, Z. Li, C. Li, H. Huang and W. Zhu, J. Funct. Foods, 2020, 71, 104036 CrossRef CAS.
- Z. Y. Zhang, D. D. Gui, M. Sha, J. Liu and H. Y. Wang, J. Dairy Sci., 2019, 102, 68–76 CrossRef CAS PubMed.
| This journal is © The Royal Society of Chemistry 2021 |


