
 Open Access Article
 This Open Access Article is licensed under a Creative Commons Attribution-Non Commercial 3.0 Unported Licence
The study of zirconium vanadate as a cathode material for lithium ion batteries
Baohe Yuan a,
Lilei Zhangb,
Xianghong Gecd,
Heng Qia,
Qi Xua,
Lulu Chena,
Erjun Liang*c,
Baojun Li*c and
Juan Guoc
a,
Lilei Zhangb,
Xianghong Gecd,
Heng Qia,
Qi Xua,
Lulu Chena,
Erjun Liang*c,
Baojun Li*c and
Juan Guoc
aNorth China University of Water Resources and Electric Power, Zhengzhou, 450011, China
bHenan Institute of Science and Techenology, Xinxiang, 453000, China
cZhengzhou University, Zhengzhou, 450052, China. E-mail: ejliang@zzu.edu.cn
dCollege of Science, Zhongyuan University of Technology, Zhengzhou, 450007, China
First published on 5th July 2021
Abstract
The electrochemical properties of ZrV2O7 (ZVO) and ZVO@C were investigated in lithium ion batteries. The first charge (or discharge) specific capacity of ZVO and ZVO@C are 279 mA h g−1, 392 mA h g−1, 208 mA h g−1 and 180 mA h g−1 for 0%, 3%, 5% and 9% of carbon, respectively. The capacity retention rates (with 0% 3%, 5% and 9% carbon content) are 33.0%, 52.5%, 56.4% and 76.1% after ten cycles, respectively. The low inner resistance relates to the good contact of the electrode rather than the high content of carbon, and the specific capacity retention rate increases with the increase of the carbon content.
1. Introduction
As energy issues are getting more and more serious, researchers are searching for alternative energies such as solar, ocean, wind and geothermal energy.1–4 It is important to develop efficient and environmentally friendly energy storage systems. Among the energy storage devices, rechargeable lithium ion batteries (LIBs) are one of the most promising candidates for these applications owing to some obvious advantages, such as their high energy efficiency, long cycle life and environmental friendliness.5–8 Li ions shuttle between the anode and cathodes during charge and discharge cycles. Many kinds of materials have been developed as electrode materials for LIBs, such as carbon,9 oxide materials10–13 alloy materials,14,15 and so on. The theoretical specific capacity of silicon is as high as 4200 mA h g−1 but the volume changes greatly when charging and discharging, which could lead to the collapse of the material’s structure.16,17 Because of the poor cycling stability of the Si electrode, its application is limited. The development of LIBs requires the development of electrode materials with good thermal stability and small volume changes, and they must have a low cost.Li ions can be reversibly intercalated into the layered compound Li1−δV1+δO2 at a potential of 0.1 V versus Li+/Li.6–8 When LiNi0.5Mn1.5O4 as the cathode is combined with Li3VO4 as the anode, the LIB with a favorable voltage of 3.7 V demonstrated a practical estimated energy density of 205 W h kg−1.18 Vanadium oxides, such as V2O5, belong to the transition metal oxide family, which are often employed for secondary LIBs to improve the specific capacity19–21 and also as LIB anodes.22–26 A vanadium oxide carbon cloth structure showed a record high cycling stability.27 As electrode materials for LIBs, compounds containing V are required to have good stability, low energy losses and large specific capacities in the process of circulation.
Zirconium vanadate (ZrV2O7) has a cubic crystal structure, with structural phase transitions at 350 and 375 K.28,29 It has been researched due to its isotropic negative thermal expansion (NTE).30–32 We found that ZrV2O7 (ZVO) had an electrical conductivity which was significantly larger than those of other NTE ceramics.33 There is the polyvalent metal V in ZVO, which means that it could be used as electrode in LIBs. And the framework structure of ZVO could have ionic and electronic conductivity, which can reduce the energy loss in LIBs. The structural stability of the LiNi0.6Co0.2Mn0.2O2 cathode is enhanced by ZVO.34
In this work, ZVO was used as an electrode material in LIBs. As a contrast, a carbon coating operation was carried out. The electrochemical performance and stability were studied. The excellent electrochemical performance and low thermal expansion properties make it a superior alternative electrode for next-generation, highly safe, high power batteries.
2. Experimental details
Analytical grade ZrO2 (99.0%) and V2O5 (99.0%) were mixed at a Zr![[thin space (1/6-em)]](https://www.rsc.org/images/entities/char_2009.gif) :V = 1:2 molar ratio and then ground for 2 h in an agate mortar. The homogenized raw materials were pressed into 10 × 2.5 mm (diameter × height) pellets, sintered in a tubular furnace at a 5 K min−1 heating rate, held at 750 °C for 2–5 h and then cooled naturally to RT. For comparison, we prepared the ZVO material with a carbon coating (ZVO@C). Glucose and ZVO powder were mixed at 0.03:1, 0.05:1 and 0.09:1 weight ratios and then ground for 2 h in an agate mortar. The homogenized materials were sintered at 100% power in a microwave oven (800 W) for 5 minutes. After cooling to room temperature naturally, the resulting solid was ground for 0.5 h again. Black ZVO@C powders were obtained.
:V = 1:2 molar ratio and then ground for 2 h in an agate mortar. The homogenized raw materials were pressed into 10 × 2.5 mm (diameter × height) pellets, sintered in a tubular furnace at a 5 K min−1 heating rate, held at 750 °C for 2–5 h and then cooled naturally to RT. For comparison, we prepared the ZVO material with a carbon coating (ZVO@C). Glucose and ZVO powder were mixed at 0.03:1, 0.05:1 and 0.09:1 weight ratios and then ground for 2 h in an agate mortar. The homogenized materials were sintered at 100% power in a microwave oven (800 W) for 5 minutes. After cooling to room temperature naturally, the resulting solid was ground for 0.5 h again. Black ZVO@C powders were obtained.
The crystal phase structure of the as-prepared ZVO was examined using a Bruker D8 Advance X-ray diffractometer. Raman spectra were recorded by a Renishaw inVia Raman spectrometer with 532 nm excitation. The morphological structures of the samples were characterized by scanning electron microscopy (SEM, SIGMA, 300/VP) and energy dispersive X-ray spectrometry (Oxford Instruments). The differential scanning calorimetry (DSC) study was done on a LABSYS TM in the temperature range of room temperature (RT)–600 °C with heating and cooling rates of 10 °C min−1. The textural properties of the samples were analyzed by N2 adsorption–desorption measurements (JWGB 100C) under a liquid nitrogen environment.
The half battery electrodes were prepared with ZVO and ZVO@C. Lithium foil was used as the counter electrode. The as-prepared materials were blended with polyvinylidene (PVDF) as a binder and the additives Super-P at a weight ratio of 8:1:1, then the mixture was uniformly pasted on pure aluminum foils, which were cut into disks after being dried at 120 °C for 24 h. The batteries were assembled in an argon-filled glove box. The batteries were based on the ZVO/electrolyte/Li structure with a liquid electrolyte. Then, the batteries were aged for longer than 48 h before measurement.
Cyclic voltammetry (CV) tests and electrochemical impedance spectroscopy (EIS) measurements were performed on an electrochemical workstation (CHI660E). A galvanostatic cycling test was carried out on a NEWWARE battery (BS-9300 K) system. All of the tests were performed at room temperature.
3. Results
The XRD patterns of ZVO and ZVO@C are shown in Fig. 1(a). The diffraction peaks are sharp, which indicates that the samples are well crystallized. The diffraction peaks of ZVO match well with those of ZrV2O7 (JCPDs card no. 01-088-0587), which agrees well with previous reports. ZVO is crystallized in a cubic framework structure. In addition to the characteristic peaks of ZVO, the main diffraction peaks of metallic Al are clearly seen (from the current collector of aluminum foil). As a comparison, the diffraction pattern of ZVO@C agrees with that of ZVO, which means that the process of carbon coating has not changed the crystal structure, and the framework structure is retained well. There is a wave packet between 20–40°, which could be attributed to the diffraction of amorphous carbon.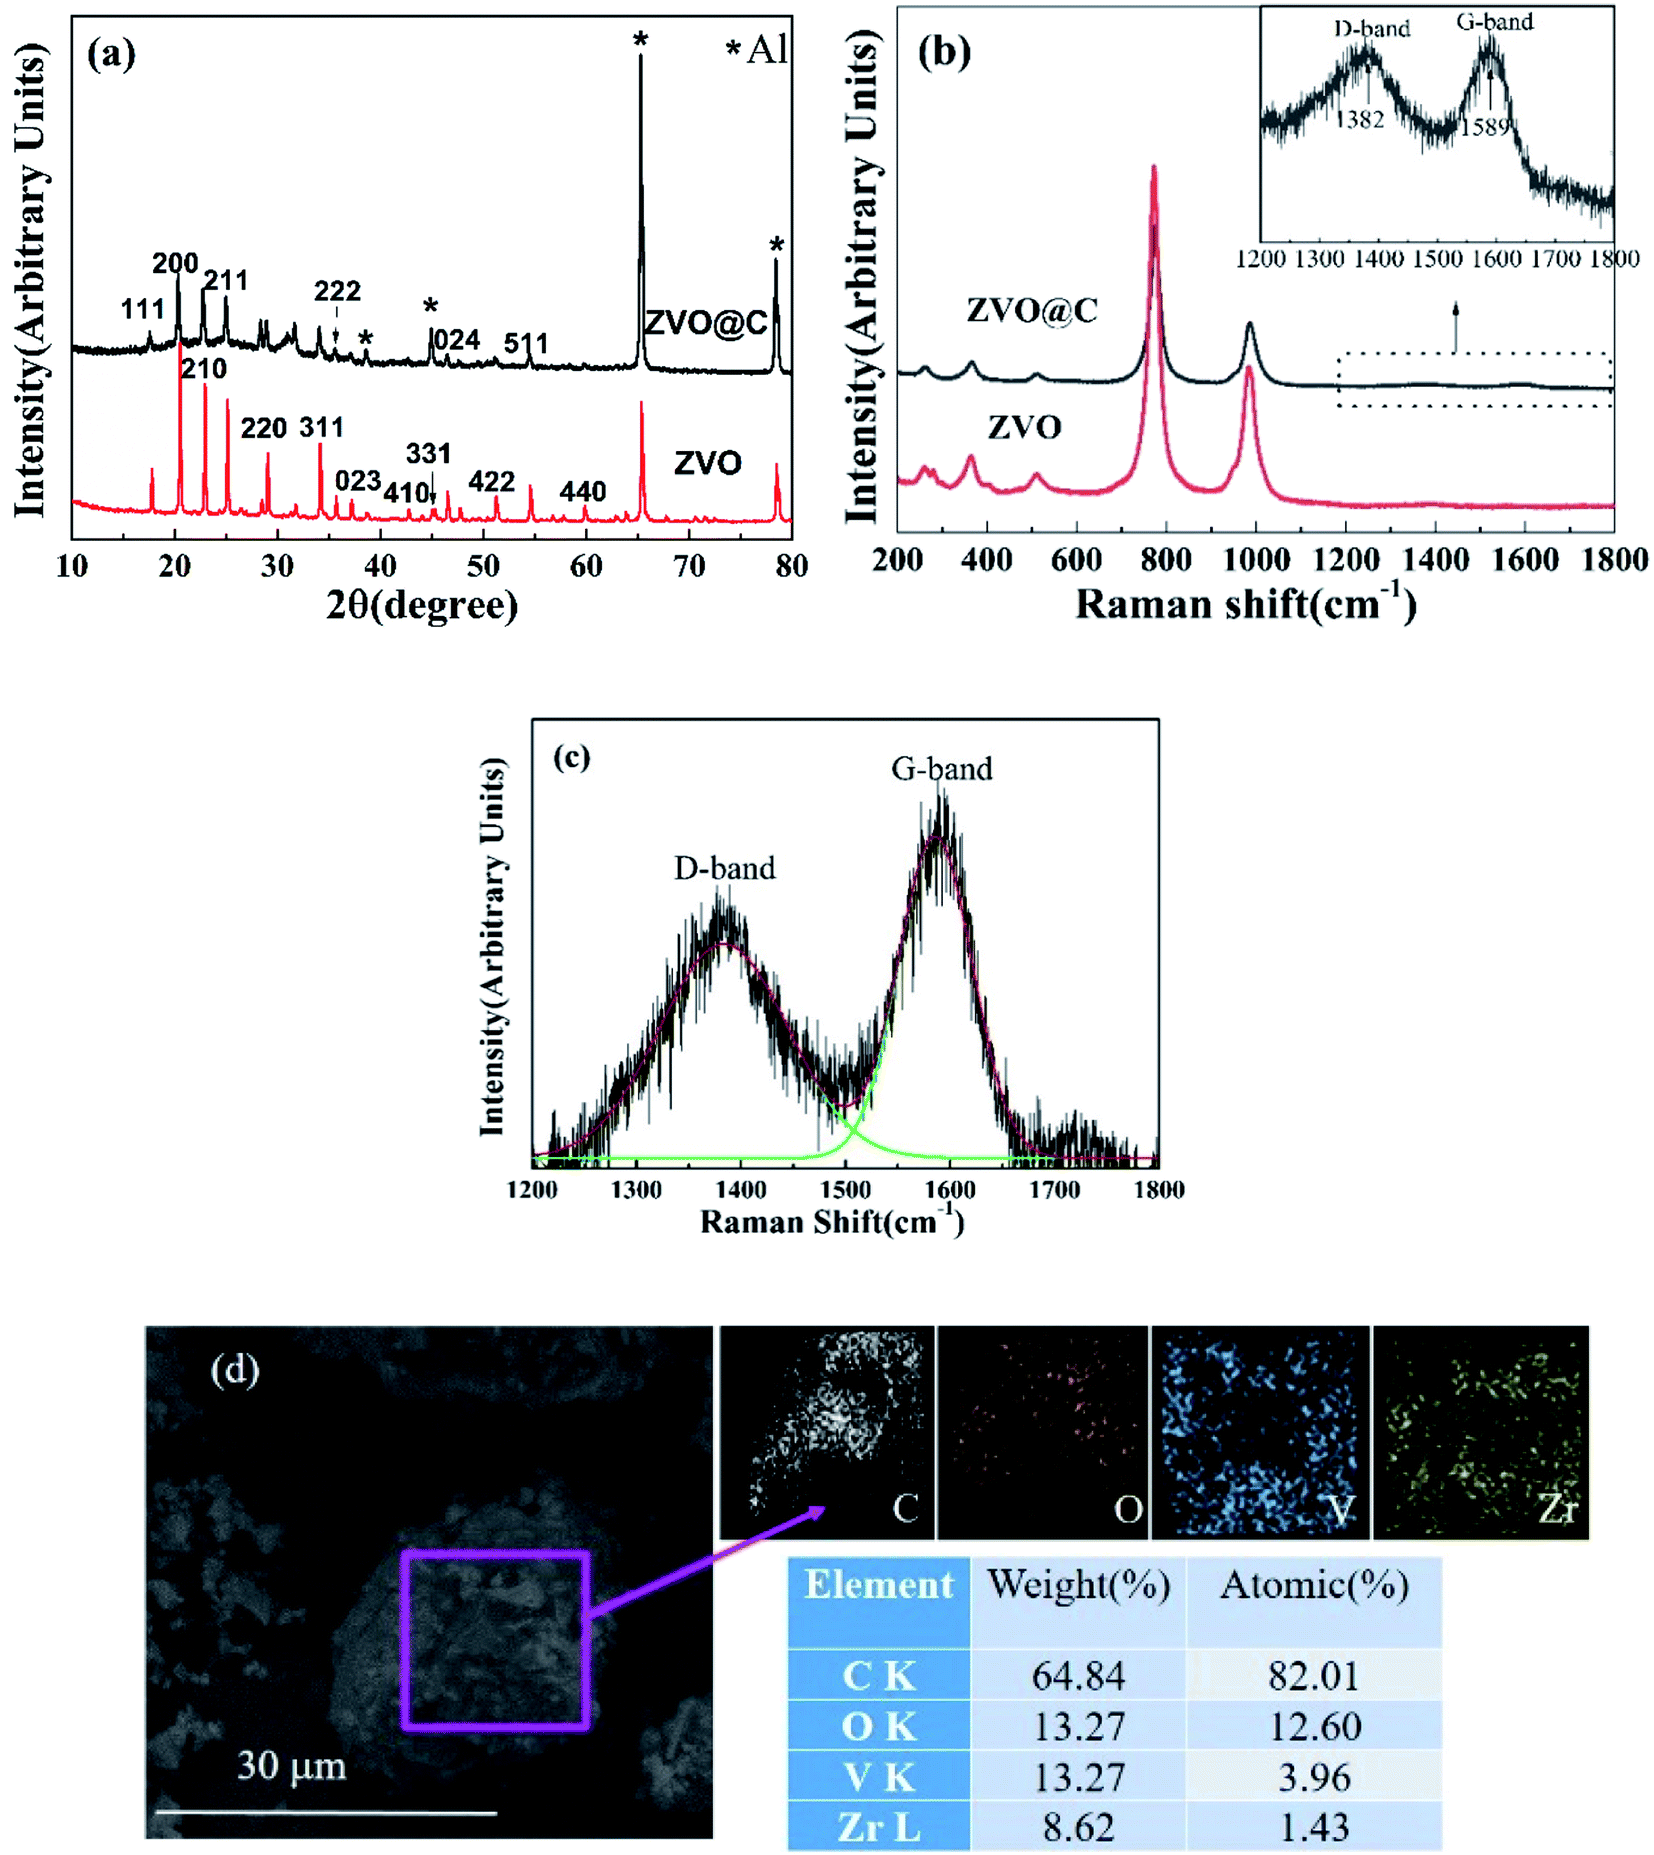 | ||
| Fig. 1 (a) XRD patterns of the as-prepared electrode materials on Al foil and refinement results of the XRD patterns, (b) Raman spectra of ZVO and ZVO@C, (c) Raman spectrum fitting of the carbon bands of ZVO@C and (d) SEM images of ZVO@C and EDS mapping. | ||
To further identify the extent of carbon in ZVO, Raman spectra are measured and are shown in Fig. 1(b). The Raman spectra of ZVO and ZVO@C are similar, except for the intensities. The carbon coating does not affect the structure of ZVO. Based on this, the Raman strength of the carbon containing samples is weak. The modes at about 987 cm−1 are assigned to the symmetric stretching (ν1) and those at 776 cm−1 are assigned to the asymmetric stretching (ν3) of the VO4 tetrahedra, while those at 475 and 508 cm−1 are assigned to the VO4 asymmetric bending and ZrO6 octahedral stretching, respectively, and those at low wavenumbers are assigned to the symmetric bending of the VO4 tetrahedra.28 The signal in the range of 1200–1800 cm−1 is plotted in the inset of Fig. 1(b). Two featured broad bands at 1385 cm−1 (D-band) and 1585 cm−1 (G-band) are clearly observed in ZVO@C. The G peak of carbon corresponds to the in-plane stretching vibration of the carbon atom sp2 hybridization, which corresponds to the crystallization of graphite, and the D peak is caused by defects or deformations in the carbon crystals.35,36 This demonstrates the presence of carbon, which is attributed to the carbonization of glucose. According to the fitting result (Fig. 1(c)), the relative intensity ratio of IG/ID for ZVO@C is about 1.48. This suggests that the coated carbon has a high degree of graphitization.
Fig. 1(d) shows the SEM image and the energy dispersive spectroscopy (EDS) spectrum analysis and elemental mapping of ZVO@C. The sample microstructure comprised regular shaped particles with clear boundaries and smooth surfaces. Some clear edges and corners of the particles could be seen for the samples with carbon. There were folded and imbricated structures at the boundaries of the grains and the surfaces of the particles. These signs indicate that the material particles are coated with carbon. The EDS elemental mapping illustrates the uniform element distribution in ZVO@C. The EDS spectrum suggests that the atomic ratio of Zr:V is around 1:2, which suggests that the as-synthesized samples are definitely carbon-coated pure-phase ZrV2O7.
In order to determine the thermal stability and C content of the materials, thermal analysis of the samples was conducted in atmosphere, as shown in Fig. 2. At low temperatures (below 400 °C), there is no weight loss and thermic peaks appear in the DSC curves, which indicates that all of the materials are stable. There is no weight loss in the whole range of temperatures for ZVO. However, an exothermic reaction is seen and weight loss appears at about 500 °C in the DSC curves of ZVO@C, which comes from carbon oxidation, and the weight loss is increased with the increase of the carbon content. This means that the samples are ZVO and carbon.
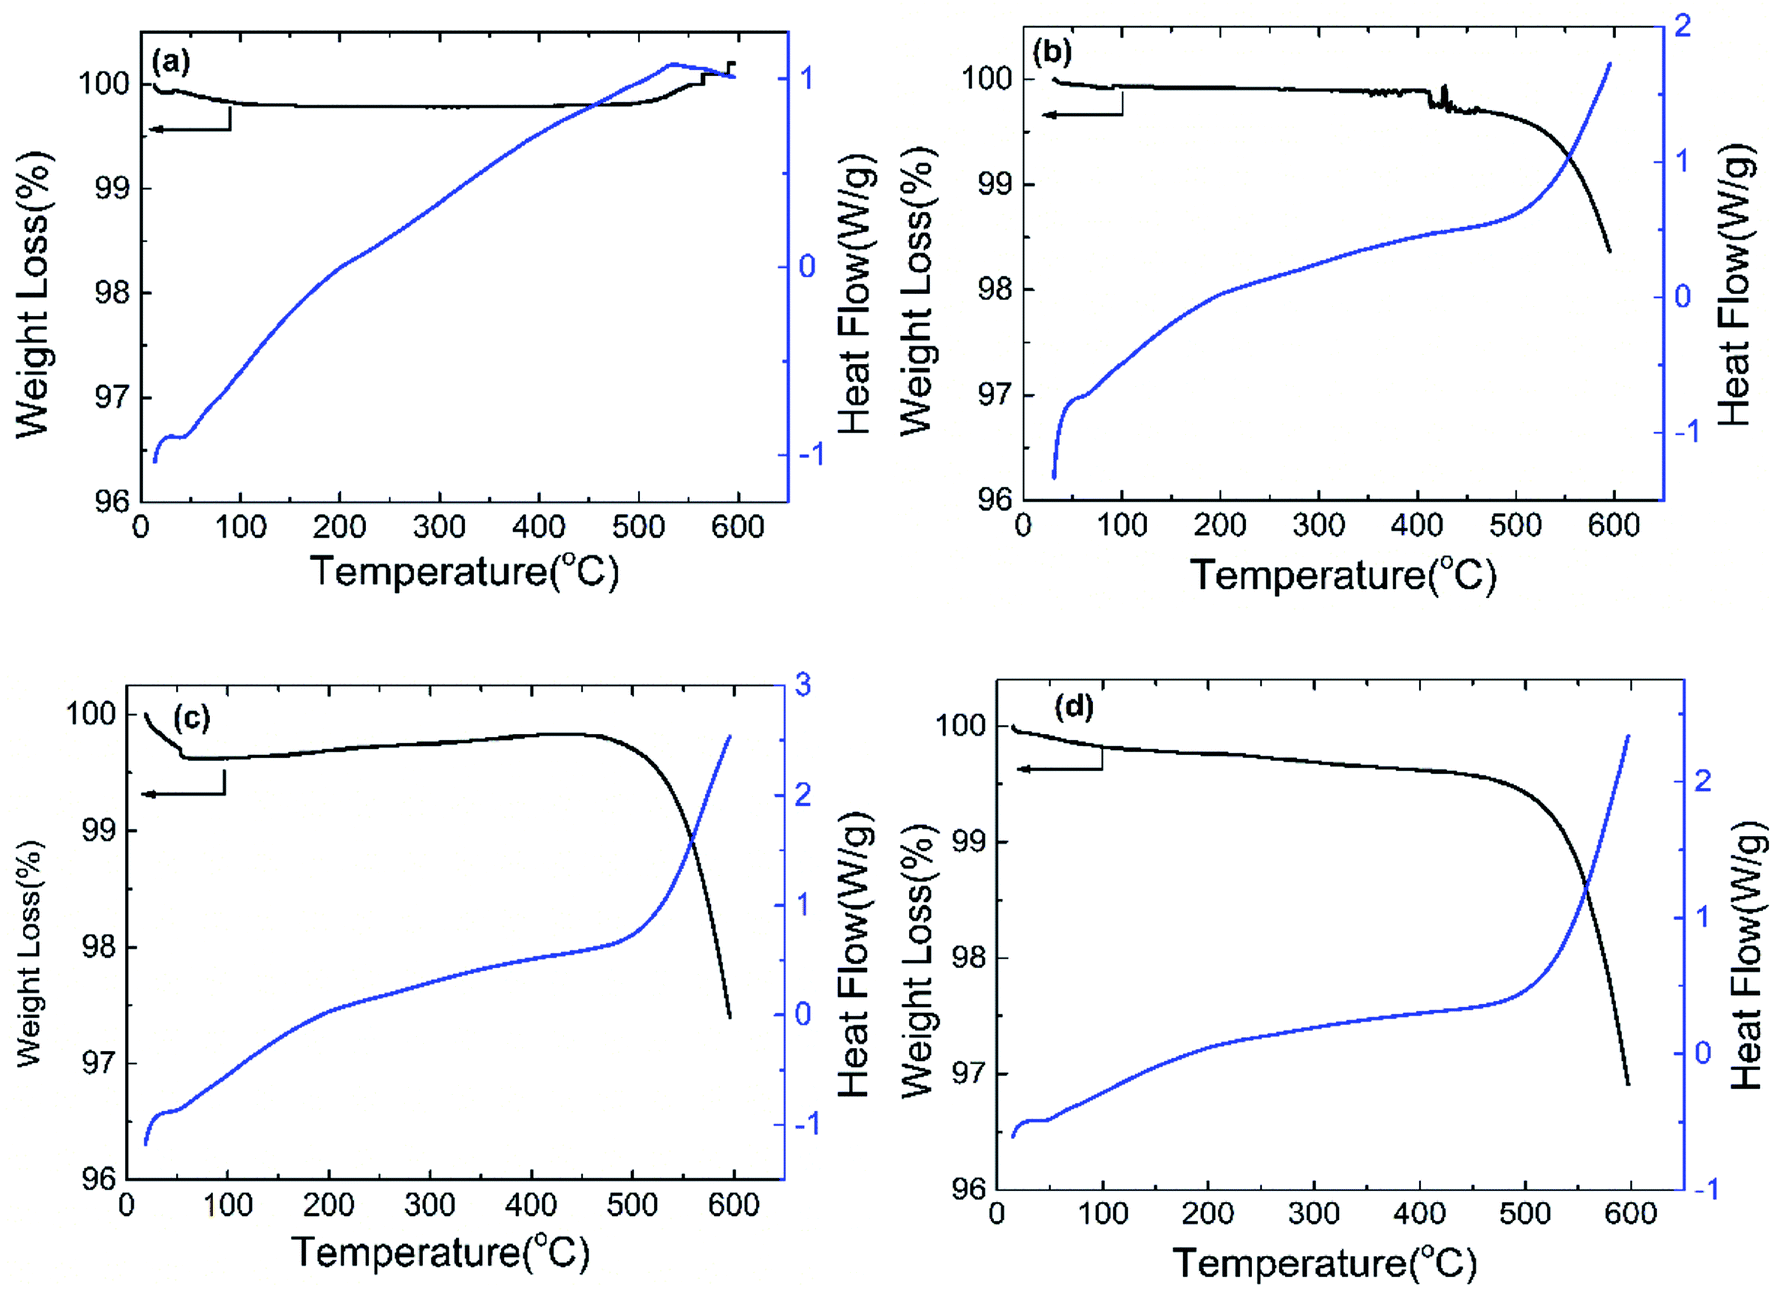 | ||
| Fig. 2 DSC and weight loss curves of (a) ZVO, (b) ZVO@C 3%, (c) ZVO@C 5% and (d) ZVO@C 9%. | ||
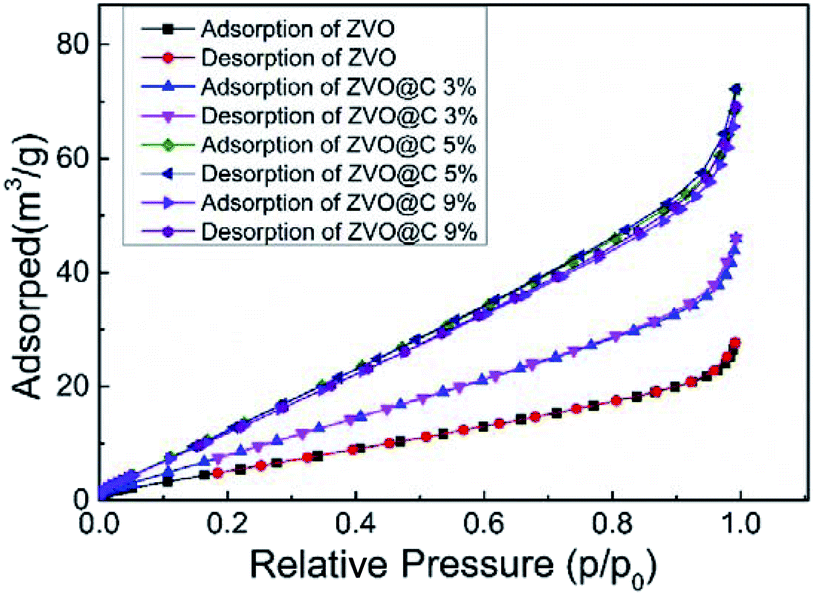
The N2 adsorption–desorption isotherms of the samples were measured to further analyze their textural properties. As shown in Fig. 3, compared with ZVO, the ZVO@C samples exhibit type-IV isotherms, indicating typical microporous and mesoporous structures.37 After the addition of carbon, the micropore and mesopore volumes of the samples increased, which can be verified by Fig. 3 and Table 1. According to the BET method, ZVO@C5% has the largest SSA (25.597 m2 g−1). The SSA of the catalyst increases first and then decreases with the increase of the carbon content, which is due to the addition of carbon reducing the particle size of ZVO, however the decrease of the particle size with the increased carbon content is not linear. In addition, all isotherms showed smooth changes in the micropore volume at a linear relative pressure. The total pore volume is not changed with the increasing carbon content due to the pore blocking effect of the ZVO particles. The textural properties of the prepared samples are summarized in Table 1. The textural properties were changed by the content of carbon, leading to SSA in the range of 10.6–25.6 m2 g−1. The changes of the SSA come from carbon impregnation. At first, carbon makes large particles of ZVO turn into small particles. And then, the micropores can be filled by carbon.
 | ||
| Fig. 3 N2 adsorption–desorption isotherms of the samples. | ||
| Specimen | BET (m2 g−1) | Vtatal (cm3 g−1) | Vmecro (cm3 g−1) |
|---|---|---|---|
| ZVO | 10.628 | 0.042 | 0.002 |
| ZVO@C 3% | 15.340 | 0.068 | 0.004 |
| ZVO@C 5% | 25.597 | 0.107 | 0.004 |
| ZVO@C 9% | 24.114 | 0.103 | 0.004 |
Representative discharge/charge curves at 100 mA g−1 for the 2nd, 3rd and 10th cycles are shown in Fig. 4(a) within a voltage window of 0.3–3 V vs. Li/Li+; 1st discharge and charge specific capacities of 279 mA h g−1 and 204 mA h g−1, respectively, can be achieved (Fig. 4(a′)). However, the values of the charge and discharge specific capacities are lower than those of ZVO reported by other groups.34 The reason could be related to the higher current density. As shown in Fig. 4(a′) the values of the charge and discharge specific capacities are slightly decreased with the increase of the cycle number, and they can remain at about 65 mA h g−1 after 50 cycles. The reason is that ZVO has weak conductivity which causes an obvious capacitance effect. As a comparison, the discharge/charge curves of ZVO@C are provided in Fig. 4(b–d) within a voltage window of 1–4 V vs. Li/Li+. The specific capacities (both discharge and charge) show almost no change after the first discharge, which means that the half batteries are more stable than that of ZVO. The carbon coating could improve the conductivity and battery stability. The effect of the carbon content on the specific capacity is not linear; the first discharge specific capacities (with carbon contents of 3%, 5% and 9%) are 392 mA h g−1, 204 mA h g−1 and 181 mA h g−1 (Fig. 4(b′–d′)) and the capacity retention rates are 52.5%, 54.9% and 77.3% after one cycle, respectively. The capacity retention rates (with carbon contents of 0% 3%, 5% and 9%) are 33.0%, 52.5%, 56.4% and 76.1% after ten cycles, respectively. The capacity retention rate increases with the increase of the carbon content.
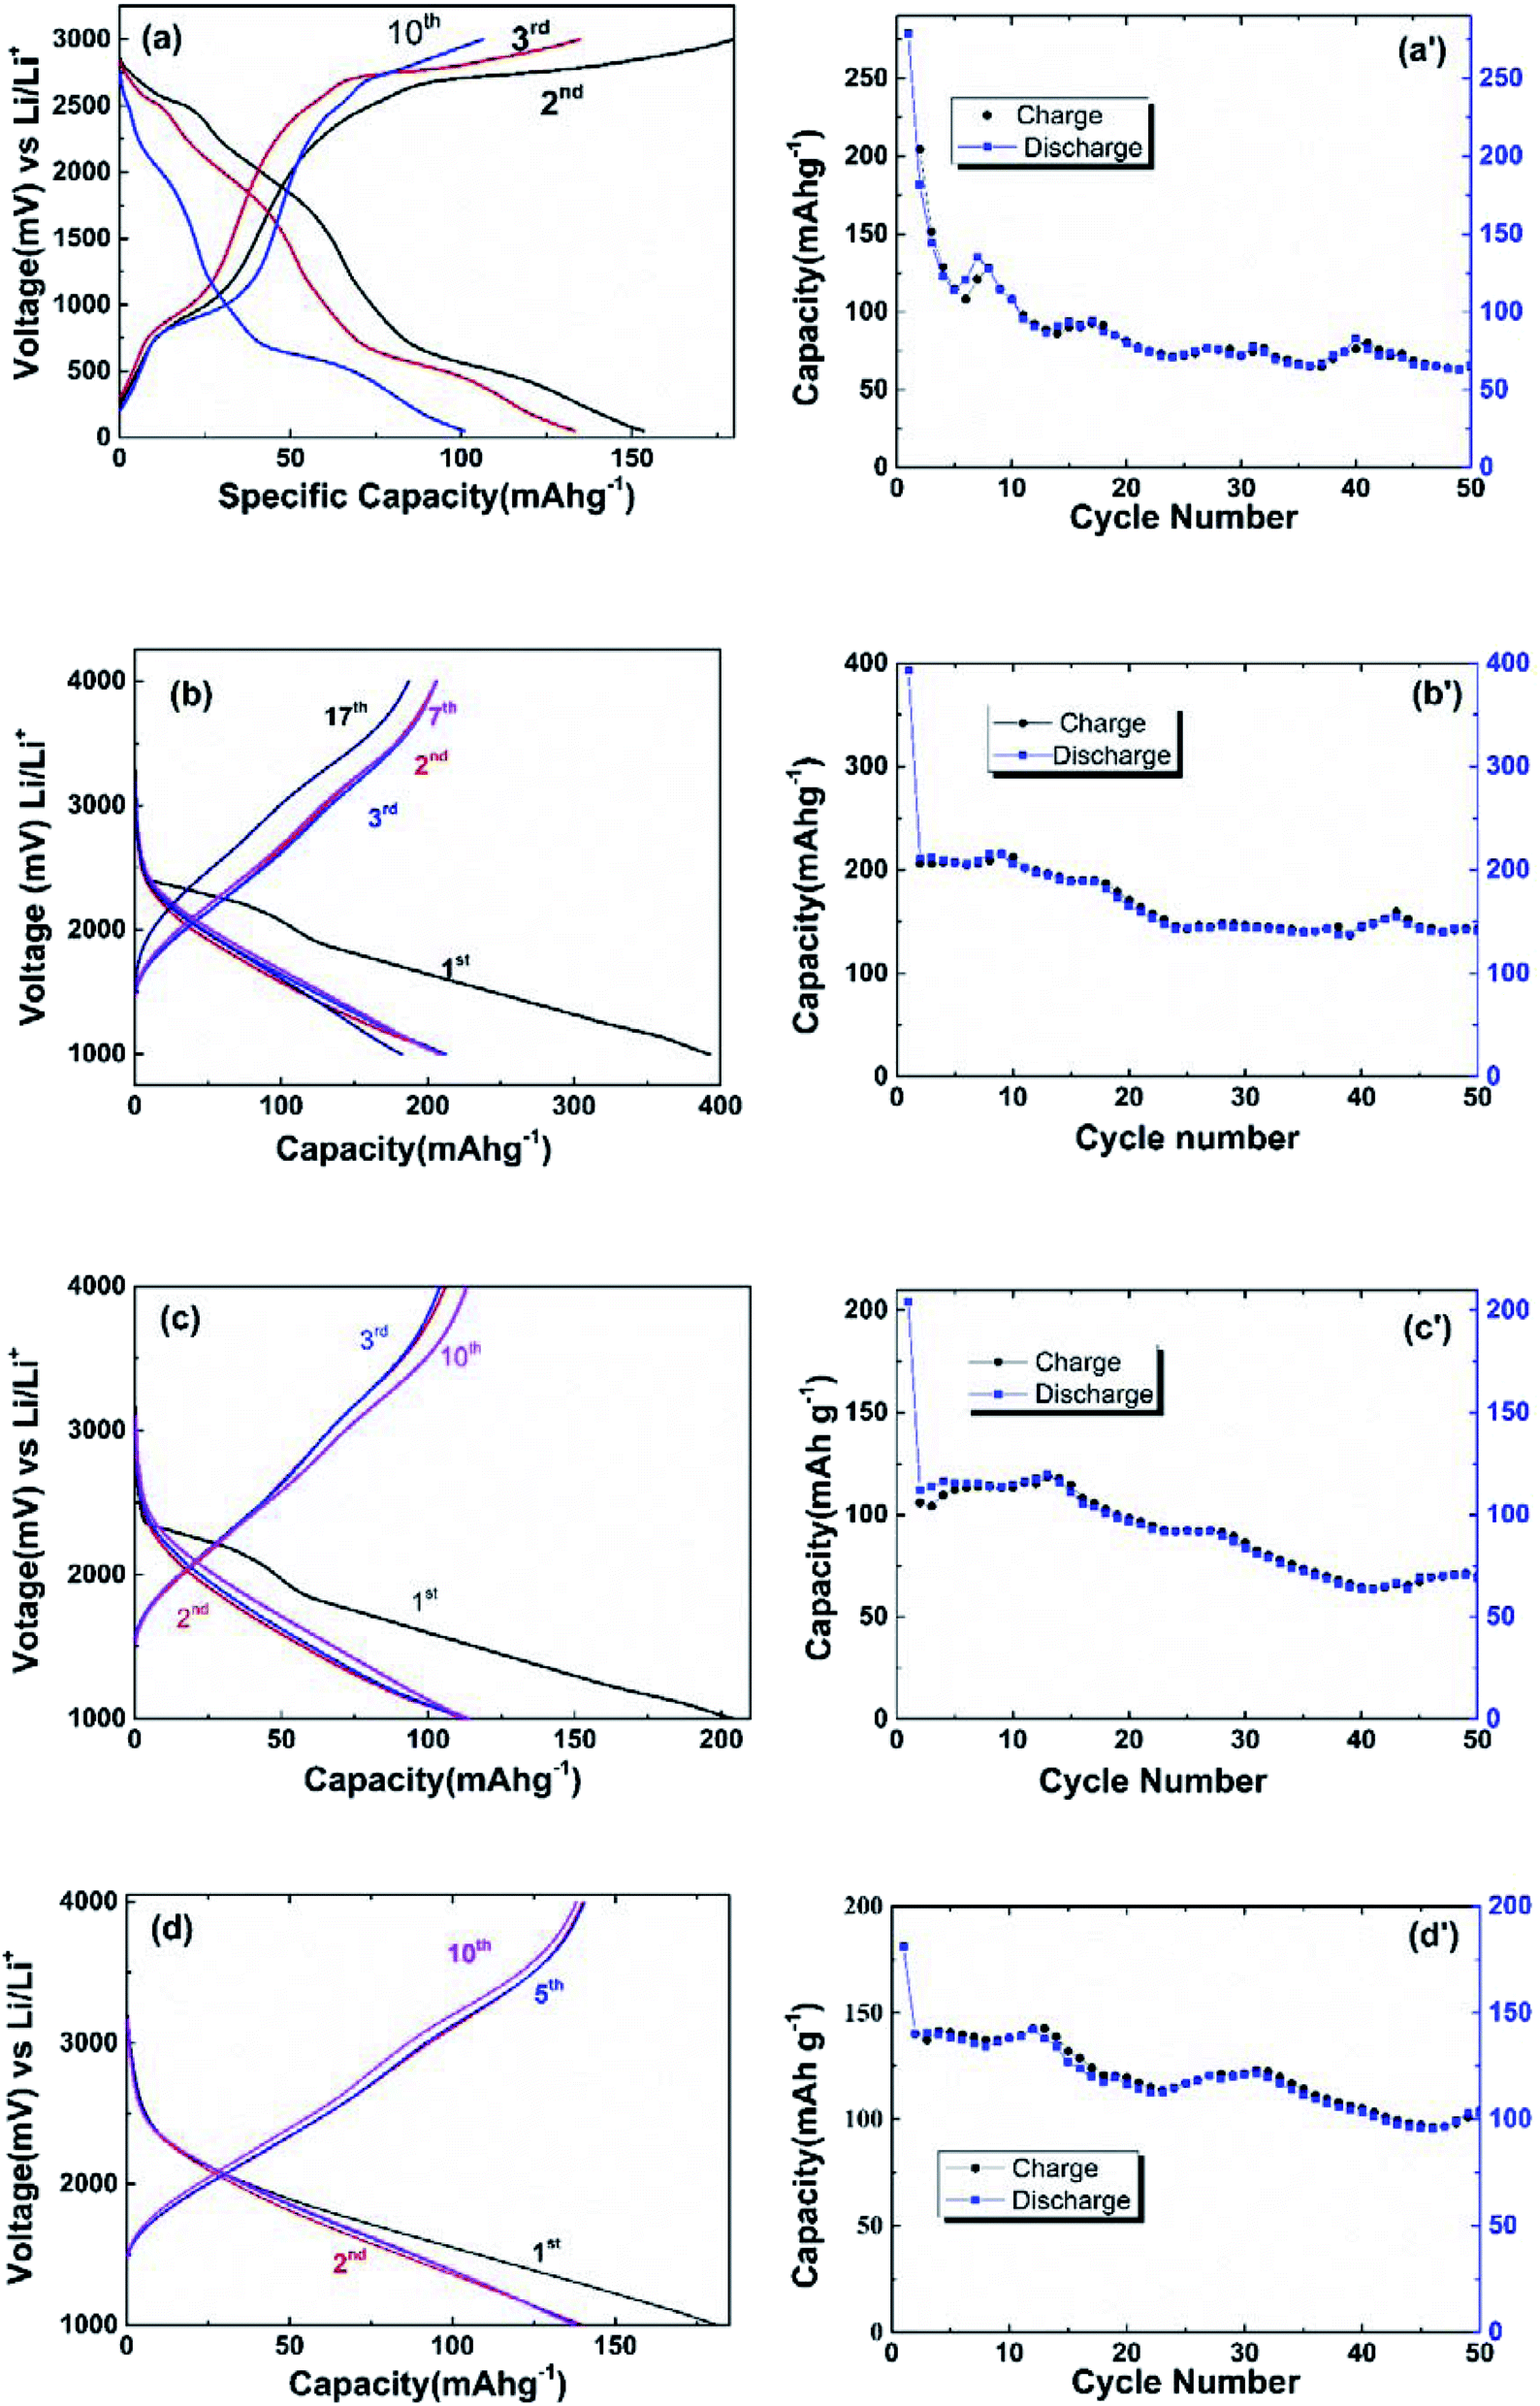 | ||
| Fig. 4 Galvanostatic discharge–charge curves and cycling performance for cycles of (a) ZVO, (b) ZVO@C3%, (c) ZVO@C5%, (d) ZVO@C9%. | ||
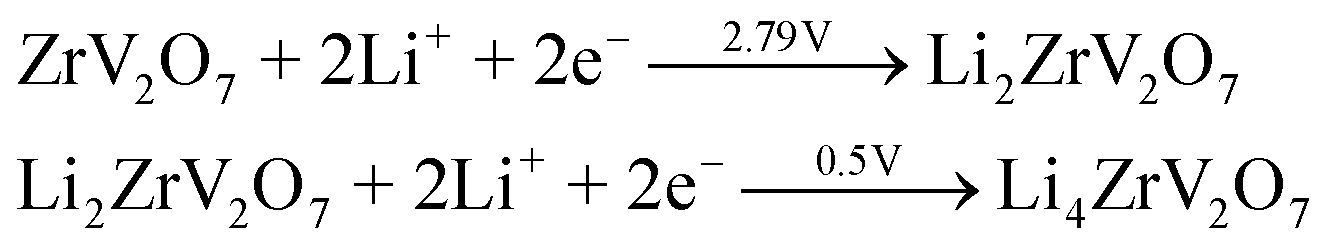
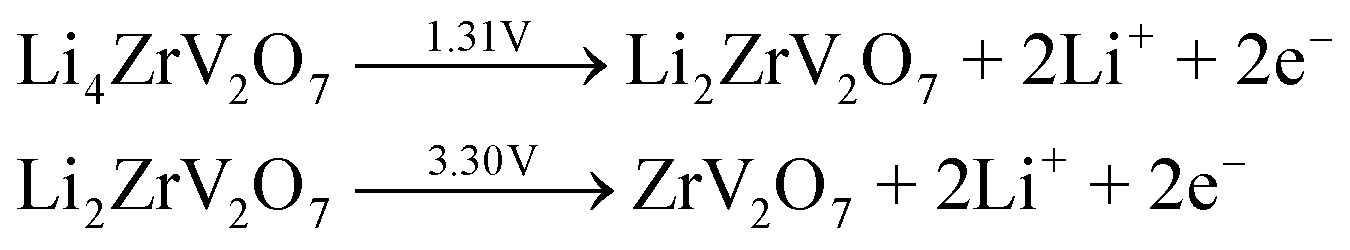
Fig. 5(a) shows the CV performance of the ZVO@C electrode between 0.5–4.5 V with a scan rate of 1 mV s−1. Fig. 5(a) gives the first, third and fifth CV curves of ZVO@C. As presented in detail, ZVO@C has two reduction peaks at 2.79 V and 0.5 V (vs. Li/Li+). These potentials correspond to the phase transformations from ZrV2O7 to LixZrV2O7. During the anodic scan, oxidation peaks at 3.30 V and 1.31 V are observed in the charging process, which are basically consistent with those of V2O5.18 The sharp peaks which appear at 2.79 V and 2.51 originate from the reduction of V5+ to V4+ and the partial reduction of V4+ to V3+, respectively, through typical conversion reactions, according to a previous report on CuV2O6.39 For discharge, the reaction on the electrode is as follows:
 | (1) |
 | (2) |
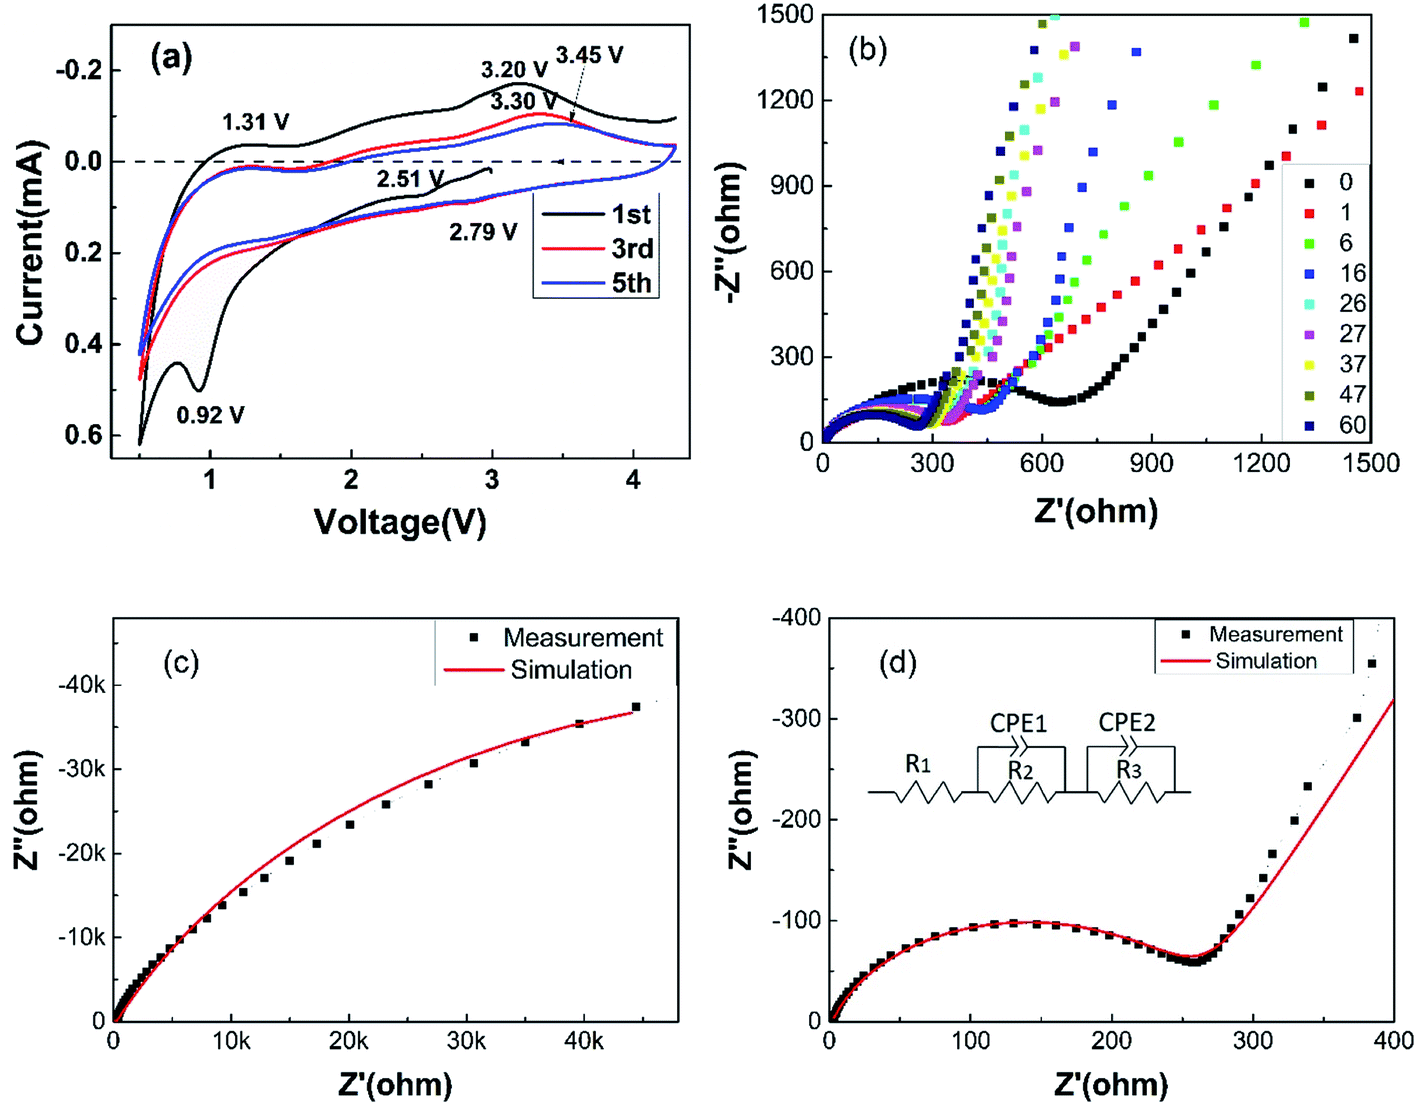 | ||
| Fig. 5 (a) The cyclic voltammetry (CV) performance of the ZVO@C electrode, (b) the Nyquist curves, (c) the Nyquist curve after the 60th cycle and the fit with the simulation data (solid line) and (d) local amplification of Fig. 5c and the constructed equivalent circuit (inset). | ||
One shoulder peak is obtained at 0.92 V during the first discharge cycle and then disappears, which indicates that the corresponding reaction is irreversible. The CV curves of the third and fifth cycles show a stable electrochemical performance, indicating that the side reactions on the electrode surface decrease. The Nyquist curves at the open-circuit state and after the 1st, 6th, 16th, 26th, 27th, 37th, 47th and 60th cycles are shown in Fig. 5(b). The curves consist of a semicircular arc in the high frequency region and a slanted line in the low frequency region. From the plots, we can see that the latter Nyquist curves almost coincide with each other after the second impedance spectroscopy. An obvious change could be observed after the first cycle. The change in the charge transfer resistance has been reported to be the important factor in specific capacity fading and rate performance.38 The numerical fitting of the equivalent circuit to the experimental Cole–Cole plot is usually done by fitting the frequency dependent real part and the imaginary part of the equations to the experimental data. The equivalent circuit consists of series and/or parallel resistors (R) and constant phase elements (CPE), as illustrated in Fig. 5(d). R1 (2 ohm) is the test circuit resistance, R2 (252 ohm) and CPE1-T (7 × 10⁻⁶ F) are the resistance and capacitance between particles in the electrode, respectively, and R3 (1.2 × 10⁵ ohm) and CPE2-T (5 × 10⁻⁴ F) are the resistance and capacitance between the electrode, respectively. The comparison of the experimental and simulation results after the 60th cycle is shown in Fig. 5(c) and (d). The lower resistance can improve the performance and cycling stability and it means a decrease in the inner resistance after cycling and a better contact of the electrode.
The standard electrode potential (SEP) of Li/Li+ is −3.0401 V and those of V4+/V5+, V3+/V4+ and V3+/V2+ are 1.00 V, 0.337 V and −0.255 V, respectively. Because V5+ andV4+ ions are strongly oxidizing, they could directly oxidize Li to Li+ without external circuit assistance. The charging sharp weak center at 3.30 V in the CV curves (Fig. 5(a)) corresponds to the oxidation peak of trivalent to tetravalent vanadium, which is about equal to SEP (V4+/V3+) minus SEP (Li/Li+). And the discharging sharp weak center at 2.79 V in the CV curves (Fig. 4(a)) corresponds to the reduction peak of the V ion (a high valency vanadium ion is reduced to a low valency vanadium ion), in which the value of discharging center is about equal to SEP (Li/Li+) minus SEP (V3+/V2+). And the open-circuit voltage of the half battery is about 2.47–2.80 V, which is related to the SEP, ion diffusion and electronic conductivity. The open-circuit voltage of ZVO is higher than that of ZVO@C (Fig. 5(a–d)), which means that the low electrical conductivity leads to a high open-circuit voltage. However, low conductivity leads to a decrease of the battery cycle stability (Fig. 4(a′–d′)). The results of Fig. 4 and 5 are similar.
To investigate the charge and discharge mechanism of Li ions in ZVO and the lattice constant change of ZVO with Li ion insertion and extraction, the Vienna ab initio simulations package (VASP) is used in the density functional theory (DFT) study. Fig. 6 shows that the lattice is stable (expect for shrinkage) when the first Li ion inserts into ZVO. However, four Li ions insert into one primitive cell and cause little change in the lattice. The Li ions-inserted lattice retains the cubic structure. The LiZrV2O7 phase is formed. And the lattice constants are 0.9014 nm, 0.9010 nm, 0.8995 nm and 0.8975 nm for zero, one, two and four Li ions, respectively. There are many materials which show lattice expansion (such as silicon) with Li ion insertion, which limits the application of these materials in LIBs. The shrinkage of ZVO could reduce the safety risk of LIBs. The volume decrease should be attributed to the framework structure of ZVO. The angle of the bridge oxygen of the V–O–V linkage reduces with the insertion of Li ions, causing the lattice constant decrease.
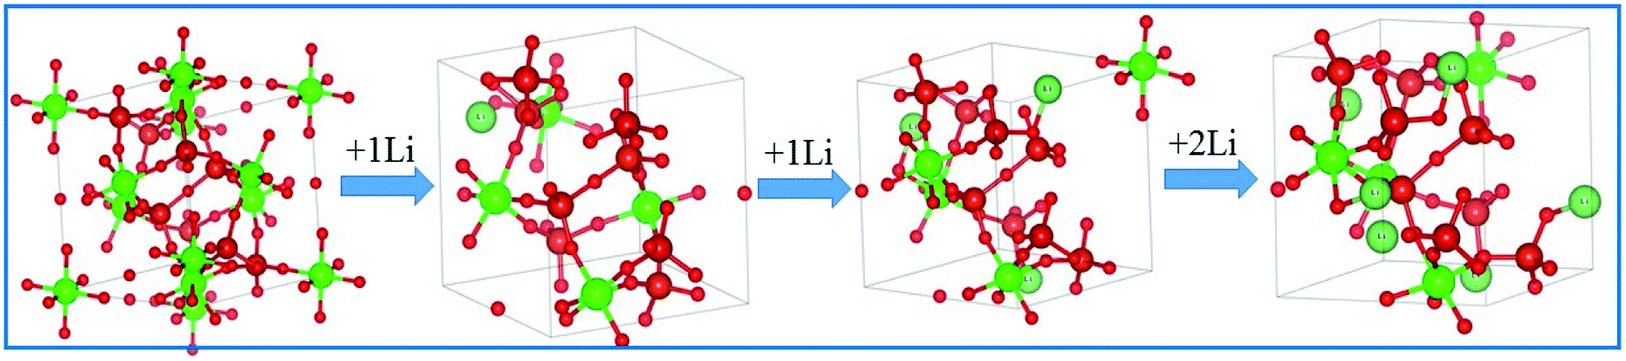 | ||
| Fig. 6 DFT calculations and simulation of the process of lithium insertion in ZVO crystals. | ||
4. Conclusions
We have prepared ZVO by a simple solid phase sintering method and ZVO@C is obtained by a rapid microwave sintering method. The open-circuit voltage of the half battery is related to the SEP, ion diffusion and electronic conductivity. The 1st discharge and charge specific capacity of ZVO are 279 mA h g−1 and 204 mA h g−1. The capacity retention rates (with a carbon content of 0% 3%, 5% and 9%) are 33.0%, 52.5%, 56.4% and 76.1% after ten cycles. The capacity retention rate increases with the increase of the carbon content. The lower resistance can improve the performance and cycling stability, and it means a decrease in the inner resistance after cycling and a good contact of the electrode.Conflicts of interest
There are no conflicts to declare.Acknowledgements
This work was supported by the National Science Foundation of China (No. 51702097, U1804125) and the Key Scientific and Technological Research Projects of Henan Province (202102210222).Notes and references
- Z. Y. Liu, T. W. He, K. K. Liu, J. X. Wang, T. W. Zhou, J. Yang, H. R. Liu, Y. R. Jiang, H. Ma and M. J. Yuan, J. Mater. Chem. A, 2017, 5, 24282–24291 RSC.
- T. W. He, Z. Y. Liu, Y. Zhou and H. Ma, Sol. Energy Mater. Sol. Cells, 2018, 176, 280–287 CrossRef CAS.
- G. B. Zhang, H. Yuan, Y. Wang and K. Jiao, Appl. Energy, 2019, 255, 113865 CrossRef CAS.
- A. Fathy, M. A. Elazi and A. G. Alharbi, Renewable Energy, 2020, 146, 1833–1845 CrossRef.
- A. R. Armstrong, C. Lyness, P. M. Panchmatia, M. S. Islam and P. G. Bruce, Nat. Mater., 2011, 10, 223–229 CrossRef CAS.
- J. H. Song, H. J. Park, K. J. Kim, Y. N. Jo, J. S. Kim, Y. U. Jeong and Y. J. Kim, J. Power Sources, 2010, 195, 6157–6161 CrossRef CAS.
- N. S. Choi, J. S. Kim, R. Z. Yin and S. S. Kim, Mater. Chem. Phys., 2009, 116, 603–606 CrossRef CAS.
- L. F. Shen, S. Q. Chen, J. Maier and Y. Yu, Adv. Mater., 2017, 29, 1701571 CrossRef.
- D. Deng, Energy Sci. Eng., 2015, 3, 385–418 CrossRef.
- Y. H. Hu, Z. Y. Jiang, L. H. Cai and J. Thompson, Ceram. Int., 2018, 44, 17544–17547 CrossRef CAS.
- C. H. Jiang, W. Q. Ding, H. Q. Wu, Z. Y. Yu, L. L. Ma and Z. M. Zou, Ceram. Int., 2018, 44, 3040–3047 CrossRef CAS.
- C. W. Dun, G. X. Xi, Y. Zhang, T. T. Zhao, Y. M. Liu, X. Y. Heng and L. Yao, Ceram. Int., 2018, 44, 20984–20991 CrossRef CAS.
- K. Kalaga, F. N. Sayed, M.-T. F. Rodrigues, G. Babu, H. Gullapalli and P. M. Ajayan, J. Power Sources, 2018, 390, 100–107 CrossRef CAS.
- I. Chumak, G. Dmytriv, V. Pavlyuk, S. Oswald, J. Eckert, H. Trill, H. Eckert, H. Pauly and H. Ehrenberg, J. Mater. Res., 2010, 25, 1492–1499 CrossRef CAS.
- P. Jakes, E. Erdem, A. Ozarowski, J. Tol, R. Buckan, D. Mikhailova, H. Ehrenbergcd and R. A. Eichel, Phys. Chem. Chem. Phys., 2011, 13, 9344–9352 RSC.
- A. Magasinki, P. Dixon, B. Hertzberg, A. Kvit, J. Ayala and G. Yushin, Nat. Mater., 2010, 9, 353–358 CrossRef.
- H. Kim, B. Han and J. Cho, Angew. Chem., Int. Ed., 2008, 120, 10305–10308 CrossRef.
- Y. D. Liu, D. Y. Guan, G. H. Gao, X. Liang, W. Sun, K. Zhang, W. C. Bi and G. M. Wu, J. Alloys Compd., 2017, 726, 922–929 CrossRef CAS.
- M. H. Chen, X. H. Xia, J. F. Yuan, J. H. Yin and Q. G. Chen, J. Power Sources, 2015, 288, 145–149 CrossRef CAS.
- V. M. Mohan, B. Hu, W. Qiu and W. Chen, J. Appl. Electrochem., 2009, 39, 2001–2006 CrossRef CAS.
- X. Liang, G. H. Gao and G. M. Wu, J. Alloys Compd., 2017, 725, 923–934 CrossRef CAS.
- X. Wang, W. Jia, L. Wang, Y. Huang, Y. Guo, Y. Sun, D. Jia, W. Pang, Z. Guo and X. Tang, J. Mater. Chem. A, 2016, 4, 13907–13915 RSC.
- Z. Li, G. Liu, M. Guo, L.-X. Ding, S. Wang and H. Wang, Electrochim. Acta, 2015, 173, 131–138 CrossRef CAS.
- B. Yan, X. Li, Z. Bai, M. Li, L. Dong, D. Xiong and D. Li, J. Alloys Compd., 2015, 634, 50–57 CrossRef CAS.
- X. Liang, G. Gao, Y. Liu, T. Zhang and G. Wu, J. Alloys Compd., 2017, 715, 374–383 CrossRef CAS.
- Y. Song, T. Y. Liu, B. Yao, T. Y. Kou, D. Y. Feng, X. X. Liu and Y. Li, Small, 2017, 13, 1700067–1700075 CrossRef.
- B. Xiao, B. Zhang, L. B. Tang, C. S. An, Z. J. He, H. Tong, W. J. Yu and J. C. Zheng, Ceram. Int., 2018, 44, 15044–15049 CrossRef CAS.
- H. L. Yuan, B. H. Yuan, F. Li and E. J. Liang, Acta Phys. Sin., 2012, 22, 226502 Search PubMed.
- R. L. Withers, J. S. O. Evans, J. Hanson and A. W. Sleight, J. Solid State Chem., 1998, 137, 161–167 CrossRef CAS.
- B. H. Yuan, H. L. Yuan, W. B. Song, X. S. Liu, Y. G. Cheng, M. J. Chao and E. J. Liang, Chin. Phys. Lett., 2014, 31, 076501 CrossRef.
- B. H. Yuan, X. S. Liu, W. B. Song, Y. G. Cheng, E. J. Liang and M. J. Chao, Phys. Lett. A, 2014, 378, 3397–3401 CrossRef CAS.
- R. L. Withers, Y. Tabira, J. S. O. Evans, I. J. King and A. W. Sleight, J. Solid State Chem., 2001, 157, 186–192 CrossRef CAS.
- B. H. Yuan, X. K. He, L. L. Chen, W. S. Wang, T. Cheng and E. J. Liang, Ceram. Int., 2018, 44, 21625 Search PubMed.
- K. Du, A. Gao, S. W. Sun, J. Lu, C. Y. Yu, S. Y. Li, H. L. Zhao and Y. Bai, Nano Energy, 2021, 83, 105775 CrossRef CAS.
- S. Kasap, I. I. Kaya, S. Reppc and E. Erdem, Nanoscale Adv., 2019, 1, 2586–2597 RSC.
- A. Bateni, E. Erdem, S. Repp, S. Acar, I. Kokal, W. Häßler, S. Weber and M. Somer, J. Appl. Phys., 2015, 117, 153905 CrossRef.
- P. Zhao, X. Hua, W. Xu, W. Luo, S. Chen and G. Cheng, Catal. Sci. Technol., 2016, 6, 6365–6371 RSC.
- Q. D. Li, Y. F. Zhao, Q. Kuang, Q. H. Fan, Y. Z. Dong and X. D. Liu, Phys. Chem. Chem. Phys., 2016, 18, 32160–32168 RSC.
- H. Ma, S. Y. Zhang, W. Q. Ji, Z. L. Tao and J. Chen, J. Am. Chem. Soc., 2008, 130, 5361–5367 CrossRef CAS PubMed.
| This journal is © The Royal Society of Chemistry 2021 |