 Open Access Article
Urea-induced supramolecular self-assembly strategy to synthesize wrinkled porous carbon nitride nanosheets for highly-efficient visible-light photocatalytic degradation†
Rui Lia,
Xianbao Cuib,
Jingtao Bia,
Xiongtao Jia,
Xin Lia,
Na Wanga,
Yunhai Huanga,
Xin Huang *ac and
Hongxun Hao
 *ac
*ac
aNational Engineering Research Center of Industry Crystallization Technology, School of Chemical Engineering and Technology, Tianjin University, Tianjin 300072, China. E-mail: hongxunhao@tju.edu.cn; x_huang@tju.edu.cn
bState Key Laboratory of Chemical Engineering, School of Chemical Engineering and Technology, Tianjin University, Tianjin 300072, China
cCo-Innovation Center of Chemical Science and Engineering, Tianjin 300072, China
First published on 2nd July 2021
Abstract
Graphitic carbon nitride (g-C3N4) has attracted immense interest as a promising photocatalyst. To facilitate its versatile applications in many fields, new low-cost strategies to synthesize outstanding g-C3N4 need to be further developed. Although supramolecular preorganization has been considered as a promising candidate, the utilized supramolecules like melamine–cyanuric acid (MCA) are typically synthesized by expensive triazine derivatives. Herein, wrinkled porous g-C3N4 nanosheets were successfully fabricated by hydrothermal-annealing of supramolecular intermediate MCA synthesized by the cheap precursors dicyandiamide and urea. During the formation of MCA, urea could act as a facile agent to react with dicyandiamide to form melamine and cyanuric acid firstly and then assemble into MCA through hydrogen bonds. In addition, urea could serve as a porogen and decompose to generate bubbles for conducive formation of micro-size MCA self-templates and thus wrinkled porous g-C3N4 nanosheets could be obtained. The nanostructure and photocatalytic performance of g-C3N4 were optimized by modulating microstructures and physicochemical properties of MCA, which could be conveniently controlled by urea addition and hydrothermal duration. The obtained wrinkled porous g-C3N4 nanosheets exhibit highly-efficient visible-light photocatalytic degradation compared with traditional MCA-derived g-C3N4, which could remove 98.3% of the rhodamine B in 25 min. The superior photocatalytic activity is mainly attributed to the urea-induced larger specific surface area, better light harvesting ability, faster transfer and more advanced separation efficiency of the photogenerated electron–hole pairs. This research provides a new strategy for preparing high-performance porous g-C3N4 from the self-assembled supramolecule MCA synthesized by low-cost precursors.
1. Introduction
With the rapid development of industrialization and urbanization in the past decades, the increased discharge of harmful and toxic organic pollutants has had a serious influence on aquatic environments and human health.1–3 Photocatalysis is an effective technique for the degradation of pollutants by using inexhaustible and clean solar energy.4 Recently, graphitic carbon nitride (g-C3N4), a non-metal semiconductor photocatalyst, has attracted attention for photocatalytic degradation of organic pollutants due to the merits of non-toxicity, superior visible-light responsiveness and photochemical stability.5 However, the photocatalytic efficiency of bulk g-C3N4 obtained by thermal polymerization of traditional precursors such as melamine, dicyandiamide and cyanamide is restricted by rapid recombination of photogenerated electron–hole pairs, marginal visible light absorption and small specific surface area.6,7 In order to improve its photocatalytic performance, various methods have been developed, such as semiconductor coupling,8,9 element doping10–12 and nanostructure engineering.13,14To date, tremendous efforts have been devoted to design nanostructures of g-C3N4 because the photocatalytic performance of g-C3N4 depends strongly on its morphology.15,16 The nanostructures with high specific surface area and porosity generally possess efficient light harvesting ability, abundant exposed active sites for photocatalysis and accessible channels for reactants diffusion–adsorption.17–19 Modified g-C3N4 with nanotubes, nanosheets and porous structures have been successfully prepared by methods including the hard template method, soft template method, acid treatment method and thermal etching method.20,21 However, these methods suffer from drawbacks such as template removal, residual impurities, consumption of strong acids and low efficiency.22,23 Therefore, it is still an urgent task to explore facile and highly-efficient methods for the nanostructure engineering of g-C3N4.
Supramolecular preorganization approach has become an efficient self-templating method to modulate g-C3N4 nanostructure with remarkable photocatalytic efficiency. Supramolecules, like melamine–cyanuric acid (MCA), was synthesized via linking the melamine precursors with triazine derivatives and other chemically compatible dopants to form hydrogen-bonded molecular assemblies.24–26 Generally, MCA possesses highly stable structure where melamine molecules can interact with cyanuric acid by forming hydrogen bonds (N–H⋯N and N–H⋯O). The distinctive structure of MCA leads to the formation of porous g-C3N4 materials with high surface area. Especially, various porous morphologies including spheres, flowers and hollow structures could be obtained by controlling the precursor molecules, solvents, synthesis temperatures, etc.27 However, harmful organic solvents and expensive compatible dopants are generally used in supramolecular preorganization approach, which constricts its practical applications. It is noteworthy that the cheap urea has been reported as an agent to participate in the self-assembly process of expensive melamine and cyanuric acid through ionic interaction and hydrogen bonding.28,29 In addition, urea could be transformed into cyanuric acid, melamine and g-C3N4 by polymerization.30–32 Therefore, it is assumed that urea could react with other cheap monomers to form melamine and cyanuric acid under certain conditions and then assemble into supramolecular precursors like MCA. Especially, urea might act as a typical porogen agent to enhance the porosity of MCA and promote the photocatalytic performance of g-C3N4.
Herein, the wrinkled porous g-C3N4 nanosheets were successfully prepared from supramolecular intermediate MCA by hydrothermal-annealing strategy. Specifically, the low-cost monomers dicyandiamide and urea were hydrothermally treated in water to form self-assembled supramolecular MCA self-templates. After the subsequent annealing process, wrinkled porous g-C3N4 nanosheets were fabricated, whose nanostructure and photocatalytic activity were further optimized by modulating urea addition and hydrothermal duration. The wrinkled porous g-C3N4 nanosheets exhibit superior photocatalytic activity for degrading rhodamine B (RhB) and the degradation rate is promoted by 22.3 times compared with bulk g-C3N4. The superior performance is mainly attributed to the modulated electronic structure, high specific surface area, abundant exposed active sites and promoted transfer of photo-induced charge carriers.
2. Experimental details
2.1. Sample preparation
All chemicals are of analytical grade and were used without further purification. The wrinkled porous g-C3N4 nanosheets were synthesized by hydrothermal-annealing method. Typically, dicyandiamide (DCDA, 4 g) and urea with specific molar ratio were dissolved in 30 mL deionized water at room temperature. The obtained suspensions were stirred for 60 min and then transferred into a 50 mL Teflon-lined stainless autoclave and heated at 160 °C for 12 h. After cooling to room temperature, the hydrothermal products HUDx (x represents the molar ratio of urea: DCDA, which equals 1, 2, 3 and 4) were collected by vacuum filtration and washed with deionized water and ethanol, then dried at 60 °C for 10 h. HUDx was calcined in a quartz crucible with a cover at 520 °C for 4 h, followed by natural cooling to room temperature to obtain light-yellow powder UDx product (Fig. S1a†) without further grinding. By contrasting, UD0 was synthesized by the same method without urea and the corresponding precursor was denoted as HUD0. Pure bulk g-C3N4 (DCN) was synthesized via calcination of DCDA at the same conditions with UDx. Both UD0 and DCN are yellow blocky solid (Fig. S1b and c†) which should be grinded into powder before using. In order to optimize hydrothermal duration, molar ratio of urea: DCDA was kept at 3 and UD3-8 h and UD3-16 h were further obtained at the corresponding durations. Their hydrothermal intermediates were denoted as HUD3-8 h and HUD3-16 h, respectively. In addition, HUD0-8 h and HUD0-16 h samples were prepared to analyze the changes of DCDA in the hydrothermal process by hydrothermal treatment of DCDA for 8 h and 16 h, respectively.2.2. Characterization
X-ray diffraction patterns of the obtained composites were recorded by X-ray powder diffractometer (XRD, Rigaku, D/max 2500) with monochromatized Cu Kα radiation (λ = 1.5418 Å). The scanning rate was 8° min−1 with current of 200 mA and voltage of 40 kV. Thermogravimetric analysis (TGA) and differential scanning calorimetry (DSC) was performed on a TGA analyzer (METTLER, TGA/DSC1) from 30 °C to 800 °C at linear heating rate of 10 °C min−1 under nitrogen flow. Morphological information was recorded by scanning electron microscopy (SEM, FEI, Apreo S LoVac) and transmission electron microscopy (TEM, FEI, Tecnai F30). Elements contents and their chemical states were analyzed by X-ray photoelectron spectroscopy (XPS, Thermo, ESCALAB 250XI, Al Kα). All the binding energies were calibrated by contaminant carbon (C 1s = 284.6 eV). Solid-state 13C magic angle spinning nuclear magnetic resonance (NMR) spectra were investigated by JEOL JNM ECZ600R. The Brunauer–Emmett–Teller (BET) method and Barrett–Joyner–Halenda (BJH) model were applied to calculate the specific surface area and diameter distributions respectively by using a gas sorption analyzer (SSA-7000, BJbuilder). The Fourier transform infrared (FTIR) spectra within the wavelength range of 4000–400 cm−1 were recorded on Bruker Alpha spectrometer. Optical properties were analyzed by a UV-vis spectrophotometer (UV-2600, Shimadzu). Photoluminescence spectra (PL) and time-resolved fluorescence spectra (TRS) were measured with FLS1000 Series of Fluorescence Spectrometers (excited at λ = 355 nm). Total organic carbon (TOC) of the degradation solution was measured by Shimazu TOC-L analyzer.2.3. Photoelectrochemical property measurements
Photoelectrochemical measurements include transient photocurrent response (TPR) and electrochemical impedance spectra (EIS), which were measured by a three-electrode system on an electrochemical system (CHI-660E) with Na2SO4 solution (0.1 M) as the electrolyte. Saturated calomel electrode and platinum wire were used as the reference electrode and counter electrode, respectively. Sample films coated on ITO glasses via a dip-coating method (10 mg samples dispersed in mixture of 1 mL ethanol and 20 μL Nafion) acted as the working electrode. All the measurements were performed under illumination by using a 300 W Xe lamp (λ ≥ 420 nm). A bias voltage of 0.5 V was employed to test the transient photocurrent.2.4. Photocatalytic degradation experiments
The photocatalytic performance of prepared photocatalysts was evaluated by degrading RhB in a jacketed quartz photoreactor with circulated water at 20 °C. Specifically, 50 mg photocatalyst was dispersed into 100 mL 20 mg L−1 RhB aqueous solution. After magnetically stirred in dark for 30 min to reach the adsorption–desorption equilibrium, the suspension was irradiated under visible light by a 300 W Xenon lamp equipped with an ultraviolet cutoff filter (λ ≥ 400 nm) from a distance of ca. 15 cm. At given time interval, 4 mL of the mixed solution was taken out and centrifuged at 15![[thin space (1/6-em)]](https://www.rsc.org/images/entities/char_2009.gif) 000 rpm for 5 min to separate the photocatalysts. The concentration of residual RhB was analyzed by UV-2600 spectrophotometer. The ratio of remaining RhB concentration to its initial concentration (C/C0) is equal to the ratio of corresponding absorbances.
000 rpm for 5 min to separate the photocatalysts. The concentration of residual RhB was analyzed by UV-2600 spectrophotometer. The ratio of remaining RhB concentration to its initial concentration (C/C0) is equal to the ratio of corresponding absorbances.
3. Results and discussion
3.1. Crystalline and chemical structures of precursors and obtained intermediates
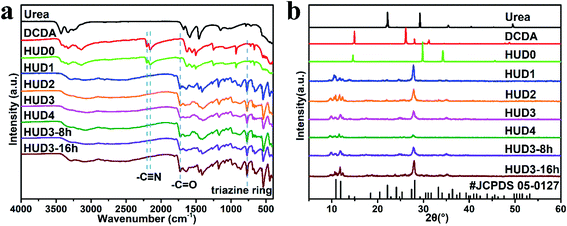
The microstructure and performance of g-C3N4 are directly determined by the molecular structure and physicochemical properties of supramolecular intermediates, which could be modulated by optimizing synthesis conditions.5 Therefore, it is necessary to identify the specific species of supramolecular intermediates. To clarify the characteristics of different hydrothermal intermediates, their FTIR spectra were first examined and the results are shown in Fig. 1a and S2a.† FTIR spectra of HUD0-8 h, HUD0 and HUD0-16 h were similar with that of DCDA, implying their similar molecular structures. However, there were also some differences. Two strong peaks at 2152 and 2202 cm−1 could be clearly observed in DCDA, HUD0-8 h, HUD0 and HUD0-12 h, which could be ascribed to the typical infrared vibration of cyano group (–C![[triple bond, length as m-dash]](https://www.rsc.org/images/entities/char_e002.gif) N).33 The characteristic vibration peaks of carbonyl group (–C
N).33 The characteristic vibration peaks of carbonyl group (–C![[double bond, length as m-dash]](https://www.rsc.org/images/entities/char_e001.gif) O) in HUD0-8 h, HUD0 and HUD0-16 h emerged at 1730 cm−1. With the extension of hydrothermal duration, the intensity of –C
O) in HUD0-8 h, HUD0 and HUD0-16 h emerged at 1730 cm−1. With the extension of hydrothermal duration, the intensity of –C![[triple bond, length as m-dash]](https://www.rsc.org/images/entities/char_e002.gif) N group slightly decreased and the intensity of –C
N group slightly decreased and the intensity of –C![[double bond, length as m-dash]](https://www.rsc.org/images/entities/char_e001.gif) O group slightly increased, indicating the partial formation of amidinourea.33 After the addition of urea in hydrothermal processes, –C
O group slightly increased, indicating the partial formation of amidinourea.33 After the addition of urea in hydrothermal processes, –C![[triple bond, length as m-dash]](https://www.rsc.org/images/entities/char_e002.gif) N disappeared immediately in HUDx, HUD3-8 h and HUD3-16 h no matter how long the hydrothermal process was, indicating that the variation of DCDA during hydrothermal process. The disappearance of –C
N disappeared immediately in HUDx, HUD3-8 h and HUD3-16 h no matter how long the hydrothermal process was, indicating that the variation of DCDA during hydrothermal process. The disappearance of –C![[triple bond, length as m-dash]](https://www.rsc.org/images/entities/char_e002.gif) N could be attributed to the reaction between DCDA and urea which might induce the molecular reformation and partial polymerization from DCDA to melamine.34 Simultaneously, strong peaks at 771 cm−1 in HUDx, HUD3-8 h and HUD3-16 h emerged, implying the generation of triazine ring.29 Furthermore, another new strong peak centering at 1730 cm−1 also appeared, which could be ascribed to the characteristic vibration peak of –C
N could be attributed to the reaction between DCDA and urea which might induce the molecular reformation and partial polymerization from DCDA to melamine.34 Simultaneously, strong peaks at 771 cm−1 in HUDx, HUD3-8 h and HUD3-16 h emerged, implying the generation of triazine ring.29 Furthermore, another new strong peak centering at 1730 cm−1 also appeared, which could be ascribed to the characteristic vibration peak of –C![[double bond, length as m-dash]](https://www.rsc.org/images/entities/char_e001.gif) O.29 The emergence of these two new functional groups implied the presence of cyanuric acid in the intermediates. Therefore, it is a feasible strategy to synthesize supramolecular MCA by single-step hydrothermal treatment of cheap precursors including dicyandiamide and urea, which could significantly reduce the total cost.
O.29 The emergence of these two new functional groups implied the presence of cyanuric acid in the intermediates. Therefore, it is a feasible strategy to synthesize supramolecular MCA by single-step hydrothermal treatment of cheap precursors including dicyandiamide and urea, which could significantly reduce the total cost.
To further confirm the generation of MCA, XRD characterization was performed and the results are displayed in Fig. 1b and 2b. During hydrothermal process, DCDA reacted with H2O and transformed to amidinourea.33 Hence, HUD0-8 h, HUD0 and HUD0-12 h exhibit obvious different XRD patterns from DCDA, which is consistent with the FTIR results (Fig. 1a and S2a†). For HUDx, HUD3-8 h and HUD3-16 h samples, they almost have similar XRD patterns, which can be well indexed to the characteristic peaks of melamine–cyanuric acid (JCPDS 05-0127).35 Specifically, the peaks at 27.7° and 10.5° can be assigned to the (002) plane of graphitic stacking of MCA layers and the (100) in-plane repeating unit, respectively. Especially, the characteristic peaks of urea and DCDA cannot be found, implying they may react completely during hydrothermal process. According to the analysis of FTIR and XRD, it is confirmed that DCDA has reacted with urea and transformed into MCA during hydrothermal reaction.
The structure of MCA could be controlled by adjusting urea addition and hydrothermal duration. As can be seen from Fig. 1a, the FTIR spectra of HUDx, HUD3-8 h and HUD3-16 h samples are basically the same, suggesting that these two factors have no apparent influences on the molecular structures of the generated intermediates. However, the XRD intensity (Fig. 1b) of the intermediates changed significantly. With the increase of urea addition, the XRD intensity of HUDx decreased, indicating their decreased crystallinity. The existence of heterogeneous interface (bubbles generated by the decomposition of urea) can effectively reduce the free energy of the nucleation interface.36,37 These bubbles induce the nucleation of MCA first occur at the gas–liquid interface and then burst nucleation to form MCA crystals with smaller size and low crystallinity. With the increment of urea addition, more bubbles are generated and the nucleation rate of MCA would be accelerated, resulting in decreased crystallinity of HUDx. With the extension of hydrothermal duration, the crystallinity of HUD3-8 h, HUD3 and HUD3-16 h first decreased and then increased. When the hydrothermal duration increased from 8 h to 12 h, the bubbles generated by urea decomposition continued to accumulate, leading to a decrease of crystallinity. In the low supersaturation zone, the crystal growth rate is greater than nucleation rate.38 When the reaction time increased from 12 h to 16 h, the MCA crystal growth rate is greater than the nucleation rate as the supersaturation of the system decreases. Hence, the crystallinity of UD3-16 increases with the growth of MCA crystals.
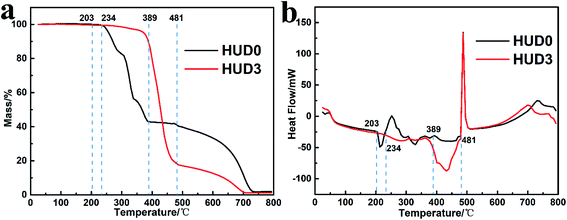
Furthermore, the thermogravimetric analysis (TGA) was performed to illustrate the effect of urea on thermal behaviors of HUD0 and HUD3. As displayed in Fig. 2a, HUD0 exhibits about 57% weight loss from 200 to 390 °C and presents multiple weight-loss steps along the entire TGA process, in which HUD0 molecules might be successively melt (203 °C) and condensed to melamine (234 °C) and polymeric melem (389 °C).39 In contrast, apart from the slight weight loss before 360 °C, HUD3 shows totally different thermal behavior with only one big mass loss step before 481 °C, which illustrates the hydrothermal intermediates of DCDA and urea are MCA. Furthermore, differential scanning calorimetry (DSC) was further utilized to examine the formation temperature of g-C3N4. As shown in Fig. 2b, both HUD0 and HUD3 exhibit strong exothermic peaks starting at about 481 °C, which indicates the generation of g-C3N4.39 Compared with HUD0, the yield of g-C3N4 obtained by annealing HUD3 at 520 °C is relatively low (Fig. 2a) since self-templates MCA releases more NH3,31 which is related to the structure of MCA.
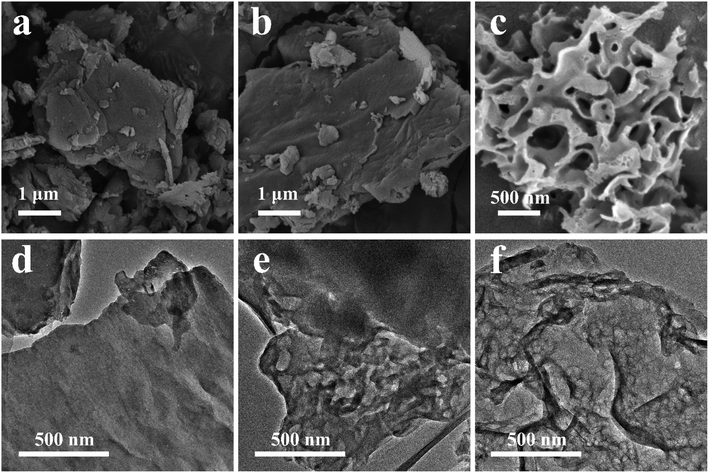
SEM images are showed in Fig. 3a–c to analyze the microstructure of the synthesized intermediates. The raw material DCDA (Fig. 3a) exhibits a square block structure with a size of several hundred microns. After hydrothermal treatment, the size of HUD0 (Fig. 3b) has no obvious change except that its surface becomes rougher than that of DCDA. However, the introduction of urea induces a completely different architecture (Fig. 3c) compared with DCDA and HUD0. The size of HUD3 is reduced to a few microns with pieces of fragments on its surface. Due to the effect of bubbles generated by urea, the growth of intermediate HUD3 was decreased, resulting in a smaller particle size and low crystallinity, which is consistent with the XRD data (Fig. 1b). The obvious difference in the microstructures of the precursors might have significant impact on the morphology of the prepared g-C3N4. Micro-size MCA with pieces of fragments is easier to release more gas which would lead to low yield of annealing HUD3 and a porous structure of g-C3N4.
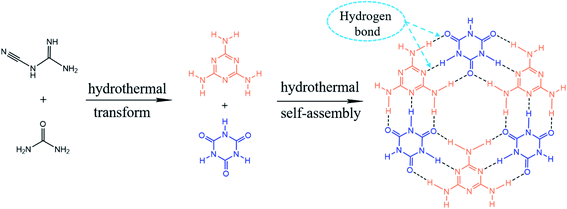
According to the aforementioned results, the possible formation mechanism of MCA is proposed as shown in Fig. 4. DCDA would react with urea and then undergo molecular reformation and partial polymerization to form melamine and cyanuric acid. Afterwards, melamine and cyanuric acid are combined to generate MCA network through the hydrogen bonds via amino groups. Especially, excessive urea would decompose and release NH3 bubbles, resulting in low crystallization of MCA crystals and modulating the physicochemical properties of MCA. The analyses above verify the hypothesis that DCDA could react with urea and transform into MCA during the hydrothermal process.
3.2. Photocatalytic activity of the obtained g-C3N4 samples
DCN, UD0 and UDx were prepared by annealing the corresponding precursors DCDA, HUD0 and HUDx, respectively. Their photocatalytic activity was evaluated by degrading RhB under visible light illumination. As showed in Fig. 5a, at the end of the dark adsorption, the concentration of RhB decreases to varying degrees. It's apparent that UDx could adsorb more RhB than DCN. Especially, 7.5% RhB can be adsorbed by UD3, which is 3 times higher than that of DCN (2.3%), indicating that UD3 possesses more active functional groups and larger specific surface area. After illumination, compared with unmodified bulk DCN, the photocatalytic activity of UD0 is slightly improved, which demonstrates the positive effect of hydrothermal process. After introducing urea as porogen during the synthesis, the photocatalytic activity of UDx is further improved. Especially, photocatalytic activity of UDx increases with the increment of urea: DCDA ratio x from 1 to 3 and then decreases when x increases to 4. UD3 displays the highest photocatalytic activity which degraded RhB by 98.3% within 25 minutes. Hence, the optimized molar ratio of urea: DCDA is 3. As discussed above, the hydrothermal duration has also impact on the structural and physicochemical properties of the precursors HUDx, which might further affect the photocatalytic efficiency of the derived g-C3N4. Therefore, in order to obtain g-C3N4 with the best photocatalytic activity, the hydrothermal duration was optimized. UD3-8 h shows relatively poor photocatalytic activity. The photocatalytic performance of UD3 and UD3-16 h increases with the extension of hydrothermal duration (Fig. 5b). UD3-16 h exhibits almost the same degradation efficiency as UD3, signifying further increasing hydrothermal duration has little effect on the improvement of photocatalytic performance. Therefore, hydrothermal duration is optimized as 12 h. Based on the above results, it is confirmed that urea induced molecular self-assembly into MCA could prepare highly efficient carbon nitride for organic degradation.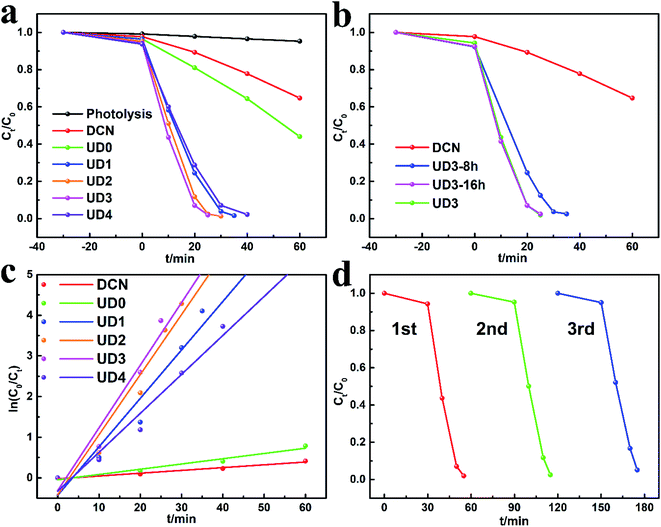 | ||
| Fig. 5 (a and b) The photocatalytic degradation performances for RhB, (c) the corresponding ln(C0/Ct) versus reaction time t, (d) cycling tests for the photodegradation of RhB by UD3. | ||
To quantify the degradation kinetics of RhB, a pseudo-first-order kinetics model was used and it can be expressed by the following equation (eqn (1)).40
| ln(C0/Ct) = kt | (1) |
| Photocatalyst | Ccat (mg ml−1) | CRhB (mg L−1) | Degradation rate | k (min−1) | Enhancement factor over reference photocatalyst | Ref. |
|---|---|---|---|---|---|---|
| Wrinkled porous g-C3N4 nanosheets | 0.5 | 20 | 25 min, 98.3% | 0.1542 | 22.3 | This work |
| Ordered hollow g-C3N4 | 1.0 | 10 | 105 min, 100% | — | — | 24 |
| Hollow spheres g-C3N4 | 1.0 | 10 | 60 min, 100% | 0.062 | 10 | 25 |
| Honeycomb-like g-C3N4 | 0.2 | 20 | 40 min, 99% | 0.1791 | 17.6 | 28 |
| Urea-derived porous g-C3N4 | 0.17 | 12 | 25 min, 100% | — | — | 32 |
| Porous hexagonal prism g-C3N4 | 1.0 | 10 | 80 min, 100% | 0.053 | 12 | 41 |
To investigate the stability of UD3, regeneration experiments were further carried out. The catalyst was recovered by washing with ethanol, centrifugation and drying. According to Fig. 5d, the RhB degradation efficiency remained above 94.8% after 3 cycles. Base on the XRD (Fig. S2a†) and FTIR (Fig. S2b†) analyses, no substantial changes in the crystal phase and chemical structure of regenerated UD3 sample were observed after 3 successive cycles, which indicates its good reusability and stability for RhB removal. In order to investigate the reasons for the improved performance of the modified g-C3N4, several major samples including DCN, UD0 and UD3 were selected to perform various characterizations to explore the influence of self-assembly strategies on their nanostructures and photochemical properties.
3.3. Microstructures and chemical compositions of obtained g-C3N4 samples
SEM images of DCN, UD0 and UD3 are displayed in Fig. 6. The typical block structure of DCN and UD0 can be clearly observed in Fig. 6a and b. g-C3N4 with block structure usually exhibits poor photocatalytic activity due to the high potential barriers between layers which lead to poor transportation of photo-generated charge carriers.33 During the thermal polycondensation process of MCA intermediates, many g-C3N4 lamellas were piled up chaotically to form a wrinkled porous structure (Fig. 6c and S4a, b†). When urea was introduced into the hydrothermal process at a molar ratio of 1![[thin space (1/6-em)]](https://www.rsc.org/images/entities/char_2009.gif) :
:![[thin space (1/6-em)]](https://www.rsc.org/images/entities/char_2009.gif) 1, the obtained UD1 exhibits flat nanosheets with some holes (Fig. S4a†). With the increment of urea
1, the obtained UD1 exhibits flat nanosheets with some holes (Fig. S4a†). With the increment of urea![[thin space (1/6-em)]](https://www.rsc.org/images/entities/char_2009.gif) :
:![[thin space (1/6-em)]](https://www.rsc.org/images/entities/char_2009.gif) DCDA ratio, UD2 (Fig. S4b†) with small wrinkled fragments transforms to UD3 (Fig. 6c) and UD4 (Fig. S4c†) with wrinkled porous nanosheets. To further reveal the microstructural differences of DCN, UD0 and UDx, their TEM images are further examined and the results are shown in Fig. 6d–f and S4d–f.† DCN and UD0 both exhibit block structure which is consistent with the results of SEM (Fig. 6a and b). A few holes can be observed on UD0 which might originate from rough surface of HUD0. All UDx samples exhibit porous nanosheets structure and the number of holes tends to increase with the increment of urea addition. According to the SEM and TEM images (Fig. 6 and S4†), the specific surface area of UDx would be greatly increased due to their porous nanosheet structure compared with DCN and UD0. The unique self-template structures of HUDx are the key for the generation of porous morphology in UDx. During annealing process, micro-size HUDx would reform into nanosheets and simultaneously a large amount of gas (NH3 and CO2) released punched abundant holes in the nanosheets, leading to the formation and evolution of a wrinkled porous nanosheets structure. Importantly, the final porous nanosheets structure can be obtained directly by calcination rather than templating, a significant advantage of supramolecular self-assembly strategy achieved by hydrothermal treatment of urea and DCDA.
DCDA ratio, UD2 (Fig. S4b†) with small wrinkled fragments transforms to UD3 (Fig. 6c) and UD4 (Fig. S4c†) with wrinkled porous nanosheets. To further reveal the microstructural differences of DCN, UD0 and UDx, their TEM images are further examined and the results are shown in Fig. 6d–f and S4d–f.† DCN and UD0 both exhibit block structure which is consistent with the results of SEM (Fig. 6a and b). A few holes can be observed on UD0 which might originate from rough surface of HUD0. All UDx samples exhibit porous nanosheets structure and the number of holes tends to increase with the increment of urea addition. According to the SEM and TEM images (Fig. 6 and S4†), the specific surface area of UDx would be greatly increased due to their porous nanosheet structure compared with DCN and UD0. The unique self-template structures of HUDx are the key for the generation of porous morphology in UDx. During annealing process, micro-size HUDx would reform into nanosheets and simultaneously a large amount of gas (NH3 and CO2) released punched abundant holes in the nanosheets, leading to the formation and evolution of a wrinkled porous nanosheets structure. Importantly, the final porous nanosheets structure can be obtained directly by calcination rather than templating, a significant advantage of supramolecular self-assembly strategy achieved by hydrothermal treatment of urea and DCDA.
To further inspect the detailed specific surface area and pore information of the obtained materials, N2 adsorption–desorption isotherms are displayed in Fig. 7. The N2 adsorption–desorption isotherms of DCN, UD0 and UD3 were classified as type IV isotherms, which increased rapidly at relative high pressure (P/P0 > 0.83). BET surface areas (SBET) and pore volumes for all the samples were calculated and the results are summarized in Table S2†. Compared with DCN (6.730 m2 g−1) and UD0 (7.277 m2 g−1), UD3 shows significantly increased specific surface area (36.457 m2 g−1), which is about 5.4-times of DCN and 5.0-times of UD0. Meanwhile, the pore volume of UD3 (0.149 cm3 g−1) are obviously larger than those of DCN (0.045 cm3 g−1) and UD0 (0.069 cm3 g−1). The pore size distributions of all samples are displayed in the inset graphs of Fig. 7 and their average pore diameter are around several nanometers, which confirms the mesoporous nature of the materials. The N2 adsorption–desorption results are also consistent with the results of UD3 sample by the SEM and TEM images (Fig. 6 and S4†), which highlights the role of synthesis conditions in creating unique morphology of UD3. Specifically, excessive urea acts as a porogen to decompose and produce gas which leads to the formation of supramolecular MCA self-templates and thus wrinkled porous UD3 nanosheets. It is worthy to note that UD3 with enhanced BET surface area and pore volume could provide more active sites and boost mass transfer process, which are favorable for the photocatalytic performance.
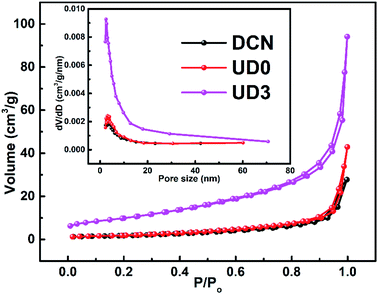 | ||
| Fig. 7 N2 adsorption–desorption isotherms of DCN, UD0 and UD3 and their corresponding pore size distribution plots (the inset graphs). | ||
XRD patterns and FTIR spectra were collected to illustrate the molecular structural properties of the obtained samples. As showed in Fig. S5a,† all samples exhibit two XRD characteristic peaks of g-C3N4 at 12.9° and 27.1° (JCPDS 87-1526), ascribing to (100) peak of in-plane tri-s-triazin structural packing motif and (002) graphitic-like interlayer-stacking peak, respectively.42 Compared to DCN and UD0, UD3 presents weaker diffraction peaks due to the poor crystallinity and low in-planar ordering degree originated from the porous nanosheets, which might be related to the low crystallinity of HUD3 (Fig. 1b). In addition, the (002) peak of UD3 shifts slightly to higher angel, indicating a decrease in the interlayer stacking distance, which would facilitate faster photo-generated charge separation and transportation.43 The structures were further confirmed by FTIR spectra, as shown in Fig. S5b.† All samples show similar FTIR spectra, revealing their similar chemical structures. The absorption between 1200–1700 cm−1 is assigned to the typical stretching modes of aromatic C–N heterocycles.44 The absorption at 808 cm−1 is the typical out-of-plane bending mode of triazine units, and the broad bands in the range of 3100–3500 cm−1 correspond to the vibration modes for N–H.44 The peaks of UD3 are slightly sharper than those of DCN and UD0, which might be due to the more ordered packing of tri-s-triazine motifs in the nanosheets.44
The detailed surface chemical states and compositions of DCN, UD0 and UD3 were further studied by XPS. In Fig. S6a,† all of the surveyed spectra exhibit similar chemical elements including carbon, nitrogen and small amounts of oxygen. The high-resolution C 1s spectra (Fig. S6b†) were fitted into two peaks at 284.6 and 288.2 eV, corresponding to contaminated carbon and sp2-hybridized carbon (N–C![[double bond, length as m-dash]](https://www.rsc.org/images/entities/char_e001.gif) N) in the nitrogen-rich heterocyclic ring, respectively.45 On the other hand, The N 1s (Fig. S6c†) peak could be fitted into four distinct peaks. The peak at 398.6 eV can be assigned to two-coordinate sp2-hybridized nitrogen atoms (C–N
N) in the nitrogen-rich heterocyclic ring, respectively.45 On the other hand, The N 1s (Fig. S6c†) peak could be fitted into four distinct peaks. The peak at 398.6 eV can be assigned to two-coordinate sp2-hybridized nitrogen atoms (C–N![[double bond, length as m-dash]](https://www.rsc.org/images/entities/char_e001.gif) C).46 The subpeaks at 399.6 and 401.1 eV originate from three-coordinate (N–C3) and C–NH groups, respectively.46 The peaks at 404.4 eV can be ascribed to the charging effects of π-excitations.13 XPS quantitative analysis (Fig. S7†) shows that the near-surface N/C atomic ratios of DCN, UD0 and UD3 are 1.45, 1.44 and 1.47, respectively. The nearly same N/C atomic ratio excludes the existence of N or C vacancies. Furthermore, solid-state 13C NMR spectra were collected to investigate the chemical environment of C element in the melon skeleton of DCN, UD0 and UD3. As shown in Fig. S6d,† all samples show two strong peaks located at 156.2 and 165.5 ppm corresponding to the characteristic C atoms of N
C).46 The subpeaks at 399.6 and 401.1 eV originate from three-coordinate (N–C3) and C–NH groups, respectively.46 The peaks at 404.4 eV can be ascribed to the charging effects of π-excitations.13 XPS quantitative analysis (Fig. S7†) shows that the near-surface N/C atomic ratios of DCN, UD0 and UD3 are 1.45, 1.44 and 1.47, respectively. The nearly same N/C atomic ratio excludes the existence of N or C vacancies. Furthermore, solid-state 13C NMR spectra were collected to investigate the chemical environment of C element in the melon skeleton of DCN, UD0 and UD3. As shown in Fig. S6d,† all samples show two strong peaks located at 156.2 and 165.5 ppm corresponding to the characteristic C atoms of N![[double bond, length as m-dash]](https://www.rsc.org/images/entities/char_e001.gif) C–N2 and N
C–N2 and N![[double bond, length as m-dash]](https://www.rsc.org/images/entities/char_e001.gif) C–N(NHx) in the heptazine unites, respectively,47 which further excludes the presence of defects.
C–N(NHx) in the heptazine unites, respectively,47 which further excludes the presence of defects.
3.4. Optical and photoelectrochemical properties of obtained g-C3N4 samples
The light-trapping ability is of great significance for the photocatalytic process. In order to evaluate the optical properties of all samples, UV-visible absorption spectra data were measured and the results are shown in Fig. 8a. Compared with DCN, the absorption edge of UD0 slightly blue-shifts. After introducing urea to synthesize MCA, the absorption edge of UD3 clearly blue-shifts, resulted from quantum size effect of the UD3 nanosheets.48 In addition, the visible absorption of UD3 is enlarged above 500 nm, which is attributed to the multiple reflection and scattering effect of light in the porous microstructure (Fig. 6c) and is beneficial for improved photocatalytic performance.49 Furthermore, the corresponding band gaps (Eg) were correlated from Tauc's plots (Fig. 8b) as 2.58, 2.60 and 2.66 eV for DCN, UD0 and UD3, respectively. Increased band gap contributes to the reduction of excitons' recombination, which would be favorable for photocatalytic degradation.50 Moreover, band structure was studied by ultraviolet photoelectron spectroscopy (UPS) and the results are shown in Fig. 8c. The work functions (φ) of DCN, UD0 and UD3 were determined to be 5.04, 5.08 and 5.22 eV (vs. vacuum, Evac) respectively by using the equation φ = 21.22 − (Ecutoff − Ei). Here, Ei equals 0 eV due to the calibration of the equipment.51 The distances between valence band maximum (VBM) and Fermi level (Ef) of DCN, UD0 and UD3 were about 1.82, 1.72 and 1.53 eV, with the corresponding VBM positions calculated to be 6.86, 6.80 and 6.75 eV, respectively. Therefore, on the basis of the equation ECB − EVB = Eg, the conduction band minimum (CBM) values were determined to be 4.28, 4.20 and 4.09 eV for DCN, UD0 and UD3, respectively. According to the relationship between the vacuum energy (Eabs) and the normal electrode potential (Eθ), Eabs = − Eθ − 4.5, the corresponding band structure diagrams are depicted in Fig. 8d.52 The results demonstrate that UD3 has more negative conduction band potential than DCN and UD0, which would result in more powerful ability to generate strong-oxidating superoxide radicals (˙O2−) and thus excellent degrading ability for RhB.53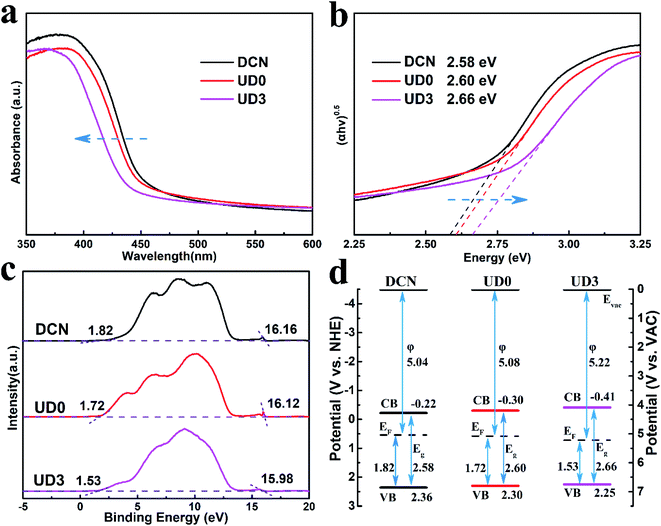 | ||
| Fig. 8 (a) UV-visible absorption spectroscopy, (b) the corresponding Tauc's plots, (c) UPS and (d) the corresponding band structure diagrams of DCN, UD0 and UD3. | ||
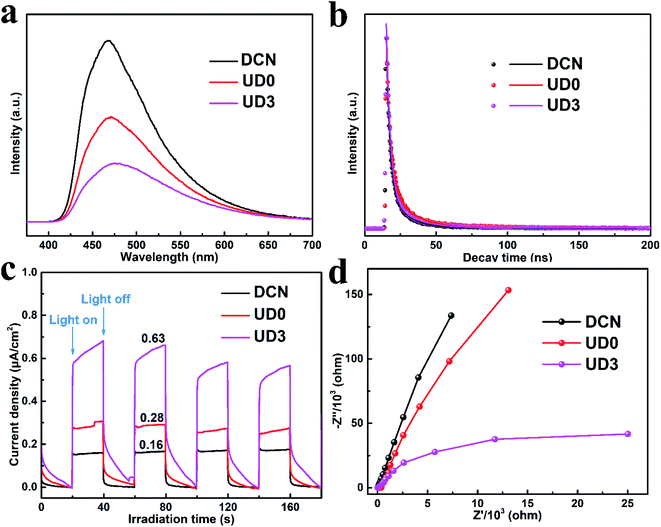
Photoluminescence spectroscopy is a powerful technology to study the transfer and recombination of photo-induced electron–hole pairs in photocatalysts. It should be noted that higher PL intensity is related to faster recombination of photo-induced charge carriers, thereby resulting in a poor photocatalytic activity, and vice versa.54 UD0 presents restrained intensity of PL emission peak than that of DCN (Fig. 9a) due to suppressed charge carrier recombination of UD0. However, the PL intensity of UD3 is far weaker than DCN and UD0, demonstrating that wrinkled porous nanosheets could facilitate efficient separation of photo-induced hole–electron pairs and thereby promote the photocatalytic degradation of contaminants.55 The lifetimes of charge carriers were further examined by correlating time-resolved fluorescence spectra. As shown in Fig. 9b, the fluorescence decay curves can be well fitted by bi-exponential function (eqn (2)).56
| I(t) = A1 exp(−t/τ1) + A2 exp(−t/τ2) | (2) |
The photoelectronic properties were further investigated by measuring the transient photocurrent response and electrochemical impedance spectra. In comparison with DCN and UD0, UD3 exhibits enhanced photocurrent response, as shown in Fig. 9c. Specifically, UD3 shows the strongest photocurrent density, which is approximately 3.9 and 2.2 times higher than those of DCN and UD0, respectively. This phenomenon is mainly attributed to the wrinkled porous nanosheets structure of UD3 which could enhance the generation as well as the transportation of excited charges and provide more mass transfer channel.55 To obtain a deep insight into the charge transport behavior, electrochemical impedance spectra were examined and the results are shown in Fig. 9d. UD3 displays an overwhelmingly smaller semicircular of Nyquist plot than DCN and UN0, manifesting a lower interfacial resistance and more efficient charge transfer of UD3.53 Therefore, it can be deemed that UD3 could efficiently separate the photo-generated electron–hole pairs and transfer them to remove pollutant adsorbed on the active sites, which is the dominant factor in promoting its photocatalysis efficiency.
3.5. Active species during degradation
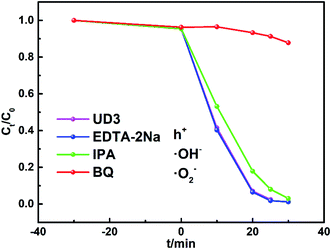
To further elucidate the degradation mechanism of RhB by UD3 under visible light irradiation, the active species trapping experiments were conducted by using ethylenediaminetetraacetic acid disodium (EDTA-2Na), isopropyl alcohol (IPA) and benzoquinone (BQ), which could act as effective holes (h+), ˙OH− and ˙O2− scavengers, respectively.57,58 As depicted in Fig. 10, the photocatalytic activity was significantly inhibited by BQ (1 mM) and the decomposition rate of RhB greatly reduced from 98.3% to 12.2%, which suggests that ˙O2− is the major active species of the UD3 sample. Meanwhile, the addition of 10 mM IPA and 1 mM EDTA-2Na almost made no difference on the photodegradation of RhB, indicating ˙OH− and h+ are not the main active species for the degradation. These results are consistent with the calculated energy band of UD3, which shown that the prepared UD3 can produce ˙O2− as major active species for degradation.534. Conclusions
In summary, wrinkled porous g-C3N4 nanosheets were successfully fabricated from self-assembly supramolecular intermediate MCA by hydrothermal treatment of cheap DCDA and urea. Urea plays a vital role in the process of MCA preparation and g-C3N4 modification. On one hand, urea, as a cheap monomer, could react with DCDA to form MCA. On the other hand, urea could serve as porogen and the bubbles generated by urea decomposition are conducive for the formation of micro-size MCA self-templates and thus wrinkled porous g-C3N4 nanosheets could be obtained. The possible formation mechanism of MCA is proposed according to the FTIR spectra and XRD patterns, certifying the functional groups changes including disappearance of –C![[triple bond, length as m-dash]](https://www.rsc.org/images/entities/char_e002.gif) N, emergence of triazine ring and –C
N, emergence of triazine ring and –C![[double bond, length as m-dash]](https://www.rsc.org/images/entities/char_e001.gif) O and the generation of MCA. The obtained wrinkled porous g-C3N4 nanosheets exhibit highly efficient photocatalytic performance compared with g-C3N4 from traditional synthesis method by melamine/cyanuric acid-derived MCA. Among them, UD3 synthesized by optimized preparation conditions could remove 98.3% of RhB in 25 min and the degradation rate is increased by 22.3 times compared with bulk g-C3N4. The photocatalytic activity of the wrinkled porous g-C3N4 is remarkably enhanced due to the urea-induced larger specific surface area, more exposed actives sites, better light harvesting ability, longer fluorescence lifetime, faster transfer and advanced separation efficiency of the photogenerated electron–hole pairs. In addition, the energy band structure of UD3 was adjusted and the more negative conduction band potential is conducive to produce powerful active species ˙O2− to mineralize RhB. This research might promote the applications of supramolecular MCA self-assembled by cheaper precursors to synthesize highly-efficient g-C3N4 photocatalysts with controllable nanostructures.
O and the generation of MCA. The obtained wrinkled porous g-C3N4 nanosheets exhibit highly efficient photocatalytic performance compared with g-C3N4 from traditional synthesis method by melamine/cyanuric acid-derived MCA. Among them, UD3 synthesized by optimized preparation conditions could remove 98.3% of RhB in 25 min and the degradation rate is increased by 22.3 times compared with bulk g-C3N4. The photocatalytic activity of the wrinkled porous g-C3N4 is remarkably enhanced due to the urea-induced larger specific surface area, more exposed actives sites, better light harvesting ability, longer fluorescence lifetime, faster transfer and advanced separation efficiency of the photogenerated electron–hole pairs. In addition, the energy band structure of UD3 was adjusted and the more negative conduction band potential is conducive to produce powerful active species ˙O2− to mineralize RhB. This research might promote the applications of supramolecular MCA self-assembled by cheaper precursors to synthesize highly-efficient g-C3N4 photocatalysts with controllable nanostructures.
Conflicts of interest
There are no conflicts to declare.Acknowledgements
This research is financially supported by the Tianjin Natural Science Foundation (grant number 18JCZDJC38100 and 18JCYBJC40800).References
- J. Bi, X. Huang, J. Wang, Q. Tao, T. Wang and H. Hao, J. Mater. Chem. A, 2020, 8, 14415–14440 RSC.
- J. Liao, W. Cui, J. Li, J. Sheng, H. Wang, X. a. Dong, P. Chen, G. Jiang, Z. Wang and F. Dong, Chem. Eng. J., 2020, 379, 122282 CrossRef CAS.
- K. Li, Y. He, P. Chen, H. Wang, J. Sheng, W. Cui, G. Leng, Y. Chu, Z. Wang and F. Dong, J. Hazard. Mater., 2020, 392, 122357 CrossRef CAS PubMed.
- L. Jiang, X. Yuan, G. Zeng, Z. Wu, J. Liang, X. Chen, L. Leng, H. Wang and H. Wang, Appl. Catal., B, 2018, 221, 715–725 CrossRef CAS.
- W. J. Ong, L. L. Tan, Y. H. Ng, S. T. Yong and S. P. Chai, Chem. Rev., 2016, 116, 7159–7329 CrossRef CAS.
- N. Tian, H. Huang, X. Du, F. Dong and Y. Zhang, J. Mater. Chem. A, 2019, 7, 11584–11612 RSC.
- C. Li, S. Yu, H. Che, X. Zhang, J. Han, Y. Mao, Y. Wang, C. Liu and H. Dong, ACS Sustainable Chem. Eng., 2018, 6, 16437–16447 CrossRef CAS.
- P. Jiménez-Calvo, V. Caps, M. N. Ghazzal, C. Colbeau-Justin and V. Keller, Nano Energy, 2020, 75, 104888 CrossRef.
- S. Ali, M. Humayun, W. Pi, Y. Yuan, M. Wang, A. Khan, P. Yue, L. Shu, Z. Zheng, Q. Fu and W. Luo, J. Hazard. Mater., 2020, 397, 122708 CrossRef CAS PubMed.
- L. Chen, D. Zhu, J. Li, X. Wang, J. Zhu, P. S. Francis and Y. Zheng, Appl. Catal., B, 2020, 273, 119050 CrossRef CAS.
- Y. Zhou, W. Lv, B. Zhu, F. Tong, J. Pan, J. Bai, Q. Zhou and H. Qin, ACS Sustainable Chem. Eng., 2019, 7, 5801–5807 CrossRef CAS.
- P. Chen, B. Lei, X. Dong, H. Wang, J. Sheng, W. Cui, J. Li, Y. Sun, Z. Wang and F. Dong, ACS Nano, 2020, 14, 15841–15852 CrossRef PubMed.
- W. Wang, Q. Niu, G. Zeng, C. Zhang, D. Huang, B. Shao, C. Zhou, Y. Yang, Y. Liu, H. Guo, W. Xiong, L. Lei, S. Liu, H. Yi, S. Chen and X. Tang, Appl. Catal., B, 2020, 273, 119051 CrossRef CAS.
- F. Guo, L. Wang, H. Sun, M. Li and W. Shi, Inorg. Chem. Front., 2020, 7, 1770–1779 RSC.
- K. S. Lakhi, D. H. Park, K. Al-Bahily, W. Cha, B. Viswanathan, J. H. Choy and A. Vinu, Chem. Soc. Rev., 2017, 46, 72–101 RSC.
- J. Wen, J. Xie, X. Chen and X. Li, Appl. Surf. Sci., 2017, 391, 72–123 CrossRef CAS.
- Q. Guo, Y. Zhang, H.-S. Zhang, Y. Liu, Y.-J. Zhao, J. Qiu and G. Dong, Adv. Funct. Mater., 2017, 27, 1703711 CrossRef.
- C. Wang, G. Liu, K. Song, X. Wang, H. Wang, N. Zhao and F. He, ChemCatChem, 2019, 11, 6364–6371 CrossRef CAS.
- Z. Zeng, X. Quan, H. Yu, S. Chen and S. Zhang, J. Catal., 2019, 375, 361–370 CrossRef CAS.
- J.-H. Zhang, M.-J. Wei, Z.-W. Wei, M. Pan and C.-Y. Su, ACS Appl. Nano Mater., 2020, 3, 1010–1018 CrossRef CAS.
- Y. Xiao, G. Tian, W. Li, Y. Xie, B. Jiang, C. Tian, D. Zhao and H. Fu, J. Am. Chem. Soc., 2019, 141, 2508–2515 CrossRef CAS PubMed.
- Y. Wang, X. Wang, M. Antonietti and Y. Zhang, ChemSusChem, 2010, 3, 435–439 CrossRef CAS PubMed.
- J. Zhang, M. Zhang, C. Yang and X. Wang, Adv. Mater., 2014, 26, 4121–4126 CrossRef CAS PubMed.
- M. Shalom, S. Inal, C. Fettkenhauer, D. Neher and M. Antonietti, J. Am. Chem. Soc., 2013, 135, 7118–7121 CrossRef CAS PubMed.
- Y.-S. Jun, E. Z. Lee, X. Wang, W. H. Hong, G. D. Stucky and A. Thomas, Adv. Funct. Mater., 2013, 23, 3661–3667 CrossRef CAS.
- C. Zhou, C. Lai, D. Huang, G. Zeng, C. Zhang, M. Cheng, L. Hu, J. Wan, W. Xiong, M. Wen, X. Wen and L. Qin, Appl. Catal., B, 2018, 220, 202–210 CrossRef CAS.
- M. Shalom, M. Guttentag, C. Fettkenhauer, S. Inal, D. Neher, A. Llobet and M. Antonietti, Chem. Mater., 2014, 26, 5812–5818 CrossRef CAS.
- J. Huang, W. Cheng, Y. Shi, G. Zeng, H. Yu, Y. Gu, L. Shi and K. Yi, Chemosphere, 2018, 211, 324–334 CrossRef CAS PubMed.
- Y. Liao, S. Zhu, J. Ma, Z. Sun, C. Yin, C. Zhu, X. Lou and D. Zhang, ChemCatChem, 2014, 6, 3419–3425 CrossRef CAS.
- N. N. Vu, C. C. Nguyen, S. Kaliaguine and T. O. Do, ChemSusChem, 2019, 12, 291–302 CrossRef CAS PubMed.
- Y. Zhang, J. Liu, G. Wu and W. Chen, Nanoscale, 2012, 4, 5300–5303 RSC.
- H.-B. Fang, Y. Luo, Y.-Z. Zheng, W. Ma and X. Tao, Ind. Eng. Chem. Res., 2016, 55, 4506–4514 CrossRef CAS.
- J. Cheng, Z. Hu, Q. Li, X. Li, S. Fang, X. Wu, M. Li, Y. Ding, B. Liu, C. Yang, L. Wen, Y. Liu and K. Lv, Appl. Catal., B, 2019, 245, 197–206 CrossRef CAS.
- Q. Liu, X. Wang, Q. Yang, Z. Zhang and X. Fang, Appl. Catal., B, 2018, 225, 22–29 CrossRef CAS.
- Y. S. Jun, J. Park, S. U. Lee, A. Thomas, W. H. Hong and G. D. Stucky, Angew. Chem., Int. Ed., 2013, 52, 11083–11087 CrossRef CAS PubMed.
- B. C. Knott, J. L. LaRue, A. M. Wodtke, M. F. Doherty and B. Peters, J. Chem. Phys., 2011, 134, 171102 CrossRef PubMed.
- N. A. Khan and S. H. Jhung, Coord. Chem. Rev., 2015, 285, 11–23 CrossRef CAS.
- N. Y. John McGinty, C. Price, J. H. Horst and J. Sefcik, The Handbook of Continuous Crystallization, 2020, pp. 1–50, 10.1039/9781788012140-00001.
- X. Wang, K. Maeda, A. Thomas, K. Takanabe, G. Xin, J. M. Carlsson, K. Domen and M. Antonietti, Nat. Mater., 2009, 8, 76–80 CrossRef CAS PubMed.
- M. Cantarella, A. Di Mauro, A. Gulino, L. Spitaleri, G. Nicotra, V. Privitera and G. Impellizzeri, Appl. Catal., B, 2018, 238, 509–517 CrossRef CAS.
- Y. Chen, F. Ding, A. Khaing, D. Yang and Z. Jiang, Appl. Surf. Sci., 2019, 479, 757–764 CrossRef CAS.
- Y. Zhou, L. Zhang, W. Huang, Q. Kong, X. Fan, M. Wang and J. Shi, Carbon, 2016, 99, 111–117 CrossRef CAS.
- H. Gao, R. Cao, S. Zhang, H. Yang and X. Xu, ACS Appl. Mater. Interfaces, 2019, 11, 2050–2059 CrossRef CAS PubMed.
- Q. Liang, Z. Li, Z.-H. Huang, F. Kang and Q.-H. Yang, Adv. Funct. Mater., 2015, 25, 6885–6892 CrossRef CAS.
- L. Lin, H. Ou, Y. Zhang and X. Wang, ACS Catal., 2016, 6, 3921–3931 CrossRef CAS.
- P. Niu, L. C. Yin, Y. Q. Yang, G. Liu and H. M. Cheng, Adv. Mater., 2014, 26, 8046–8052 CrossRef CAS PubMed.
- D. Zhao, C. L. Dong, B. Wang, C. Chen, Y. C. Huang, Z. Diao, S. Li, L. Guo and S. Shen, Adv. Mater., 2019, 1903545, DOI:10.1002/adma.201903545.
- Z. Tong, D. Yang, Z. Li, Y. Nan, F. Ding, Y. Shen and Z. Jiang, ACS Nano, 2017, 11, 1103–1112 CrossRef CAS PubMed.
- X. Chen, Y.-S. Jun, K. Takanabe, K. Maeda, K. Domen, X. Fu, M. Antonietti and X. Wang, Chem. Mater., 2009, 21, 4093–4095 CrossRef CAS.
- Q. Liu, X. Wang, Q. Yang, Z. Zhang and X. Fang, Appl. Surf. Sci., 2018, 450, 46–56 CrossRef CAS.
- X. Liu, Z. Liu, B. Sun, X. Tan, H. Ye, Y. Tu, T. Shi, Z. Tang and G. Liao, Nano Energy, 2018, 50, 201–211 CrossRef CAS.
- J. C. Wang, L. Zhang, W. X. Fang, J. Ren, Y. Y. Li, H. C. Yao, J. S. Wang and Z. J. Li, ACS Appl. Mater. Interfaces, 2015, 7, 8631–8639 CrossRef CAS PubMed.
- C. Liu, Y. Zhang, F. Dong, A. H. Reshak, L. Ye, N. Pinna, C. Zeng, T. Zhang and H. Huang, Appl. Catal., B, 2017, 203, 465–474 CrossRef CAS.
- J. Wang, G. Wang, J. Jiang, Z. Wan, Y. Su and H. Tang, J. Colloid Interface Sci., 2020, 564, 322–332 CrossRef CAS PubMed.
- J. Ran, T. Y. Ma, G. Gao, X.-W. Du and S. Z. Qiao, Energy Environ. Sci., 2015, 8, 3708–3717 RSC.
- Y. Yu, W. Yan, X. Wang, P. Li, W. Gao, H. Zou, S. Wu and K. Ding, Adv. Mater., 2018, 30, 1705060 CrossRef PubMed.
- W. Wang, P. Xu, M. Chen, G. Zeng, C. Zhang, C. Zhou, Y. Yang, D. Huang, C. Lai, M. Cheng, L. Hu, W. Xiong, H. Guo and M. Zhou, ACS Sustainable Chem. Eng., 2018, 6, 15503–15516 CrossRef CAS.
- H. Zhang, G. Tang, X. Wan, J. Xu and H. Tang, Appl. Surf. Sci., 2020, 530, 147234 CrossRef CAS.
Footnote |
| † Electronic supplementary information (ESI) available. See DOI: 10.1039/d1ra03524j |
| This journal is © The Royal Society of Chemistry 2021 |

