
 Open Access Article
 This Open Access Article is licensed under a Creative Commons Attribution-Non Commercial 3.0 Unported Licence
Nylon membranes modified by gold nanoparticles as surface-enhanced Raman spectroscopy substrates for several pesticides detection†
Haitao Yu a,
Qian Lyua,
Xueli Chenab,
Dongyi Guoa,
Dingping Hea,
Xiwen Jiaa,
Lujia Hana and
Weihua Xiao*a
a,
Qian Lyua,
Xueli Chenab,
Dongyi Guoa,
Dingping Hea,
Xiwen Jiaa,
Lujia Hana and
Weihua Xiao*a
aCollege of Engineering, China Agricultural University (East Campus), Box 191, Beijing 100083, China. E-mail: xwhddd@163.com; Fax: +86 10 62736778; Tel: +86 10 62736778
bLaboratory of Renewable Resources Engineering, Department of Agricultural and Biological Engineering, Purdue University, West Lafayette, Indiana 47907, USA
First published on 9th July 2021
Abstract
Surface enhanced Raman spectroscopy (SERS) is an attractive means for trace compound detection because of its high sensitivity, however, the poor reproducibility is a major challenge. Herein, we propose a facile SERS strategy employing the several developed test processes to improve the repeatability of the SERS analysis based on regular nylon membranes as substrates to detect trace compounds. Various methods, including in situ reduction, immersion adsorption, and filtration, were first compared to prepare composite substrates using nylon membranes and gold nanoparticles. The substrates prepared by filtration showed the best test parallelism (RSD = 7.85%). Its limit of detection (LOD) could reach 10−8 g mL−1 with a good linear relationship in the range 10−8 to 10−7 g mL−1. Finally, three pesticide solutions were tested to verify the substrate applicability. A superior LOD of 10−8 g mL−1 was observed for thiram, whereas the LODs of both phorate and benthiocarb could reach 10−6 g mL−1. Overall, modifying nylon membrane substrates with gold nanoparticles improves the repeatability and economic viability of SERS and favors its wider commercial application for detecting trace compounds.
Introduction
Surface enhanced Raman scattering, the increased Raman scattering signal caused by the adsorption of molecules on rough plasmonic metal nanoparticles,1 has been well developed in recent years. Gold and silver nanoparticles have good localized surface plasmon resonance (LSPR)2,3 and are the most commonly used materials.4,5 Compared with traditional analysis methods, SERS has the advantages of being nondestructive and allowing for fast detection for trace compounds.6 The SERS enhancement factor can reach 105 to 106 and this can be attributed to the chemical and electromagnetic enhancement afforded by the metal nanoparticles.7With growing environmental concerns, the fast detection of trace pollutants such as pesticides, dyes, and antibiotics using SERS has attracted growing attention.8,9 Although nanoparticles in colloidal solution can be easily obtained for SERS analysis,10 the distribution of “hot spots” is not controllable and uniform, which affects the reproducibility in practical application. Various types of SERS substrates have been designed to improve uniformity, stability, and sensitivity via immobilization of gold or silver nanoparticles on rigid or flexible substrates.11 For this, electron beam etching,12 electron beam evaporation,13 or interface deposition methods14 have been employed for SERS substrate fabrication. However, most of these methods are complicated and the substrates are costly. Compared with the rigid substrate, paper-based or membrane-based substrates have the superiorities of portability, low cost, and simple operation, possessing the potential for practical SERS applications.15,16
Standardization of testing methods is necessary to reliably bring the technology to market.17,18 However, most reports on flexible substrates provide LODs (limits of detection) of the extract analyte using unique test methods, and it is rare to see comparative studies of the different test methods. Fateixa and co-workers developed a SERS active substrate (Ag/LCP) based on liquid-crystal polymer (LCP) textile fibers decorated with Ag NPs, which has satisfactory LODs for thiram (0.024 ppm).19 It still needs two steps to prepare the substrates and enrich the analyte for detection. To obtain a fast and reliable SERS test method, we compared a colloidal test solution and several nylon membrane substrates immobilized with Au NPs. The sample loading method, which included the immersion and drop tests, was also investigated. The stability, repeatability, and LODs of the test were determined, and the enhancement mechanisms are explained via appropriate characterization methods.
Materials and methods
Materials
The following materials were used as purchased: nylon membrane (0.1 mm pore diameter, Shanghai Xingya purification material factory); glass dish (10 mm diameter, Shanghai JingAn Biological Science and Technology Ltd).; chloroauric acid (HAuCl4, Macklin) sodium citrate tribasic dihydrate (Na3C6H5O7·2H2O, 99%, Macklin); p-aminophenol (4-ATP, 97%, Macklin); thiram (99.2%, Beijing Zhongjian Navigation Mark Metering Technology Co. Ltd); phorate (100 μg mL−1, 95.9%, Beijing Zhongjian Navigation Mark Metering Technology Co. Ltd); benthiocarb (98.1%, Dr Ehrenstorfer GmbH). The water was obtained from a Milli-Q system. Au NPs were synthesized via the sodium citrate reduction method, which was modified by Frens et al.20 (details in the ESI†).Nylon membrane composite substrates
In situ reduction substrates (NL-R group): the nylon membrane was cut into small pieces and soaked in a chloroauric acid solution and then boiled. After adding Na3Cit·2H2O for a period of time, the reduction reaction was terminated. Finally, the nylon membrane was taken out and air-dried.Immersion adsorption-substrates (NL-A group): the nylon membrane was completely immersed in the prepared Au NPs solution for 24 h for sufficient adsorption. Then, they were air-dried for testing.
Filtration-substrates (NL-F group): for filtration using a purchased nylon membrane, the red color of the Au NPs disappeared. Filtration was stopped when the color reappeared in the filtrate, which indicated that the largest amount of Au NPs was trapped in the nylon membrane. Then, the filtered membrane was air dried for testing.
Characterization methods
The morphology of the Au NPs filtration substrates were characterized by the field emission scanning electron microscopy (SEM) (Hitachi, SU8020) and the atomic force microscopy (AFM) (Bruker, Multimode 8). The charged property of the surface of the gold nanoparticles (pH = 4.16 ± 0.02) was determined using a Zeta potentiometer (Malvern, Zetasizer Nano). Ultraviolet-visible light spectroscopy (UV-Vis) was used to characterize the Au NP surface plasmon resonance (SPR) information. The FDTD solutions software was used as the simulation software to investigate the enhancement effect with the Au NPs.Acquisition and pre-processing of the SERS
The SERS were acquired using a confocal Raman spectral system (Bruker, SENTERRA II). Before analysis, methanol solutions of 4-ATP with concentrations between 10−4 g mL−1 and 10−8 g mL−1 were prepared. The Au NPs were mixed with the sample at a volume ratio of 1![[thin space (1/6-em)]](https://www.rsc.org/images/entities/char_2009.gif) :1 and 100 μL of the mixed liquid was added to a clean glass dish (Φ = 10 mm) for testing; this sample is referred to as the L group. The air-dried filtration-substrates were fixed on the glass slide. Then, the sample (100 μL) was dropped on the substrates and air-dried for testing (referred to as the drop-test sample). The air-dried filtration-substrates were immersed in the sample (1.5 mL) for 480 min for full adsorption. The substrates were then removed and air dried (referred to as the immersion-test samples). The air-dried filtration-substrates were cut into Φ13 and were put in the corresponding removable filter. Then the sample (5 mL) was filtered through the substrates and air-dried for testing (referred to as the filter-test sample). The laser power was 100 mW for the L group and 10 mW for the drop-test, the immersion-test and the filter-test sample. Specific test conditions were showed in the ESI.†
:1 and 100 μL of the mixed liquid was added to a clean glass dish (Φ = 10 mm) for testing; this sample is referred to as the L group. The air-dried filtration-substrates were fixed on the glass slide. Then, the sample (100 μL) was dropped on the substrates and air-dried for testing (referred to as the drop-test sample). The air-dried filtration-substrates were immersed in the sample (1.5 mL) for 480 min for full adsorption. The substrates were then removed and air dried (referred to as the immersion-test samples). The air-dried filtration-substrates were cut into Φ13 and were put in the corresponding removable filter. Then the sample (5 mL) was filtered through the substrates and air-dried for testing (referred to as the filter-test sample). The laser power was 100 mW for the L group and 10 mW for the drop-test, the immersion-test and the filter-test sample. Specific test conditions were showed in the ESI.†
Detection of the pesticides
Before analysis, methanol solutions of thiram with concentrations between 10−7 g mL−1 and 10−8 g mL−1 were prepared. The methanol solutions of phorate and benthiocarb with concentrations between 10−5 g mL−1 and 10−6 g mL−1 were prepared as well. The acquisition of SERS spectrum was consistent with the filter-test sample as mentioned above.Data analysis
After baseline correction and smoothing of spectral data by system software (Bruker, SENTERRA II), the calibration curves were generated by monitoring the intensity of the band at 1080 cm−1 (C–S bond) and 1588 cm−1 (C–C bond) as a function of analyte concentration. Each point on the calibration curve represents the average value of Raman measurements with error bars representing the standard deviation. The coefficient of determination (R2) for each calibration curve was calculated using the Excel. The figures were described by Origin 8.Results and discussion
Characterization of the filtration-substrates and the Au NPs
The surface plasmon resonance peak of the Au NPs in the UV-Vis spectrum was at 535.3 nm (Fig. S1†). Considering the study of Haiss et al.,21 it could be calculated that the concentration was ∼0.0593 nM. The ζ-potential values for the Au NPs was affected by the added citrate and determined to be −23.4 ± 4.4 mV, and the surface was negatively charged. This electrostatic phenomenon results in mutual repulsion of the Au NPs in the colloid and enables a stabilized suspension, which extends their preservation time.22 When the analyte was mixed with the Au NPs for testing, the introduction of the analyte would destroy the electrical equilibrium in the solution to a certain extent.23,24 The color of the solution then changed from red to gray as the Au NPs aggregated, resulting in the formation of “hot spots”.25 FDTD simulations can theoretically explain the enhancement of the electric field around the Au NPs.26,27 From the simulation results (Fig. S2 and S3†), it can be seen that a smaller distance between the particles results in a larger electric field enhancement. The Raman scattering signal was positively correlated with the electric field enhancement. Therefore, increased aggregation is conducive to signal enhancement. It is difficult to control the aggregation process of Au NPs. The aggregates undergo Brownian motion28 and are randomly distributed in the mixed solution, which decreases the reproducibility of the test. Finally, this leads to the high RSD value and poor reproducibility, which means that it cannot be used as a reliable quantitative detection method. If measurements are carried out after the mixture is air-dried in the cell culture dish, the “coffee ring” phenomenon occurs,29 which is conducive to reducing the LODs. However, there remains the issue of poor reproducibility and a time-consuming experimental procedure for quantitative analysis (Fig. 1).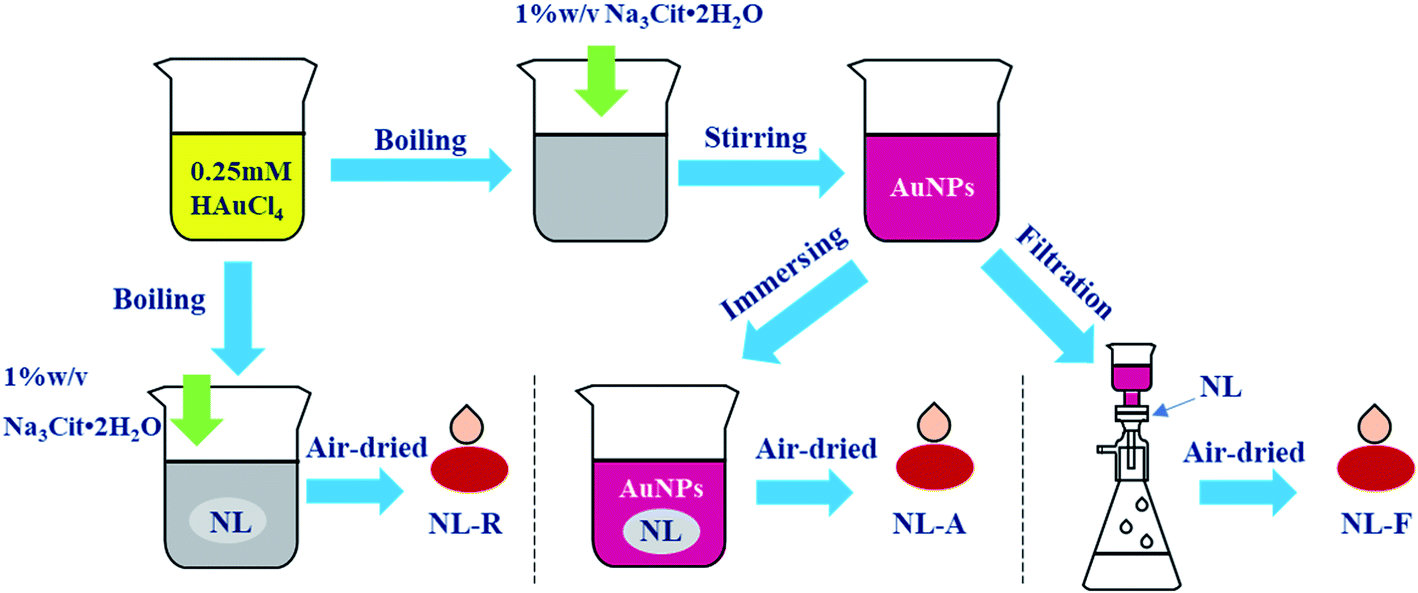 | ||
| Fig. 1 Preparation of several SERS substrates. | ||
The distribution of the Au NPs on the nylon membrane after filtering and air-drying is shown in Fig. 2. The Au NPs are uniformly attached to the surface of the nylon fiber, and there is a certain interval between the particles and the formation of a considerable number of “hot spots”. The main component of nylon membrane is polyamide, which contains carbon chains of different lengths and aromatic rings, and the main functional groups are –(CH2)n– and –NH–CO–. Hydrogen bonds, which are both hydrophilic and hydrophobic, can be easily formed. Because the surface of nylon fiber is positively charged, it can trap the Au NPs via electrostatic adsorption. Compared with the liquid test (L group), the filtration substrates trap the increased “hot spots” on the nylon fiber, reducing randomness in the measurement caused by motion of the “hot spots”. This can decrease the RSD value and enable quantitative analysis.
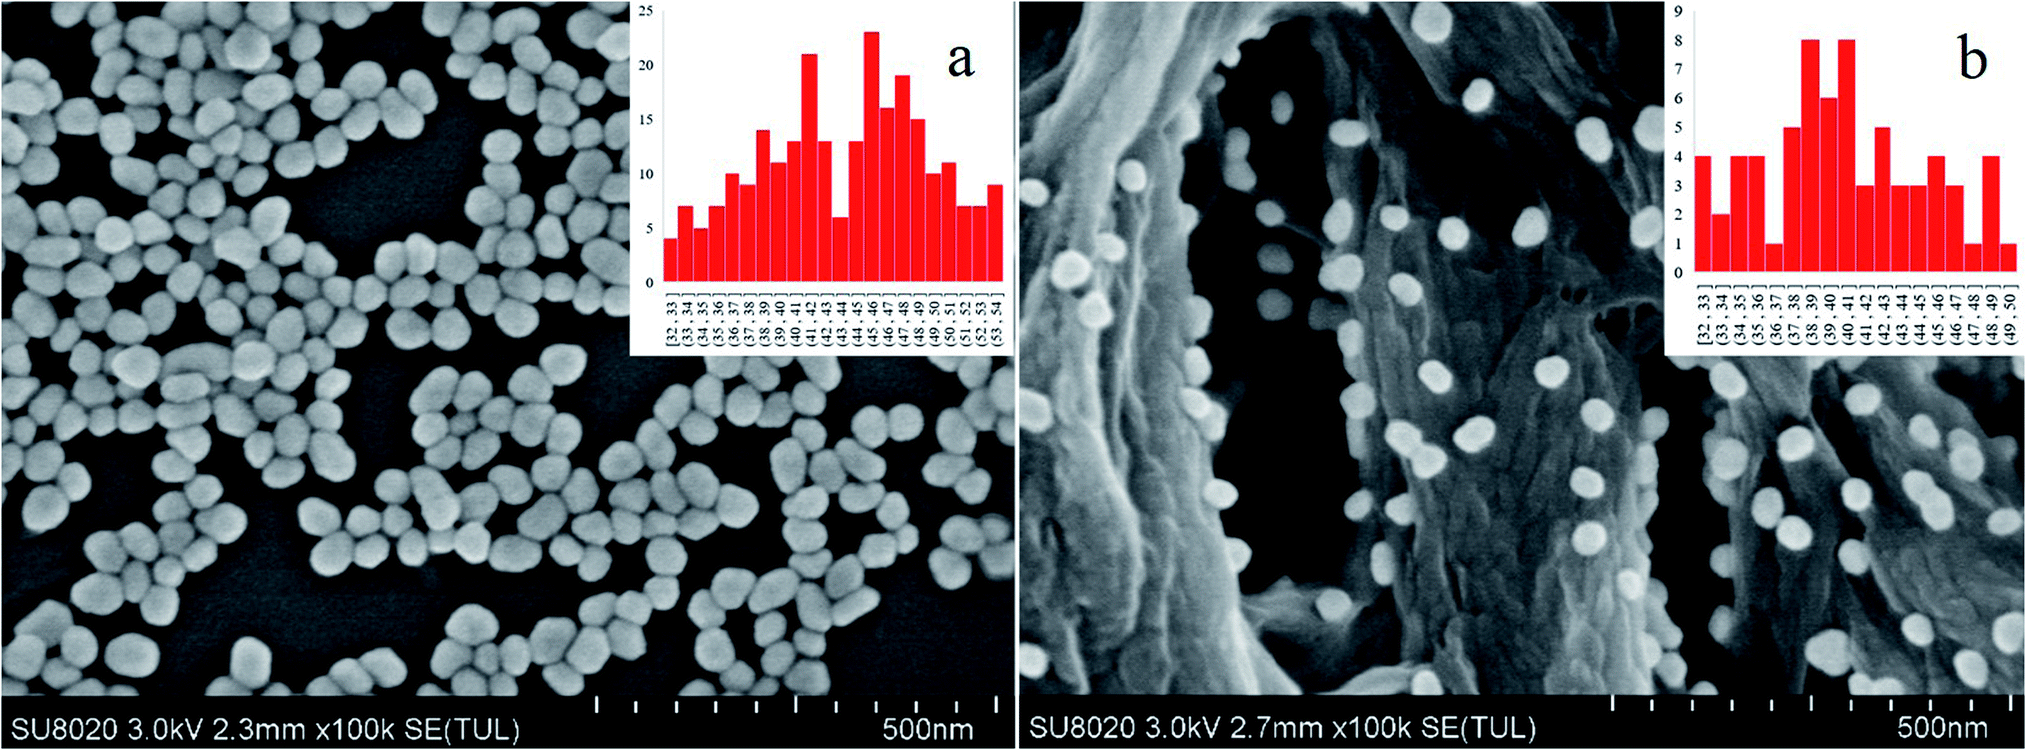 | ||
| Fig. 2 SEM characterization of gold nanoparticles (a) and the filtration substrates (b). | ||
SERS measurement of several nylon membrane composite substrates and Au NPs
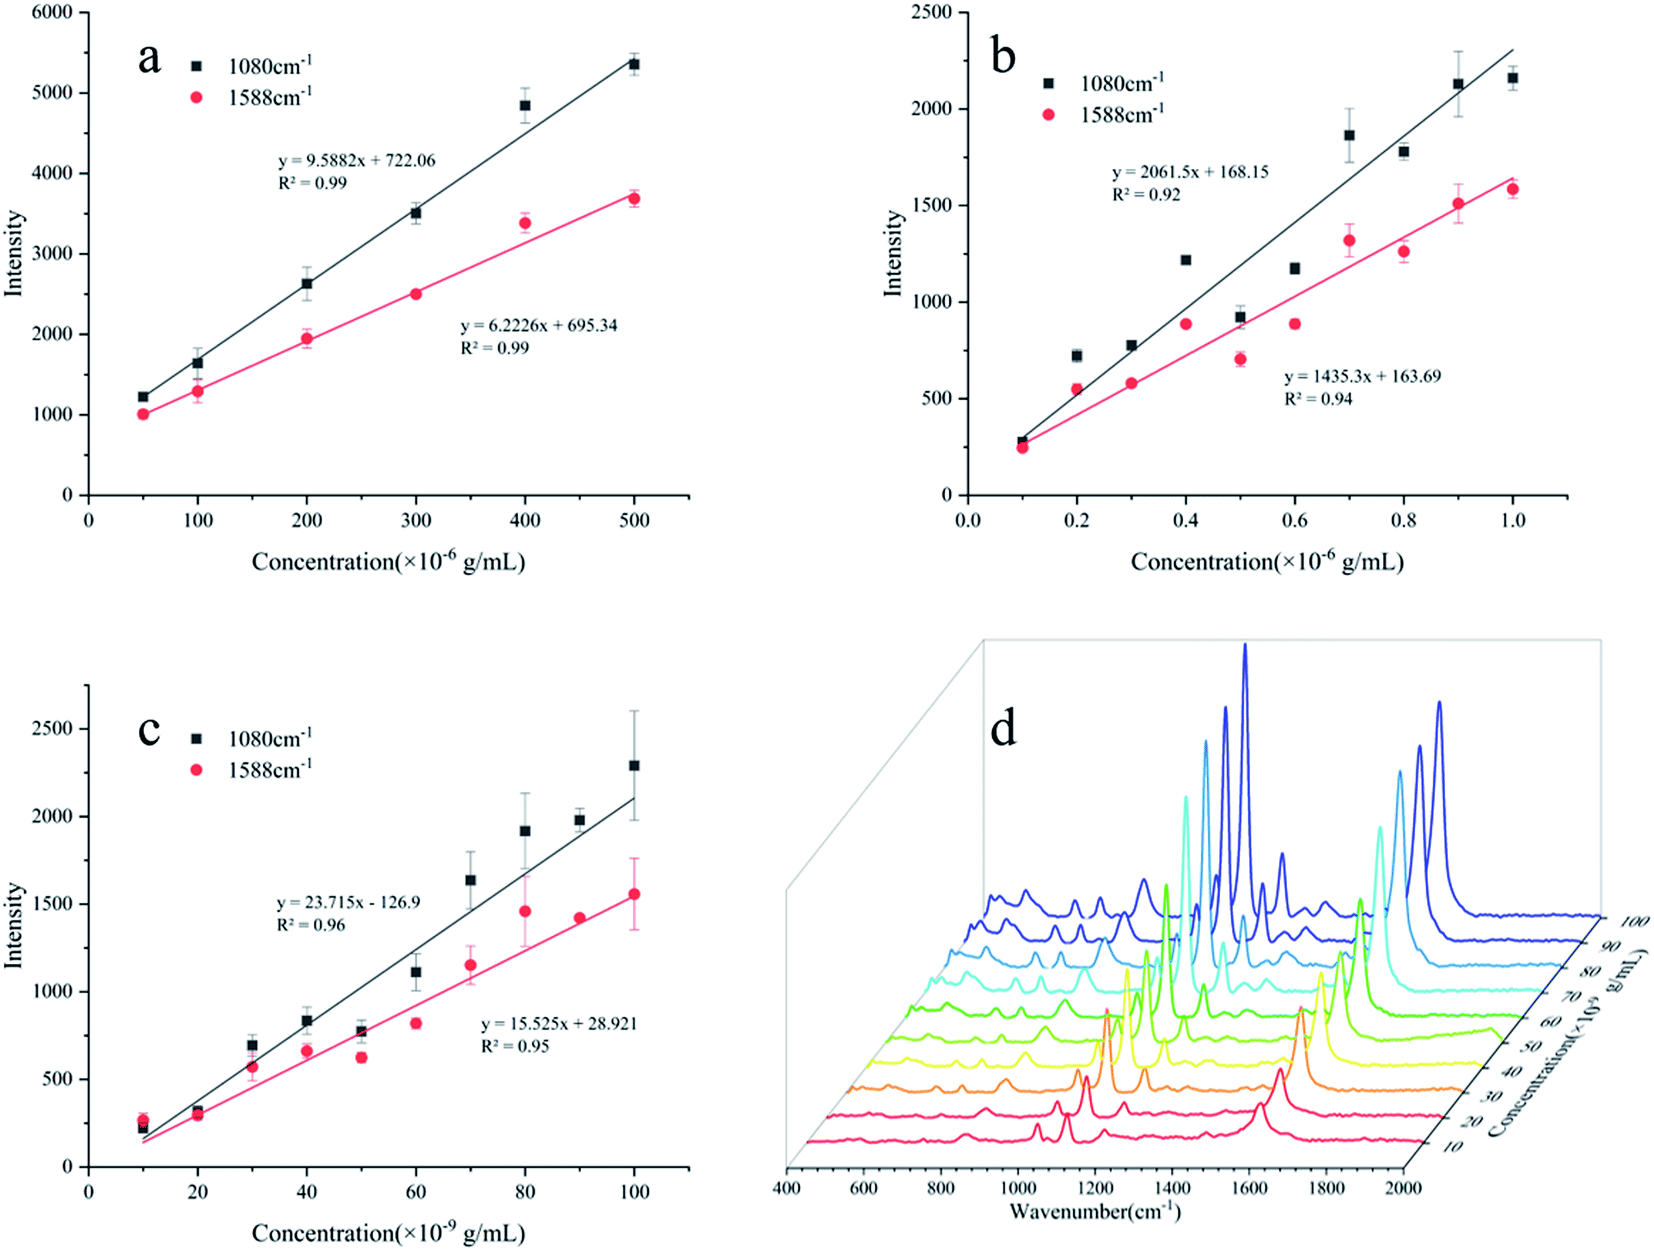
The standard spectra of 4-ATP were investigated using the pressed disc method, and the results are shown in Fig. 3. Characteristic peaks can be observed at 1080 cm−1 (C–S bond) and 1588 cm−1 (C–C bond), which could be observed in the SERS measurements as well. The SERS sensitivity of the Au NPs for detection of 4-ATP can be seen in Fig. S4.† In this experiment, 4-ATP was loaded in the mixture and then analyzed via SERS (785 nm laser). Methanol was used instead of water because 4-ATP is more soluble in methanol.19 Although the methanol has very defined Raman bands (1020 cm−1), the SERS substrates were air dried after being in contact with the 4-ATP methanol solution and no Raman bands could be observed for methanol. Additionally, the Raman signals at the different wavenumbers did not affect each other. The relative standard deviation (RSD) of the characteristic peak was calculated to determine the reproducibility of the method. The RSD values were high for the signals at both 1080 and 1588 cm−1, demonstrating poor reproducibility. Table 1 shows the RSD values of several nylon membrane composite substrates. The filtration-substrates (NL-F group) had the smallest RSD value in the groups (Fig. 4) at 7.85%, and the error between the groups was 1.77%, indicating that the preparation method for this substrate was relatively stable. Therefore, the filtration-substrates have better reproducibility and are more suitable for quantitative analysis than the adsorption substrates (NL-A group) and the in situ reduction substrates (NL-R group). The analytical results in Fig. 5a show that the spectral intensity at both characteristic peaks had a good linear correlation with the solution concentration in the range 10−5 to 5 × 10⁻⁴ g mL−1, suggesting that the established filtration-substrates can be applied for quantitative trace detection of 4-ATP.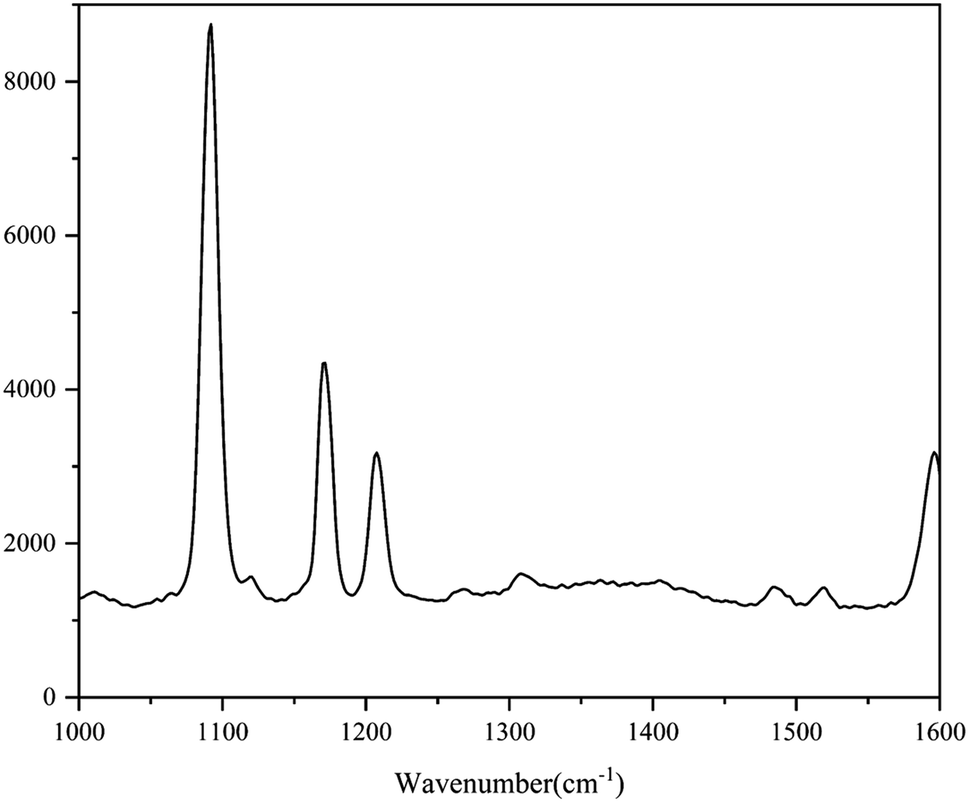 | ||
| Fig. 3 Raman spectra of 4-ATP (excitation wavelength: 785 nm; laser power: 100 mW). | ||
| Characteristic peak (cm−1) | L (%) | NL-R (%) | NL-A (%) | NL-F (%) | NL-F (between group) (%) |
|---|---|---|---|---|---|
| 1080 | 19.66 | 33.35 | 10.49 | 8.03 | 4.46 |
| 1588 | 25.34 | 33.66 | 10.36 | 7.85 | 1.77 |
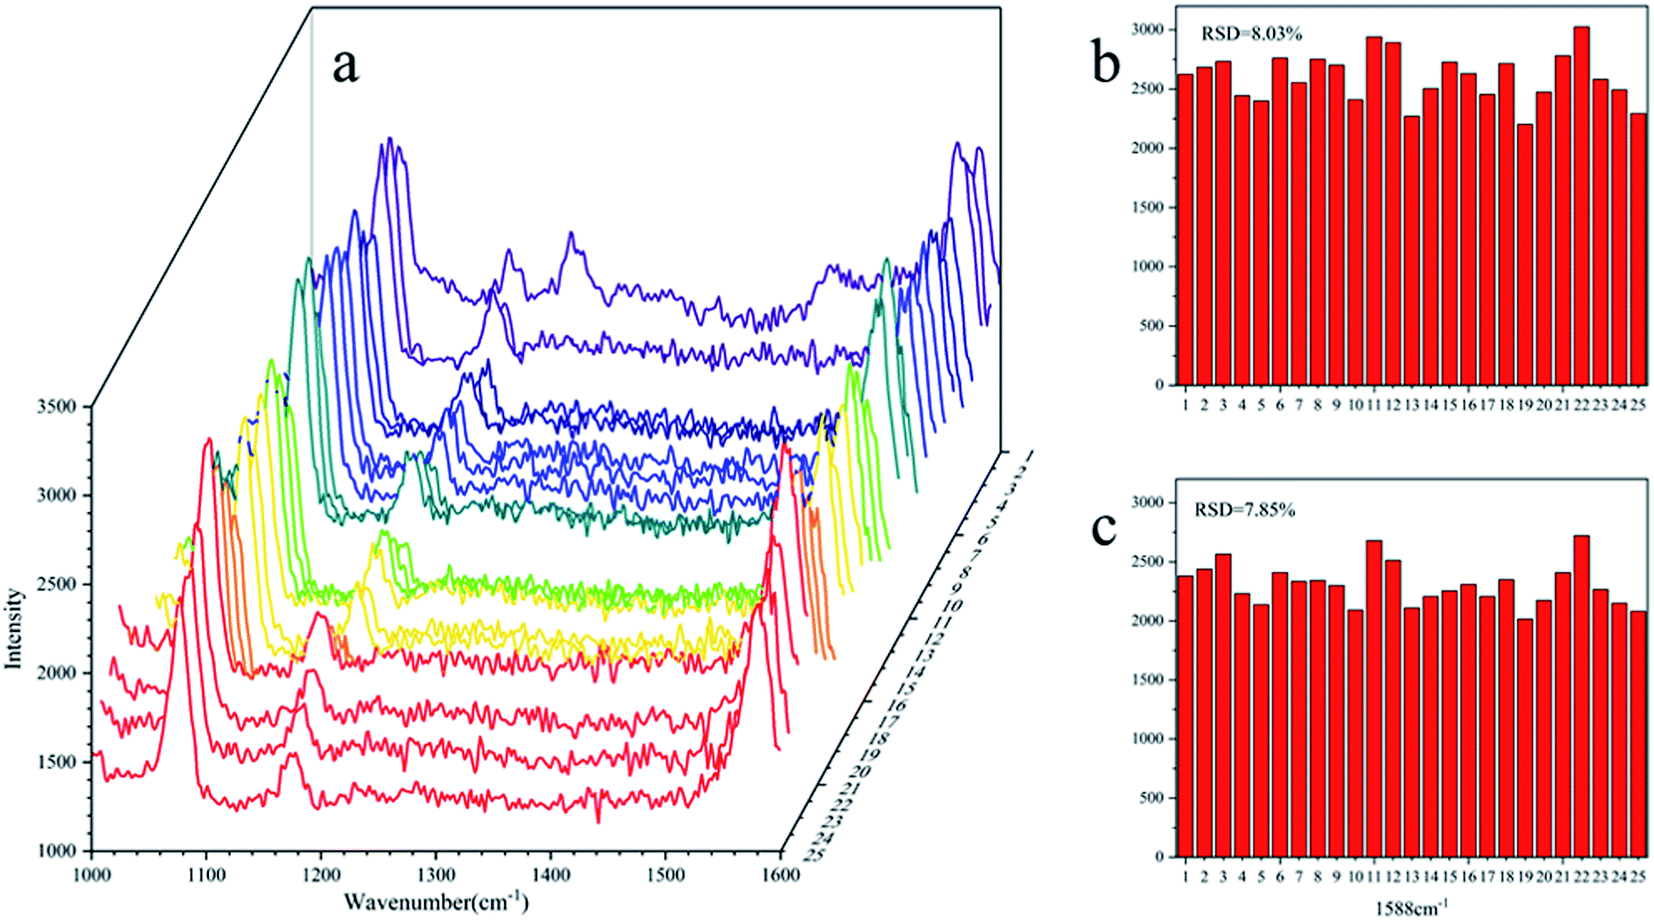 | ||
| Fig. 4 RSD value of the NL-F group with the drop test ((a): SERS spectra of 25 tests; (b): RSD value at 1080 cm−1; (c): RSD value at 1588 cm−1). | ||
 | ||
| Fig. 5 Quantitative analysis of the NL-F group by three different test methods ((a): the drop-test; (b): the immersion-test; (c): the filter-test; (d): SERS of the filter-test between 10−8 to 10−7 g mL−1 4-ATP). | ||
Comparation among three test methods
After the preparation and selection of the substrates, the different test methods were investigated. Compared with the drop test, the immersion test had a larger enhancement of the Raman intensity for the same 4-ATP concentration. The drop-test method has a characteristic peak signal at a concentration of 10−6 g mL−1, while the immersion test had a signal at a concentration of 10−7 g mL−1, which is almost an order of magnitude lower than the drop test. The analytical results of the immersion tests in Fig. 5b show that the spectral intensity at both characteristic peaks had a good linear correlation with the solution concentration in the range of 10−7 to 10−6 g mL−1. The mercapto group of 4-ATP has specific adsorption to the Au NPs.30 In the drop test, the drop volume of the analyte was only 100 μL, and the number of molecules to be measured per unit area was much less than that for the immersion test. Therefore, the immersion-test has a lower LOD.To reduce the test time, we investigated the influence of the immersion time on the SERS intensity of 4-ATP. Fig. S7† shows the intensity of the characteristic peak at different concentrations and for different immersion times. It can be seen that with increasing time, the measured SERS intensity increased and then tended to stabilize. During the immersion process, the 4-ATP molecule adsorbed on the Au NPs trapped on the nylon membrane, and the characteristic peak intensity can represent the number of adsorbed molecules. For adsorption durations >480 min, the SERS intensity remained basically stable and did not increase, which indicated adsorption saturation. The signal was not observable until 30 min after adsorption with 10−7 g mL−1 4-ATP. Therefore, for quantitative analysis, immersion for a sufficient period of time is necessary. The consumption of time makes this test method not fast enough to show the advantage in detection.
The filter tests can reduce the test time through filtration operations, while reducing the detection limit due to forced enrichment. The analytical results of the filter tests in Fig. 5c show that the spectral intensity at both characteristic peaks had a good linear correlation with the solution concentration in the range of 10−8 to 10−7 g mL−1. The LOD was 10−8 g mL−1 (S/N > 3).
Filter tests for different pesticides detection
As a newly developed test method, SERS has been applied in many fields, especially for medical monitoring and environmental pollutant detection. Thiram, phorate and benthiocarb are often used in the cultivation of rice, vegetables and fruits. The residues of these pesticides threaten food safety and cause environmental pollution.31,32 Compared with traditional detection methods such as liquid mass spectrometry (LC-MS) and gas mass spectrometry (GC-MS), the method proposed in this study has advantages of fast, efficient and low cost. Therefore, the detection of the pesticides was evaluated. As shown in Fig. 6a, thiram has a characteristic peak at 1380 cm−1; phorate has a characteristic peak at 630 cm−1 and benthiocarb has a characteristic peak at 1264 cm−1. The intensity of the SERS all had a good linear correlation with the solution concentration which was shown in Fig. 6b–d. According to the criterion of the LOD, the signal can still be detected at the concentration of 10−8 g mL−1 for thiram, while 10−6 g mL−1 for both phorate and benthiocarb (S/N > 3). In the future, expansion of the analyte range and test conditions will need to be supplemented by further research.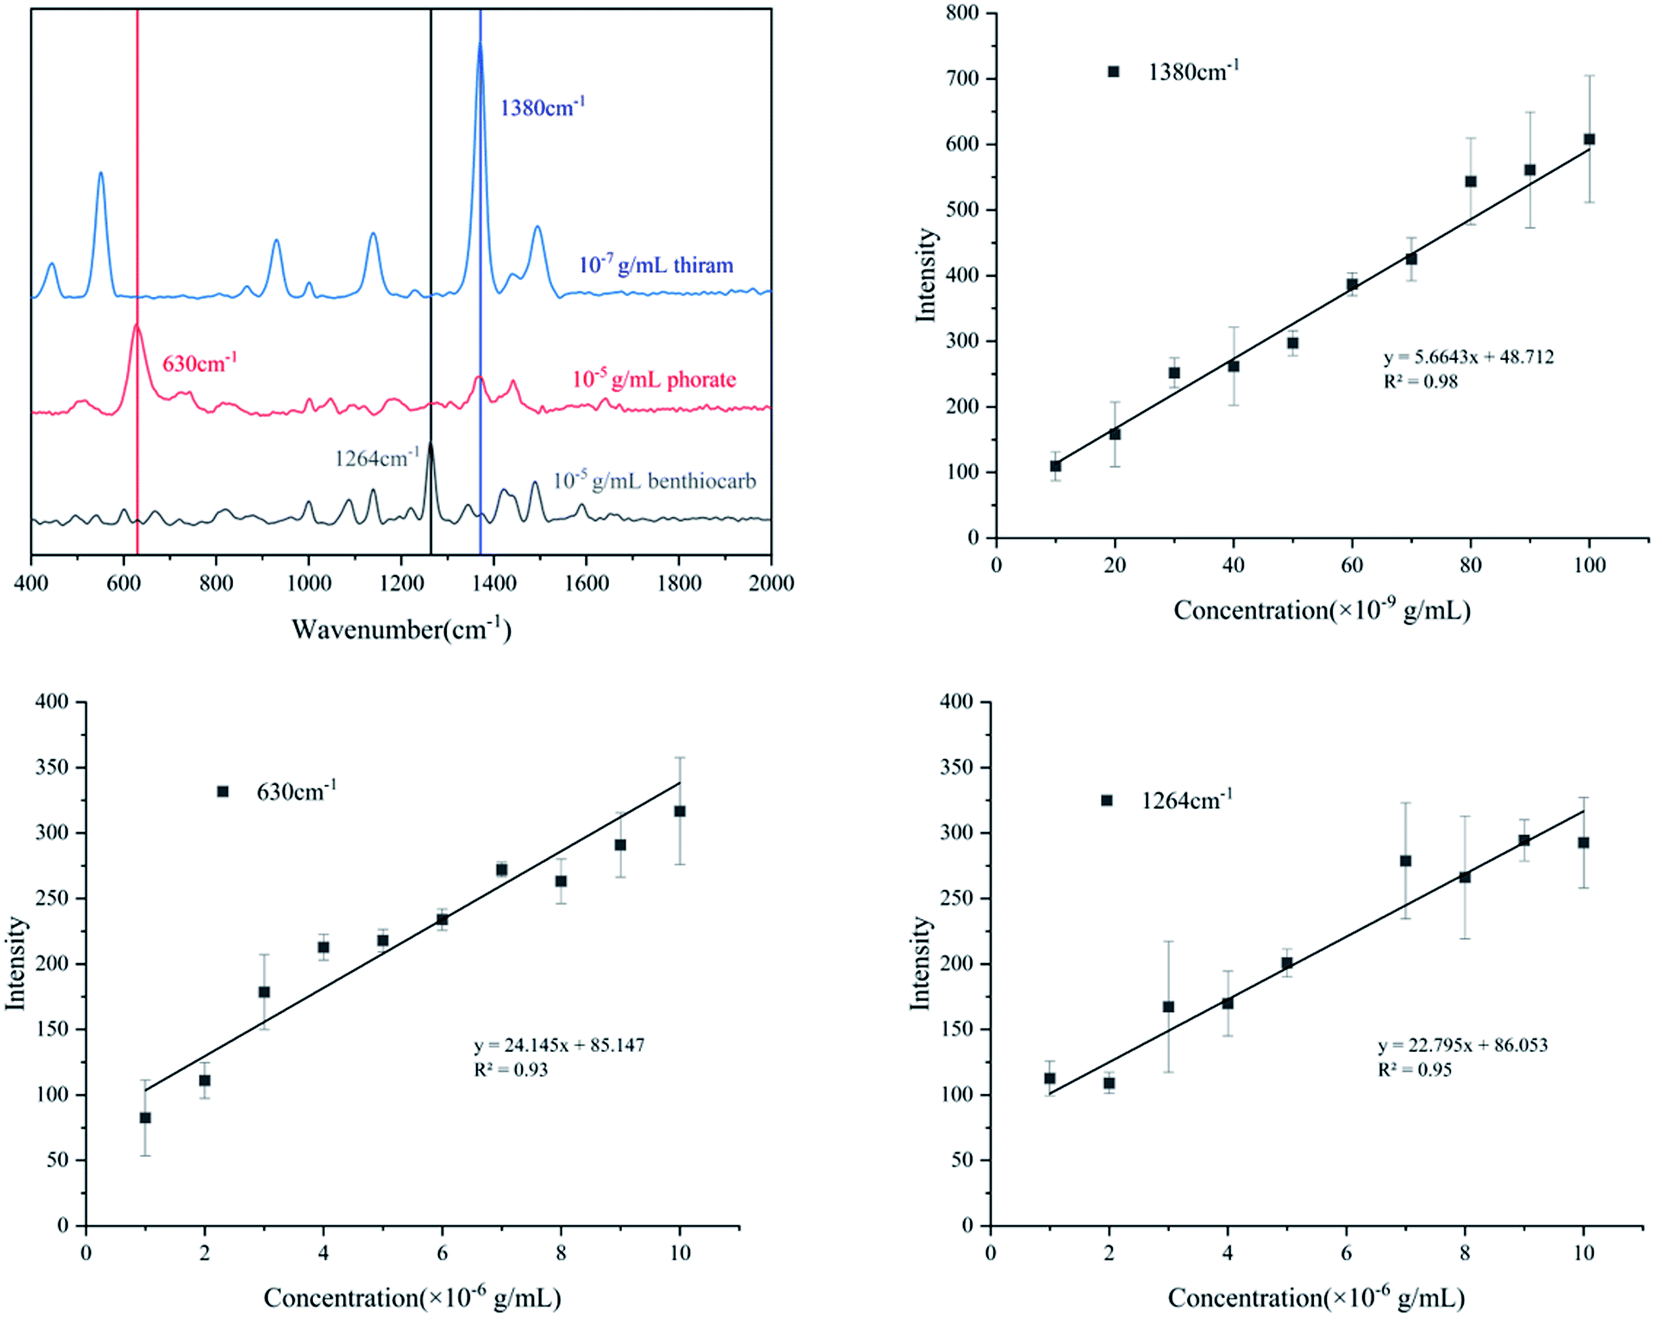 | ||
| Fig. 6 Quantitative analysis of three different pesticides ((a): characteristic peak selection; (b): thiram; (c): phorate; (d): benthiocarb). | ||
Comparison of various test substrates based on SERS
With the continued development of the SERS technique, a variety of advanced substrate materials have been reported in laboratory research. Commonly used AuNPs33 and AgNPs34 are suitable for qualitative analysis, and the heterogeneity of “hot spots” in the solution results in high RSD values. To ensure uniformity of the tests, commercial substrates are prepared via photolithography35 or interfacial deposition.36 The controllability of the metal organic framework37 greatly improves the uniformity of the measurements. The addition of molecularly imprinted polymers38 also allows for specific detection and reduces the LOD. However, the preparation of these substrates is a very complex and expensive process. Applications in biological or screening tests (such as cancer cells or COVID-19) could justify the cost of these substrates, but the cost for applications such as water pollution testing would be unfeasible. Because of the complexity of the variables, most of the methods cannot be used in unstable environments outside the laboratory. This makes it difficult to translate these research methods into practical applications as well.Therefore, low-cost paper-based or membrane-based substrates are one of the avenues for such tests.21,22 In this study, the filtration-substrates were used for SERS measurements. A deviation in the characteristic peak intensity was observed between test batches. The substrates had almost similar LODs as the commercial substrates. The issue with test uniformity was addressed using a very low-cost commercial nylon membrane combined with a simple filtration method, however, this process sacrificed the “hot spots”. This loss was compensated for by using the filter test. The suitable test uniformity and LODs reflect the advantages of the filtration substrates (Table 2).
| Pesticides | Substrates | LODs (g mL−1) | Range of linearity (g mL−1) | Reference |
|---|---|---|---|---|
| Thiram | AuNR@Ag substrate | 2.41 × 10⁻⁸ | — | Pastorello, et al., 2020 (ref. 39) |
| Thiram | PMMA/AgNP/graphene substrate | 2.41 × 10⁻⁷ | — | Sun, et al., 2017 (ref. 40) |
| Phorate | Ag dendrites/aptamer substrate | 1.04 × 10⁻⁸ | 0 to 9.89 × 10⁻⁴ | Pang, et al., 2014 (ref. 41) |
| Chlorpyrifos | AgNPs | 3.51 × 10⁻¹⁰ | 3.51 × 10⁻⁴ to 3.51 × 10⁻¹⁰ | Ma, et al., 2020 (ref. 34) |
| R6G | AuNP substrate with hydrogen peroxide treatment | 2.21 × 10⁻⁹ | — | Gorbachevskii, et al., 2018 (ref. 42) |
| Various opiates median | AuNP substrate | 5 × 10⁻¹¹ | — | Ding, et al., 2020 (ref. 37) |
| Imidacloprid | Paper + 3D silver dendrites + MIP | 2.81 × 10⁻¹¹ | 2 × 10⁻¹⁰ to 8 × 10⁻⁷ | Zhao, et al., 2020 (ref. 38) |
| Thiram | Nylon membrane modified by gold nanoparticles | 10−8 | 10−7 to 10−8 | This work |
| Phorate | 10−6 | 10−5 to 10−6 | ||
| Benthiocarb | 10−6 | 10−5 to 10−6 |
Conclusion
To find a low-cost and reliable SERS testing strategy for qualitative and quantitative analysis of trace compounds, we used a nylon membrane to trap Au NPs via filtration. The reproducibility was considered for several nylon membrane composite substrates. The results showed that the filtration substrates had a lower RSD value, which indicated viability for quantitative analysis. Further investigation showed that the filter test had a better LOD (10−8 g mL−1) and a good linear correlation within the range of 10−7 to 10−8 g mL−1 for 4-ATP. Three pesticides were investigated to explore the applications. The LOD of thiram was 10−8 g mL−1, while both phorate and benthiocarb could reach 10−6 g mL−1. This study demonstrated a facile SERS testing process for trace compounds with good stability and repeatability. In the future, further studies are needed to expand detection to a variety of compounds.Conflicts of interest
There are no conflicts to declare.Acknowledgements
This work was supported by the National Key R&D Program of China (No. 2016YFE0112800) and the Innovation Team Project of the Education Ministry (No. IRT_17R105).References
- B. Sharma, R. R. Frontiera, A. I. Henry, E. Ringe and R. P. Van Duyne, Mater. Today, 2012, 15, 16–25 CrossRef CAS.
- N. G. Bastus, J. Comenge and V. Puntes, Langmuir, 2011, 27, 11098–11105 CrossRef CAS PubMed.
- A. Gole and C. J. Murphy, Chem. Mater., 2004, 16, 3633–3640 CrossRef CAS.
- X. Chen, M. Lin, L. Sun, T. Xu, K. Lai, M. Huang and H. Lin, Food Chem., 2019, 293, 271–277 CrossRef CAS PubMed.
- H. Zhao, D. Huang and S. Zhu, Sensors, 2019, 19, 5354 CrossRef CAS PubMed.
- W. E. Smith, Chem. Soc. Rev., 2008, 37, 955–964 RSC.
- P. A. Mosier-Boss, Nanomaterials, 2017, 7, 142 CrossRef.
- A. Marques, B. Veigas, A. Araújo, B. Pagará, P. V. Baptista, H. Águas, R. Martins and E. Fortunato, Sci. Rep., 2019, 9, 17922 CrossRef.
- F. Fu, B. Yang, X. Hu, H. Tang, Y. Zhang, X. Xu, Y. Zhang, S. S. B. Touhid, X. Liu, Y. Zhu, J. Zhou and J. Yao, Chem. Eng. J., 2020, 392, 123693 CrossRef CAS.
- T. Yaseen, D. W. Sun, H. Pu and T. T. Pan, Food Anal. Methods, 2018, 11, 2518–2527 CrossRef.
- L. B. Zhong, Q. Liu, P. Wu, Q. F. Niu, H. Zhang and Y. M. Zheng, Environ. Sci. Technol., 2018, 52, 5812–5820 CrossRef CAS.
- N. A. A. Hatab, J. M. Oran and M. J. Sepaniak, ACS Nano, 2008, 2, 377–385 CrossRef PubMed.
- J. L. Abell, J. D. Driskell, R. A. Dluhy, R. A. Tripp and Y.-P. Zhao, Biosens. Bioelectron., 2009, 24, 3663–3670 CrossRef CAS PubMed.
- H. Duan, D. Wang, D. G. Kurth and H. Mohwald, Angew. Chem., Int. Ed., 2004, 43, 5639–5642 CrossRef CAS PubMed.
- K. Oh, M. Lee, S. G. Lee, D. H. Jung and H. L. Lee, Cellulose, 2018, 25, 3339–3350 CrossRef CAS.
- W. Wu, L. Liu, Z. Dai, J. Liu, S. Yang, L. Zhou, X. Xiao, C. Jiang and V. A. L. Roy, Sci. Rep., 2015, 5, 10208 CrossRef CAS PubMed.
- S. Pang, T. Yang and L. He, TrAC, Trends Anal. Chem., 2016, 85, 73–82 CrossRef CAS.
- A. Jaworska, S. Fornasaro, V. Sergo and A. Bonifacio, Biosensors, 2016, 647 Search PubMed.
- S. Fateixa, M. Raposo, H. I. S. Nogueira and T. Trindade, Talanta, 2018, 182, 558–566 CrossRef CAS PubMed.
- G. Frens, Nat. Phys. Sci., 1973, 241, 20–22 CrossRef CAS.
- W. Haiss, N. T. K. Thanh, J. Aveyard and D. G. Fernig, Anal. Chem., 2007, 79, 4215–4221 CrossRef CAS.
- N. G. Bastus, J. Comenge and V. Puntes, Langmuir, 2011, 27, 11098–11105 CrossRef CAS.
- L. Xie, J. Lu, T. Liu, G. Chen, G. Liu, B. Ren and Z. Tian, J. Phys. Chem. Lett., 2020, 11, 1022–1029 CrossRef CAS.
- L. A. Wijenayaka, M. R. Ivanov, C. M. Cheatum and A. J. Haes, J. Phys. Chem. C, 2015, 119, 10064–10075 CrossRef CAS.
- S. L. Kleinman, R. R. Frontiera, A. I. Henry, J. A. Dieringer and R. P. Van Duyne, Phys. Chem. Chem. Phys., 2013, 15, 21–36 RSC.
- Z. Yang, Q. H. Li, F. X. Ruan, Z. P. Li, B. Ren, H. X. Xu and Z. Q. Tian, Chin. Sci. Bull., 2010, 55, 2635–2642 CrossRef.
- D. M. Solis, J. M. Taboada, F. Obelleiro, L. M. Liz-Marzán and F. J. G. Abajo, ACS Photonics, 2017, 4, 329–337 CrossRef CAS.
- H. H. Liu, S. Surawanvijit, R. Rallo, G. Orkoulas and Y. Cohen, Environ. Sci. Technol., 2011, 45, 9284–9292 CrossRef CAS PubMed.
- R. Chen, L. Zhang, X. Li, L. Ong, Y. G. Soe, N. Sinsua, S. L. Gras, R. F. Tabor, X. Wang and W. Shen, ACS Sens., 2017, 2, 1060–1067 CrossRef CAS.
- T. Andryszewski, M. Iwan, M. Hołdyński and M. Fiałkowski, Chem. Mater., 2016, 28, 5304–5313 CrossRef CAS.
- M. D. Hernando, M. Mezcua, A. R. Fernandez-Alba and D. Barcelo, Talanta, 2006, 69, 334–342 CrossRef CAS PubMed.
- X. Ye and J. Liu, Environ. Pollut., 2019, 245, 590–599 CrossRef CAS.
- X. Chen, M. Lin, L. Sun, T. Xu, K. Lai, M. Huang and H. Lin, Food Chem., 2019, 293, 271–277 CrossRef CAS.
- P. Ma, L. Wang, L. Xu, J. Li, X. Zhang and H. Chen, Eur. Food Res. Technol., 2020, 246, 239–251 CrossRef CAS.
- L. Ouyang, P. Dai, L. Yao, Q. Zhou, H. Tang and L. Zhu, Analyst, 2019, 144, 5528–5537 RSC.
- H. Dies, A. Bottomley, D. L. Nicholls, K. Stamplecoskie, C. Escobedo and A. Docoslis, Nanomaterials, 2020, 10, 661 CrossRef CAS.
- Q. Ding, J. Wang, X. Chen, H. Liu, Q. Li, Y. Wang and S. Yang, Nano Lett., 2020, 0c02683 Search PubMed.
- P. Zhao, H. Liu, L. Zhang, P. Zhu, S. Ge and J. Yu, ACS Appl. Mater. Interfaces, 2020, 12, 8845–8854 CrossRef CAS PubMed.
- M. Pastorello, F. A. Sigoli, D. P. dos Santos and I. O. Mazali, Spectrochim. Acta, Part A, 2020, 231, 118113 CrossRef CAS PubMed.
- H. Sun, H. Liu and Y. Wu, Appl. Surf. Sci., 2017, 416, 704–709 CrossRef CAS.
- S. Pang, T. P. Labuzab and L. He, Analyst, 2014, 139, 1895 RSC.
- M. V. Gorbachevskii, D. S. Kopitsyn, M. S. Kotelev, E. V. Ivanov, V. A. Vinokurov and A. A. Novikov, RSC Adv., 2018, 8, 19051 RSC.
Footnote |
| † Electronic supplementary information (ESI) available. See DOI: 10.1039/d1ra03490a |
| This journal is © The Royal Society of Chemistry 2021 |