 Open Access Article
Creative Commons Attribution 3.0 Unported Licence
Heat induction in two-dimensional graphene–Fe3O4 nanohybrids for magnetic hyperthermia applications with artificial neural network modeling
M. S. Dar *ab,
Khush Bakhat Akramc,
Ayesha Sohaild,
Fatima Arifd,
Fatemeh Zabihia,
Shengyuan Yang
 a,
Shamsa Munirc,
Meifang Zhu
 *a,
M. Abide and
Muhammad Nauman
 f
f
aState Key Laboratory for Modification of Chemical Fibers and Polymer Materials, International Joint Laboratory for Advanced Fiber and Low-dimension Materials, College of Materials Science and Engineering, Donghua University, Shanghai 201620, P. R. China. E-mail: shamraiz@mail.dhu.edu.cn; zmf@dhu.edu.cn
bCentre for Advanced Electronics and Photovoltaic Engineering (CAEPE), International Islamic University, Islamabad, Pakistan. E-mail: shamraiz@mail.dhu.edu.cn
cSchool of Applied Sciences & Humanities, National University of Technology (NUTECH), Main IJP Road, Sector I-12, Islamabad, Pakistan
dDepartment of Mathematics, COMSATS University Islamabad, Lahore Campus, 54000, Pakistan
eDepartment of Mechanical Engineering, COMSATS University Islamabad (Wah Campus), G.T. Road, Wah Cantt, Pakistan
fThermodynamics of Quantum Materials at the Microscale Laboratory, Institute of Science and Technology (IST), Austria
First published on 18th June 2021
Abstract
We report the synthesis and characterization of graphene functionalized with iron (Fe3+) oxide (G-Fe3O4) nanohybrids for radio-frequency magnetic hyperthermia application. We adopted the wet chemical procedure, using various contents of Fe3O4 (magnetite) from 0–100% for making two-dimensional graphene–Fe3O4 nanohybrids. The homogeneous dispersal of Fe3O4 nanoparticles decorated on the graphene surface combined with their biocompatibility and high thermal conductivity make them an excellent material for magnetic hyperthermia. The morphological and magnetic properties of the nanohybrids were studied using scanning electron microscopy (SEM) and a vibrating sample magnetometer (VSM), respectively. The smart magnetic platforms were exposed to an alternating current (AC) magnetic field of 633 kHz and of strength 9.1 mT for studying their hyperthermic performance. The localized antitumor effects were investigated with artificial neural network modeling. A neural net time-series model was developed for the assessment of the best nanohybrid composition to serve the purpose with an accuracy close to 100%. Six Nonlinear Autoregressive with External Input (NARX) models were obtained, one for each of the components. The assessment of the accuracy of the predicted results has been done on the basis of Mean Squared Error (MSE). The highest Mean Squared Error value was obtained for the nanohybrid containing 45% magnetite and 55% graphene (F45G55) in the training phase i.e., 0.44703, which is where the model achieved optimal results after 71 epochs. The F45G55 nanohybrid was found to be the best for hyperthermia applications in low dosage with the highest specific absorption rate (SAR) and mean squared error values.
1. Introduction
Cancer treatment with high accuracy is a major concern of the medical community. For instance, hyperthermia or heat mediated therapy has today become of great significance utilizing energy absorbing nanoparticles.1,2 Cancer is one of the biggest challenges to humanity. According to the factsheet of February 2018 issued by the world health organization (WHO), cancer is the cause of almost 8.8 million deaths annually.3 It is imperative to develop an effective and accurate treatment method for this malignant disease. The typical therapies in-practice for cancer treatment include radiation therapy, chemotherapy, and surgery. However, apart from being painful, these therapies lead to several side effects such as damage to healthy tissues, fatigue, alopecia and multidrug resistance (MDR). Magnetic hyperthermia (HT) is an alternative and promising non-invasive approach for cancer treatment, where magnetic thermoseeds are injected directly into the tumor area of the patient.4 The cancerous area, containing the implanted thermoseeds, is heated to an elevated temperature through magnetic nanoparticles (MNPs). The heating phenomena is mainly induced in the magnetic nanoparticles under alternating magnetic field due to hysteresis, Néel and Brownian relaxation losses. Brown relaxation losses occurs when the nanoparticle rotate in the fluid and produce heat via a fraction mechanism in the aqueous medium. As there is a reduced blood flow in the tumor area, containing disorganized blood vessels, the heat dissipation to the surrounding area is limited. Therefore, cancerous cells are more susceptible for apoptosis at relatively mild heating up to ∼42 °C as compared to healthy cells. It has been reported that a temperature range of 41.8–44 °C provides the most suitable conditions for entire body hyperthermia.5 This is due to the leaky vasculature of the cancer cells that obstructs dissipation of thermal energy from them, as compared to the well-ordered blood vessels and nerves connected to healthy cells that can stand against heat by a more efficient heat dissipation, and a greater excretion of the heat shock proteins.6,7 The unique feature of nanoparticles to act selectively on the tumor cells sparing the healthy cells makes this therapeutic technique much more accurate as compared to the conventional methods.8,9Ferrites such as Fe3O4 remained a hot contestant in hyperthermia applications due to their biocompatibility, strong intrinsic magnetic properties and their use in bio-medical applications. The use of these materials in magnetic resonance imaging (MRI) contrast enhancement, magnetic hyperthermia cancer therapy, and targeted drug delivery is a manifestation of their biocompatibility.10–15 However, the bare pristine Fe3O4 nanoparticles possess strong anisotropic dipolar interactions and high magnetization that result in agglomeration and precipitation. Due to these factors, their colloidal solubility is lost, and their activity is reduced. Therefore, it is challenging to incorporate Fe3O4 nanoparticles in both in vitro and in vivo experiments. To prevent their agglomeration and precipitation, we have developed a support of reduced graphene oxide sheets, for making Fe3O4 nanoparticles immobilized.
Graphene is a single-atomic-thin planar sheet of sp2 bonded carbon atoms. The introduction of the exfoliation technique in 2006 for producing single-layer graphene,16 has gained tremendous attention from application perspective. Large thermal conductivity (κ ∼ 5.3 × 10³ W m−1),17,18 high flexibility and strength (elastic stiffnesses ∼340 N m−1, Young's modulus ∼ 1.0 TPa, and breaking strength ∼42 N m−1),18–20 and excellent biocompatibility of graphene lead to remarkable properties for the development of prototype devices for biological applications such as miniaturized single fat-cell glucose sensors,21 graphene-based single-bacterium bio-device, label-free DNA sensor, and bacterial DNA/protein.22 Controlled tunability of the fabrication and functionalization of graphene is required, to achieve a remarkable performance from graphene-based devices, making it an important topic of contemporary research.
Thus far different techniques have been developed to produce graphene stacks of varying thicknesses, a post-functionalization to make hybrids of graphene with other materials. Morphologies and properties of free standing nano-islands of graphene in layered hybrid systems have been found to be closely related to their growth strategies.23–25 Among all, Hummer's method is the most famous and reliable for economical large-scale production of graphene. The Graphene Oxide (GO) obtained by Hummer's method is hydrophilic owing to numerous attached functional groups (hydroxyl, carbonyl, epoxide, carboxyl26), making the graphene easy to functionalize with other species. Cong et al. reported the synthesis of hydrazine reduced GO sheets (prepared by modified Hummer's method), that were post decorated with Fe3O4 nanoparticles. These Fe3O4 functionalized graphene sheets could be used as a magnetic resonance contrast. Jing Su et al.27 prepared graphene–Fe3O4 nanohybrids via a hydrothermal approach. These materials exhibit superparamagnetic properties for biocompatible controlled drug delivery.
Although Hummer's method provides an efficient approach for the introduction of new species to a 2D graphene oxide system in the form of hybrids however, reduction of GO is an important stage for a reliable functionalization of defect free graphene. In this work, we adopted thermal reduction method for producing graphene and Fe3O4–graphene nanohybrids. The synthesized nanohybrid materials are applied to investigate magnetic hyperthermia and their functionality is compared with that of pristine Fe3O4 and reduced graphene oxide. Large specific heat capacity of graphene and the charge transfer effect between graphene sheets and immobilized magnetic Fe3O4 nanoparticles enhanced the magnetic hyperthermia effect. The best thermoseed agent was determined by calculating the specific absorption rate (SAR).
Artificial intelligence (AI) has been dominant in health care and medical sciences since the advent of current century. Researchers and futurists have concluded that the collaboration of this technology with the doctors can make wonders and that there is still a long way for scientists to go to unveil the extraordinary potential of AI to transform health care into a much more modern and efficient medical care system. Keeping this in view, we have also utilized AI to produce improved nanoparticles for hyperthermia treatment.
We have used a deep learning algorithm for the time series modeling of hyperthermia data. Deep learning is a subset of machine learning which is a subfield of a bigger domain i.e., AI. Deep learning consists of artificial neural networks (ANN) based algorithms. ANNs have been used by scientists to analyse time series data for prediction and forecasting.28,29
We have developed a system of six artificial neural networks to assess the best nanoparticle. ANNs with exogenous input have this capability to extract information from the past values in the data and process it to learn and then predict step ahead values which gives us an insight of the performance of each particle. However, the algorithm requires as much data as possible for improved predictions.
2. Materials and methods
For synthesis of Fe3O4–graphene nanohybrids, high quality expandable graphite powder of mean size 25 μm was purchased from Aldrich (purity 99.99%), FeCl3·6H2O from Riedel-de Haen (purity 99%), FeCl2·4H2O (purity 99.8%) and HCl from Merck, KMnO4 from BDH (purity 99%), 32% NH3 solution and high grade H2SO4 and H2O2 (30 wt%) were purchased from Panreac. All reactions were carried out using deionized (DI) water.2.1. Synthesis of graphene oxide (GO)
GO was synthesized using graphite powder as a starting material by modified Hummer's method.30 5 g graphite powder was added in 125 mL H2SO4 (99.99% assay) in a flat-bottomed flask at 0 °C followed by vigorous stirring to avoid agglomeration. Once the powder was well dispersed, 15 g KMnO4 was added to the mixture slowly, at a low temperature, below 15 °C. Gradually the mixture was brought to room temperature. After the reaction, mixture became pasty and turned light brown in color. 150 mL of DI water was added slowly to the mixture to dilute it, after which 17 mL H2O2 (30 wt%) was added, that changed the mixture color to yellow. Finally, the mixture was washed with 1![[thin space (1/6-em)]](https://www.rsc.org/images/entities/char_2009.gif) :
:![[thin space (1/6-em)]](https://www.rsc.org/images/entities/char_2009.gif) 10 HCl (1 M) solution to remove residual ions. Grey colored GO powder was obtained after drying the solution in oil bath with continuous stirring (10 rpm) for 8 hours at room temperature (25 °C).
10 HCl (1 M) solution to remove residual ions. Grey colored GO powder was obtained after drying the solution in oil bath with continuous stirring (10 rpm) for 8 hours at room temperature (25 °C).
2.2. Synthesis of magnetite–graphene oxide (Fe3O4–GO) compositions
Magnetite–graphene oxide FxG100–x compositions have been synthesized, where x (= 0, 25, 45, 65, 75, 85, 100) refers to the weight percentage of magnetite in the nanohybrid. Note the composition with x = 0 specifies pure graphene and x = 100 specifies pure magnetite. Specific amounts of FeCl3·6H2O and FeCl2·4H2O and graphene oxide (GO) were weighed for each composition. Stoichiometric quantities of FeCl3·6H2O and FeCl2·4H2O were dissolved in 25 mL de-ionized (DI) water to obtain their 0.04 and 0.02 molar aqueous solutions, respectively. The required amount of GO was dispersed in DI water (250 mL H2O for 0.9 g GO) for each composition. In order to transform the attached carboxylic acid groups to carboxylate anions, the dispersion was sonicated for 1 h. Then, 0.02 mole of FeCl2·4H2O and 0.04 mol of FeCl3·6H2O were dissolved in DI water and added dropwise to the GO solution at room temperature with vigorous stirring. On completion of ion exchange reaction, 32% NH3 solution was added drop by drop until the pH of solution became 10 that is required for the formation of Fe3O4 NPs.31 All the compositions were dried in oil bath with continuous stirring (10 rpm) for 8 hours at room temperature (25 °C).2.3. Thermal reduction
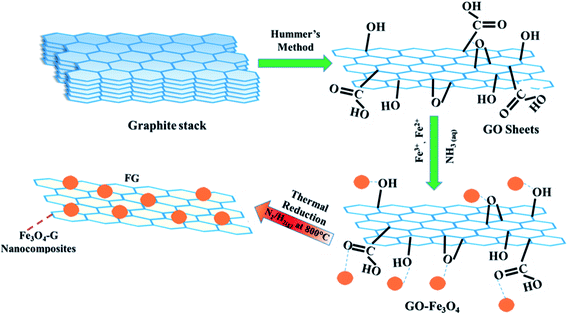
For the fabrication magnetite–graphene (FG) nanohybrids, Fe3O4–GO compositions in dried powder forms were thermally reduced in a quartz tube furnace for 1 h at 800 °C (heating rate 10 °C min−1) at 300 cm3 flow rate of forming gas (N2/H2, 95%/5%). The samples were named according to the weight % ratio in the compositional formula FxG100–x (x = 0, 25, 45, 65, 75, 85, 100) as G, F25G75, F45G55, F65G35, F75G25, F85G15 and F, respectively. For example, F45G55 refers to the nanohybrid containing 45 wt% magnetite and 55 wt% graphene. Schematic diagram for synthesis of FG nanohybrids is shown in Fig. 1.2.4. Synthesis of magnetite (Fe3O4) nanoparticles
Magnetite nanoparticles were prepared by co-precipitation31 method. Fe3O4 NPs were obtained on reacting iron-II (Fe2+) and iron-III (Fe3+) ions in an ammonia solution (pH 10) in the molar ratio 1![[thin space (1/6-em)]](https://www.rsc.org/images/entities/char_2009.gif) :
:![[thin space (1/6-em)]](https://www.rsc.org/images/entities/char_2009.gif) 2 respectively, at room temperature by stirring the solution for 30 min at 4000 rpm, following the reaction in eqn (1)
2 respectively, at room temperature by stirring the solution for 30 min at 4000 rpm, following the reaction in eqn (1)| 2FeCl3 + FeCl2 + 8NH3 + 4H2O → Fe3O4 + 8NH4Cl | (1) |
The solution was washed several times at room temperature by stirring the dispersion for 30 min at 3000 rpm, to remove the unwanted ions and until it attained a pH of 7. Magnetite nanoparticles were centrifuged from the solution and dried at room temperature.
3. Artificial neural network (ANN) modeling
Machine learning is a complementary tool for analyzing an extract hidden trends in time series. Due to non-linear behavior of our time series, Artificial neural network for mathematical modeling has been chosen as they possess the ability to carry out non-linear mappings. This technique has been of considerable usability in the field of time series forecasting.15,32,33 Furthermore, several models based on nonlinear autoregressive structure have been proposed.34–36 We have developed a neural net time-series model using Neural Net Time Series app on MATLAB R2018b. It takes one or more time series for prediction; however, our time-series difficulty is to make a prediction by utilizing the l past values of a time series which is being predicted (y(t)), and another time-series (x(t)), in our case the 100% magnetite particle. In this basis, we have used Nonlinear Autoregressive with External Input (NARX) neural network. NARX is a recurrent network capable to model dynamic systems,2 it is not only able to predict output value which is regressed on the previous values but is also used for nonlinear filtering (eqn (2)):| y(t) = g(x(t − 1), …, x(t − l), y(t − 1), …, y(t − l)) | (2) |
Data is fed into the three layered (namely input, hidden and output layers) network consisting of 10 hidden neurons and two-time delays (Fig. 2). Size of the hidden layer was chosen carefully after experimenting with other combinations and the time delays were added to incorporate the dynamic of the input dataset. The division of target time steps has been done as: 70% for training, 15% for validation and 15% for testing. Furthermore, Bayesian Regularization (BR) back propagation algorithm is used to train the network. Regularization is required to solve the overfitting problem. To confront the performance decline, generalization errors regularization has been used skilfully. A number of techniques are available to serve the purpose.37 However, our choice of Bayesian regularization is influenced by the involvement of Bayesian theorem which incorporates prior data along with maximum likelihood function to give posterior distribution.38
BR happens to be a better choice for quantitative researches, due to its potential to unveil complex data patterns and interrelations.39 Adopting a probabilistic approach towards machine learning is the most reliable strategy to solve a problem like future prediction which is based on uncertainty.40 It may take a little longer but yields finer results and has emerged to be the most robust and vigorous one in comparison to the standard back propagation NNs. Regularization itself is meant to overcome the overfitting issue, hence the models trained using BR are difficult to overtrain and overfit.41 It utilizes posterior probability which involves utilization of Bayesian theorem for parametric optimization and updating the knowledge from prior to posterior.42 Bayesian inference is a highly commendable approach for statistical analysis of stochastic processes.43
The training process continues till the optimal result is achieved and is terminated as the generalization stops improving, the model can be trained for the maximum number of 1000 epochs.
After training, the assessment of the accuracy of the predicted results is carried out on the basis of Mean Squared Error (MSE) eqn (3), which is the average of squared difference of output and target values:
 | (3) |
4. Results and discussion
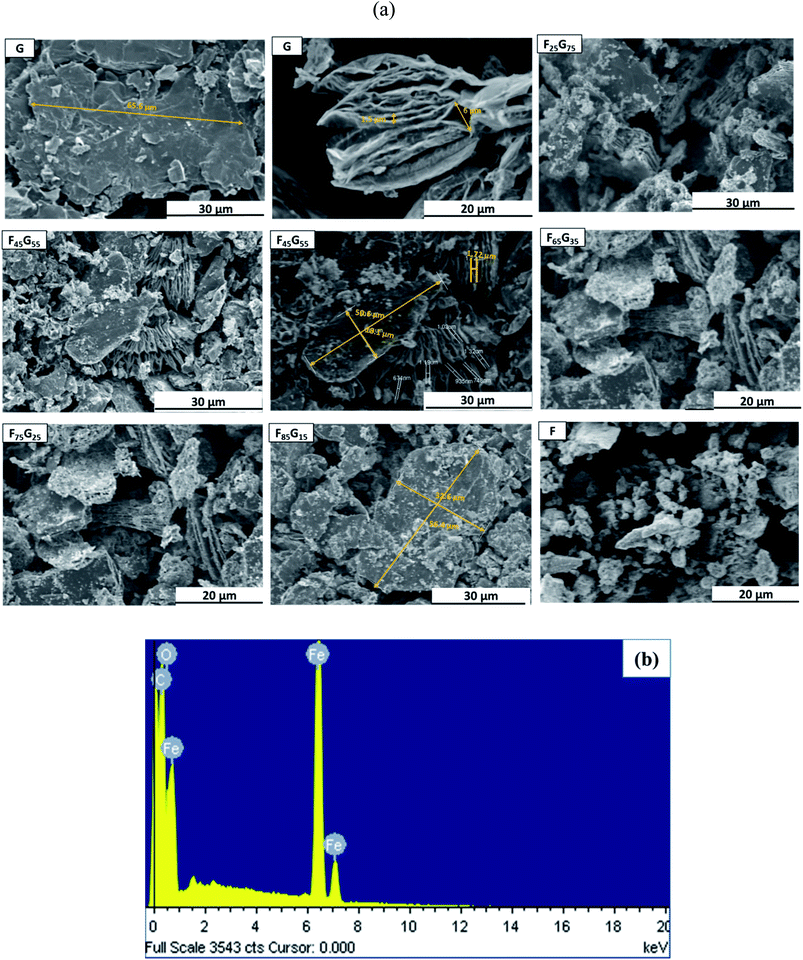
JEOL (Japan) JSM-6400F field emission scanning electron microscopy (FE-SEM) equipped with electron diffraction microscopy (EDX) was used for morphological and elemental analysis of Functionalized Graphene (FG) nanohybrids as presented in Fig. 3(a) and (b) respectively. The first two images on the top left side of Fig. 3(a) labelled as G show multilayer graphene flakes with a micron scale length i.e., 65.6 μm for sample G. It is evidenced that for low Fe3O4 samples (up to 45%), Fe3O4 nanoparticles are evenly distributed within the graphene matrix with a very little degree of agglomeration. However, with increasing the content of Fe3O4, further agglomeration is observed. It can be concluded that, the average size of Fe3O4 nanoparticles significantly varies with the content of Fe3O4 with nano scale length. The image in Fig. 3(a) labeled as F, (for pure magnetite) shows agglomerated Fe3O4 nanoparticles with non-uniform size distribution due to magnetic anisotropic interactions.To confirm the presence of the Fe3O4 on the graphene surface sample F75G25 was randomly selected for energy dispersive X-ray spectroscopy (EDX) as shown in Fig. 3(b). From EDX results the presence of Fe, O and C, confirms that the Fe3O4 nanoparticles are distributed between the layers of the graphene sheets, which lead to the formation of Fe3O4–graphene nanohybrids.
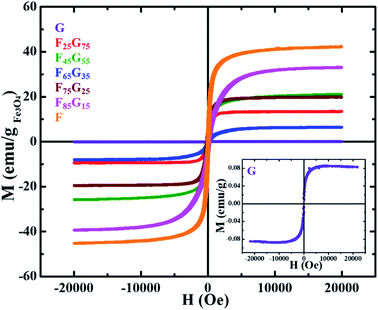
Pristine graphene, Fe3O4 and FG samples were exposed to DC magnetic field, up to 20 kOe, in Lake Shore 7404 (US) vibrating sample magnetometer (VSM), at room temperature. The field dependent M(H) curves of all the samples (Fig. 4) were normalized by the mass of the sample and mass of the magnetic component (Fe3O4) for a comparative study of their magnetic properties. The inset shows the M(H) loop of pure graphene. Remanence (Mr) and coercivity (Hc) values for all samples are shown in Table 1 below.
| Compositions | Mr (±0.010) (emu g−1) | Hc (±0.01) (kOe) |
|---|---|---|
| G | 0.019 | 70.641 |
| F25G75 | 1.933 | 82.334 |
| F45G55 | 5.916 | 52.140 |
| F65G35 | 1.175 | 120.491 |
| F75G25 | 6.215 | 125.919 |
| F85G15 | 4.752 | 138.383 |
| F | 12.630 | 140.276 |
All the samples demonstrated ferromagnetic behavior. Table 1 shows that magnetic remanence (Mr) and coercivity (Hc) values of samples are not increasing monotonically with the Fe3O4 content. As seen in SEM images Fig. 3(a) with the increase in Fe3O4 content, further agglomeration is observed. It can be seen from combined analysis of SEM and VSM results that Hc and Mr values are mainly dependent on degree of agglomeration of Fe3O4 rather than its concentration. Moreover, the magnetic behavior of a magnetic component dispersed in a nonmagnetic reduced graphene oxide matrix depends not only on the quantity of the magnetic component but also on how it is dispersed within the matrix.44 The weak magnetization of graphene is due to the presence of local defect states and non-magnetic nature.45 Sample G attains a maximum saturation magnetization of 0.08 emu g−1. The measured saturation magnetization (MS) of pure Fe3O4 (sample-F) ∼42 emu g−1 is much lower than the value reported for bulk counterpart (85–95 emu g−1). This is due to the well-understood size dependence of magnetization in nanoparticles in which surface spin disorder can lead to a magnetically dead surface layer.46 In case of FG samples, the magnetic behavior (Mr, Ms and Hc) is not depending upon the magnetic component. For example, remanence and saturation magnetization of the F45G55 sample is comparable to that of F75G25 i.e., ∼6 emu g−1 and 20 emu g−1 respectively. This can be due to the intercalation-dependent magnetic interactions. As shown in the SEM images (Fig. 3), there is still a slight degree of agglomeration with the lower contents of magnetic element. Therefore, increasing content will lead to increasing intercalation and exfoliation that results in the frustration of magnetic moments and enhanced dipolar interactions. These all could lead to a decrease in magnetization, associated with an increase of magnetic content over 45%.
Hyperthermia response of pure samples and FG nanohybrid (F25G75, F45G55, F65G35, F75G25, F85G15) was measured using NAN201003 MagneTherm (UK) induction heating unit for 25 mg of each sample powder exposed to a 633 kHz alternating magnetic field of strength 9.1 mT. A significant heating upshot was observed in all the synthesized nanohybrids (Fig. 5). There is a negligible heating in the pure graphene (sample-G) due to its weak magnetization. A considerable heating effect was detected, for all the FG nanohybrid, as well as the pure Fe3O4 samples. This trend can be assigned to Néel and hysteresis losses in single and multidomain particles respectively.47,48
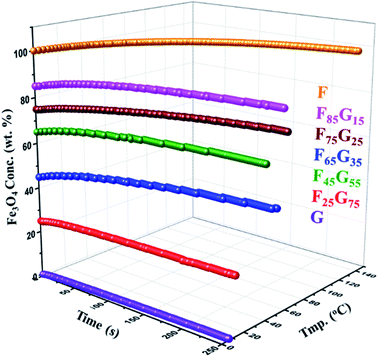 | ||
| Fig. 5 Hyperthermia measurements of FG nanohybrids (25 mg each) at 633 kHz alternating magnetic field of strength 9.1 mT. | ||
Specific absorption rate (SAR) is the rate at which MNPs convert magnetic energy into heat. SAR is considered as a figure of merit in hyperthermia measurements. The specific absorption rate (SAR) of the samples have been calculated from the heating curves, using the following eqn (4).
 | (4) |
 is the initial heating rate, C is the heat capacity of nanohybrid sample and mmagn. is the mass of magnetic component in the sample. The value of specific heat capacity (C) of each nanohybrid sample was determined by weight % contribution of Fe3O4 and graphene in the given composition. Specific heat capacity of Fe3O4 was taken as 0.937 J g−1 K−1 (ref. 49) and that of graphene was taken as 1.958 J g−1 K−1.17 Table 2 shows specific heat capacities and SAR values of pure and nanohybrid samples.
| Compositions | C (±0.010) (J g−1 K−1) | SAR (±0.01) (W g−1) |
|---|---|---|
| G | 1.958 | 0.00 |
| F25G75 | 1.705 | 4.24 |
| F45G55 | 1.501 | 6.45 |
| F65G35 | 1.297 | 3.61 |
| F75G25 | 1.195 | 1.78 |
| F85G15 | 1.093 | 2.66 |
| F | 0.937 | 4.32 |
Fig. 6 depicts the trend of the SAR values vs. magnetite content w.r.t wt% ratio in different FG nanohybrids. SAR value obtained for pure magnetite sample (F) is smaller than that reported by P. Burnham et al. i.e.∼5.813 W g−1 for dry magnetite.50 This difference is possibly due to the magnetic field strength (200 Oe), alternating frequency (282 kHz) and particle size (particle size = 15.3 nm) difference. Interestingly, the SAR value of F45G55 sample is ∼1.5 times larger and appx. same for F25G75 samples, as compared to that of the pure magnetite (F). Such an intriguing feature must be due to the large area matrix provided by the reduced graphene oxide sheets, and its heat capacity which is higher than that of pure magnetite. In details, the heat capacity of graphene is about twice that of magnetite, leading to higher SAR for lower content of Fe3O4. Additionally, the highest SAR obtained for sample F45G55 i.e., 6.45 W g−1, is due to an excellent exfoliation of graphene and most uniform intercalation of magnetite nanoparticles, as has been observed in SEM images. These behaviors also led to reduced frustration of moments for highest saturation magnetization (Fig. 4). Therefore, F45G55 sample can be considered as best candidate among all other nanohybrid compositions with highest SAR for hyperthermia applications in low dosage. Inductive heating property of graphene oxide–Fe3O4 nanoparticles hybrid in an AC magnetic field has been studied by Li-Zhong Bai et al. for localized hyperthermia applications22 however they have not calculated SAR values for analyzing the hyperthermia efficacy for their samples. Table 3 shows a comparison of the SAR values obtained for our best hybrid composition F45G55 and other most commonly reported agents for magnetic hyperthermia. The first row represents our hybrid composition with highest SAR among our composition and that of the other reported materials. This is an important result for hyperthermia applications of graphene based nanohybrids in low dosage.
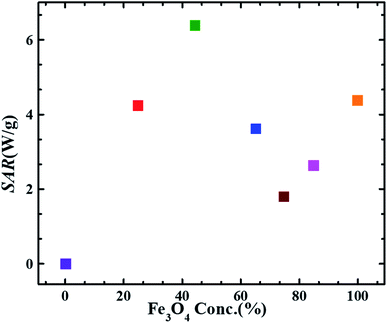 | ||
| Fig. 6 SAR values obtained at 633 kHz alternating magnetic field of strength 9.1 mT as a function of magnetite content in FG nanohybrid samples. (Error bars are within the symbol size). | ||
5. Modeling
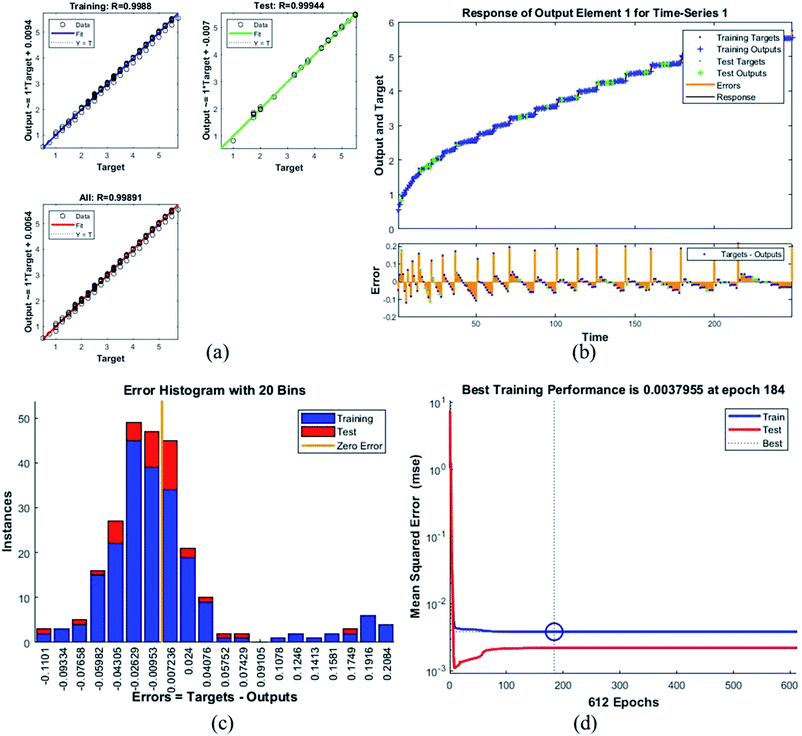
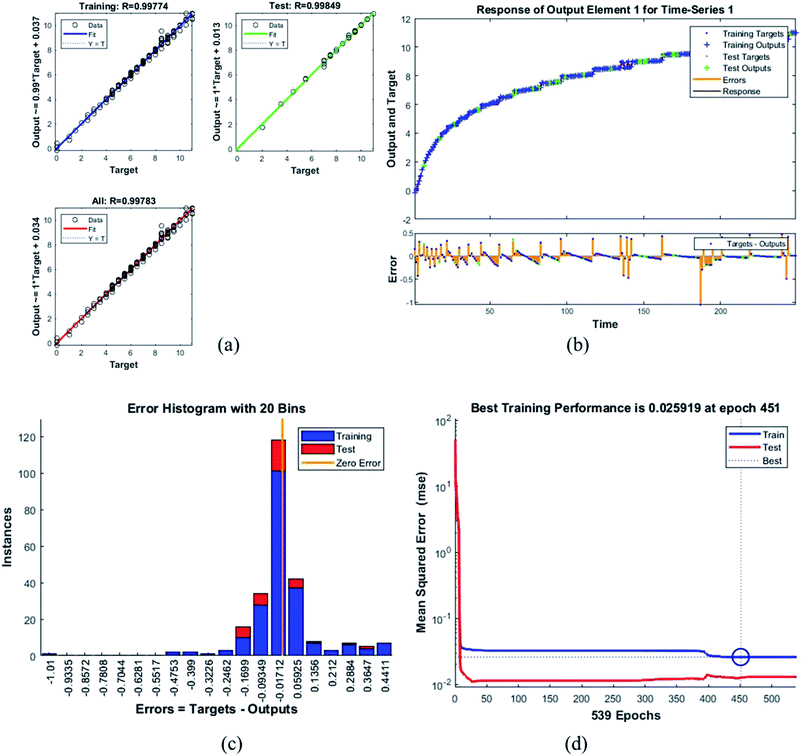
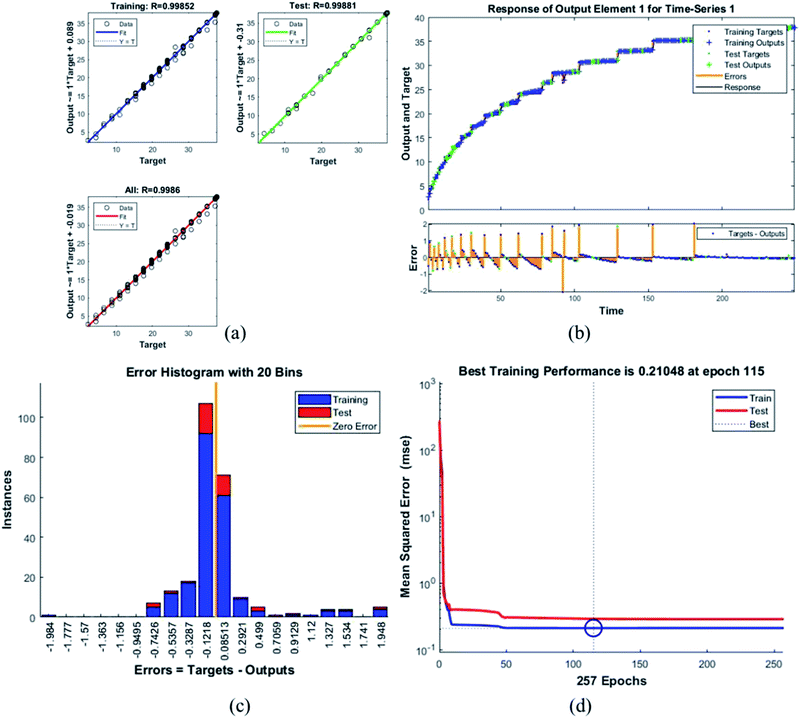
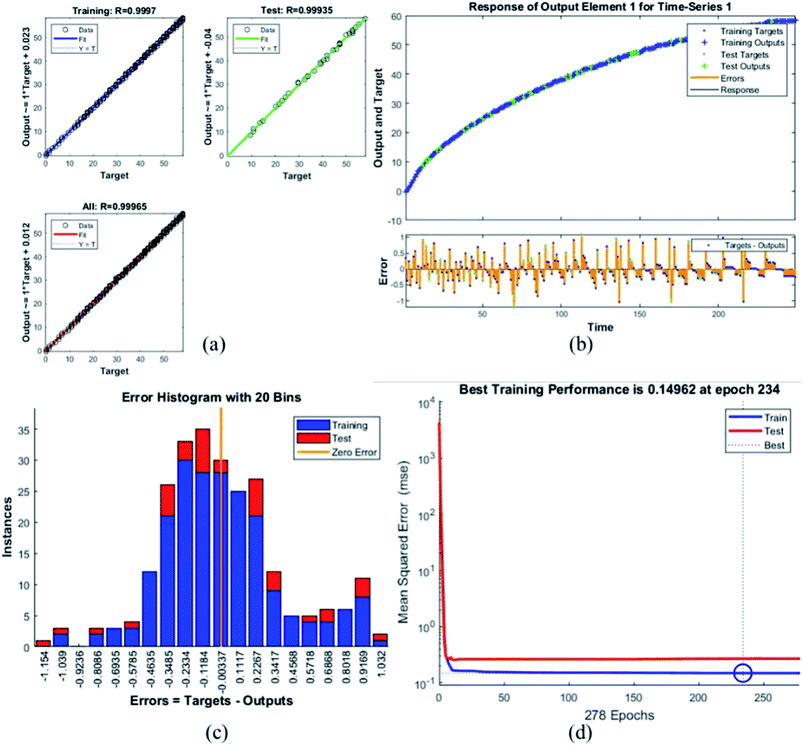
Six NARX models are obtained, one for each of the components in Table 2. NARX is a nonlinear regression which uses both endogenous and exogenous inputs. The assessment of the accuracy of the predicted results has been done on the basis of Mean Squared Error (MSE) described in eqn (3). Moreover, regression (R) values have been calculated to see the correlation between output and target. Calculated values for all the compounds are given in the following Table 4:| Composition | MSE | R |
|---|---|---|
| G | 0.00380 | 0.99880 |
| F25G75 | 0.02592 | 0.99774 |
| F45G55 | 0.44703 | 0.99836 |
| F65G35 | 0.21048 | 0.99852 |
| F75G25 | 0.14962 | 0.99970 |
| F85G15 | 0.23729 | 0.99924 |
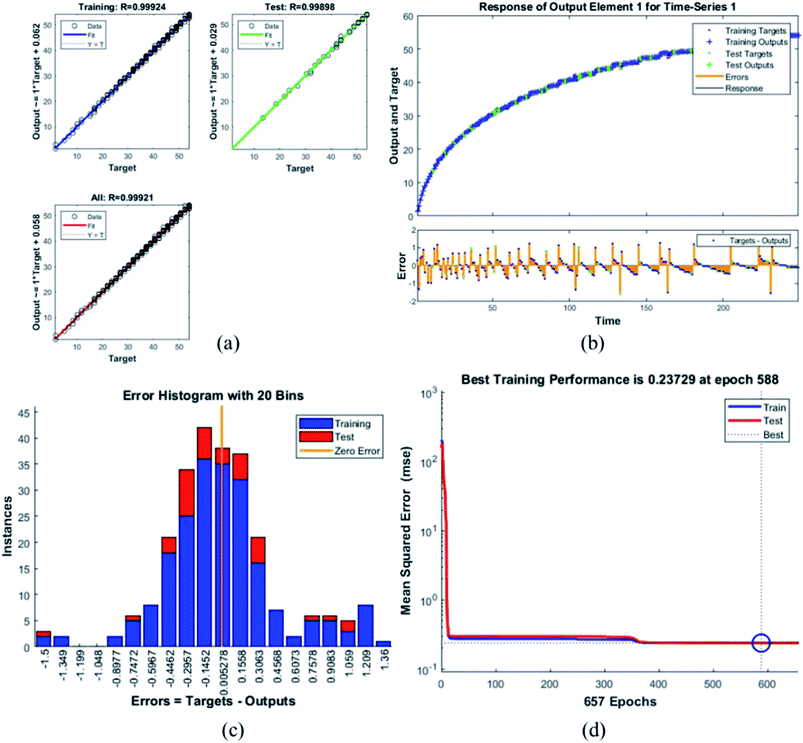
Table 4 presents the MSE and R values for the six composites. These values were obtained after completing the testing phase of the model. The model trained for the assessment of F45G55 performance in comparison to pure magnetite yielded highest MSE value. It turns out to be the most different one. Moreover, the R values depict the accuracy of the results obtained from the model which is also high for this composition. The plots obtained from the trained network for F45G55 are as following:
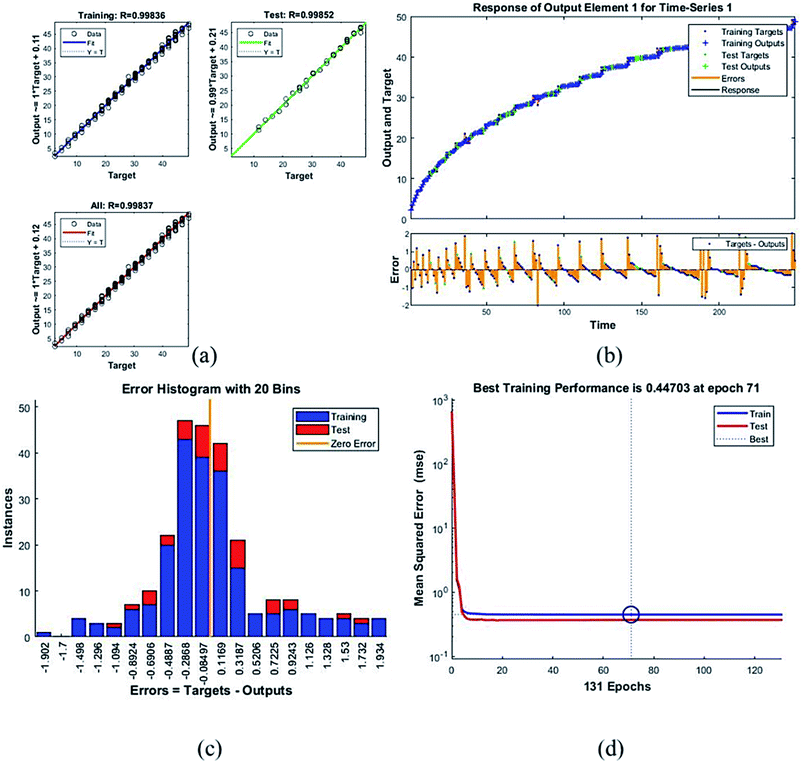
The regression/scatter plots on Fig. 7(a) depict the correlation between the output and the targets. Generally: output = i × target + j; where i is slope and j is the y-intercept. Here, we have three plots for different values of j. Each of them shows a meaningful correlation between target and output since the value of R is very close to 1, which is the ideal case. We have achieved maximum regression values for all the particles. Fig. 7(b) represents a time series response curve with time instances on the x-axis and the predicted versus observed values on the y-axis. The other smaller graph in Fig. 7(b) is the magnified image of errors that were obtained in the time series response plot. The targets are the correct data (that we gave in as input) whereas the outputs are the results obtained from the trained model i.e., the predicted results. Our training and test outputs lie on the response line. Hence, the error is obtained by comparing the values from the response line to the ones that lie above or below the line. So, if the target value lies above the line, we obtain a positive error and, negative otherwise.
Error histogram with 20 bins (Fig. 7(c)) has number of instances on y-axis and errors on the x-axis. The maximum number of instances do not have zero error. This shows the predicted results are not very close to the target values, time series and performance plots further validate this interpretation. Fig. 7(d) is a performance plot MSE versus epoch count. As stated earlier, MSE is the difference between the observed and the simulated, therefore it should be lower. According to our motivation, the particle that obtained the highest error is the most favorite one, and for F45G55, MSE obtained in the training phase is 0.44703, where the model achieved optimal results after 71 epochs. However, it is seen that Bayesian regularization does not require validation, this is due to this fact that the sole purpose to perform validation check is to make sure either error increases or decreases while training and avoid overfitting in the testing phase, making Bayesian method encounters successfully while training the model. Most importantly, our experimental results also have shown that highest SAR value is obtained for sample F45G55 (Fig. 6). It means that, F45G55 composition can be an excellent candidate for cancer treatment via magnetic hyperthermia approach. The plots obtained from the trained network for other samples are shown in Fig. 8–12.
6. Conclusion
The goal of this work was to develop biocompatible two dimensional (2D) magnetic system of high thermal conductivity for the treatment of malignant tumors via the magnetic hyperthermia approach. 2D system of thermally reduced graphene functionalized with magnetite nanoparticles in different weight ratios (0–100%) were fabricated. All the compositions were characterized and analyzed morphologically and magnetically at microscopic level. Hyperthermia measurements showed a high specific absorption rate (SAR). Sample containing 45% magnetite and 55% graphene i.e., F45G55 is found to have the largest SAR value of 6.45 W g−1 with saturation magnetization ∼20 emu g−1, that is ∼1.5 times greater than that of pure magnetite (4.32 W g−1) with saturation magnetization ∼42 emu g−1. The role of graphene is to reduce frustration of magnetic moments by monitoring the dipolar interactions with better exfoliation and low agglomeration of Fe3O4 nanoparticles. Moreover, large value of specific heat capacity of graphene contributes an increase in SAR of nanohybrids to even 1.5 times larger than that of the pure magnetite. Nonlinear Autoregressive with External Input (NARX) models are obtained for each of the nanohybrid composition. The accuracy of the predicted results has been evaluated on the basis of Mean Squared Error (MSE). The highest MSE value was obtained for the composition containing 45% magnetite and 55% graphene (F45G55) nanohybrid in the training phase i.e., 0.44703 which is where the model achieved optimal results after 71 epochs. Hence, F45G55 sample was found the best nanohybrid with highest SAR and MSE values for hyperthermia applications in low dosage. With suitable surface functionalization, biocompatible Fe3O4-graphene nanohybrids can be useful candidates for localized magnetic hyperthermia applications.Conflicts of interest
The authors report no conflicts of interest.Acknowledgements
The research is funded by Higher Education Commission (HEC) Pakistan under start-up research grant program (SRGP) Project no. 2454.References
- A. Curcio, et al., Iron oxide nanoflowers@CuS hybrids for cancer tri-therapy: interplay of photothermal therapy, magnetic hyperthermia and photodynamic therapy, Theranostics, 2019, 9(5), 1288 CrossRef CAS PubMed.
- J. Beik, et al., Nanotechnology in hyperthermia cancer therapy: from fundamental principles to advanced applications, J. Controlled Release, 2016, 235, 205–221 CrossRef CAS PubMed.
- L. Jaidev, et al., Multi-functional nanoparticles as theranostic agents for the treatment & imaging of pancreatic cancer, Acta Biomater., 2017, 49, 422–433 CrossRef CAS PubMed.
- P. Moroz, S. Jones and B. Gray, Magnetically mediated hyperthermia: current status and future directions, Int. J. Hyperthermia, 2002, 18(4), 267–284 CrossRef CAS PubMed.
- A. Tayyebi, et al., Fabrication of new magnetite–graphene nanocomposite and comparison of its laser-hyperthermia properties with conventionally prepared magnetite–graphene hybrid, Mater. Sci. Eng., C, 2017, 75, 572–581 CrossRef CAS PubMed.
- A. Szasz, O. Szasz and N. Szasz, Physical background and technical realizations of hyperthermia, in Hyperthermia in Cancer Treatment: A Primer, Springer, 2006, pp. 27–59 Search PubMed.
- S. Laurent, et al., Magnetic fluid hyperthermia: focus on superparamagnetic iron oxide nanoparticles, Adv. Colloid Interface Sci., 2011, 166(1–2), 8–23 CrossRef CAS PubMed.
- D. Jaque, et al., Nanoparticles for photothermal therapies, Nanoscale, 2014, 6(16), 9494–9530 RSC.
- T. Hashimoto, et al., Preparation of photothermal-chemotherapy nanohybrids by complexation of gold nanorods with polyamidoamine dendrimers having poly(ethylene glycol) and hydrophobic chains, J. Mater. Chem. B, 2020, 8(14), 2826–2833 RSC.
- D. Chang, et al., Biologically targeted magnetic hyperthermia: potential and limitations, Front. Pharmacol., 2018, 9, 831 CrossRef PubMed.
- P. J. Sugumaran, et al., GO-functionalized large magnetic iron oxide nanoparticles with enhanced colloidal stability and hyperthermia performance, ACS Appl. Mater. Interfaces, 2019, 11(25), 22703–22713 CrossRef CAS PubMed.
- S. M. Dadfar, et al., Size-isolation of superparamagnetic iron oxide nanoparticles improves MRI, MPI and hyperthermia performance, J. Nanobiotechnol., 2020, 18(1), 1–13 CrossRef PubMed.
- S. Sánchez-Cabezas, et al., Combining magnetic hyperthermia and dual T1/T2 MR imaging using highly versatile iron oxide nanoparticles, Dalton Trans., 2019, 48(12), 3883–3892 RSC.
- A. Sohail, et al., A videographic assessment of ferrofluid during magnetic drug targeting: an application of artificial intelligence in nanomedicine, J. Mol. Liq., 2019, 285, 47–57 CrossRef CAS.
- M. Fatima, et al., Biomechanics of superparamagnetic nanoparticles for laser hyperthermia, Biomed. Eng., 2020, 32(1), 2050007 CAS.
- E. W. Hill, et al., Graphene spin valve devices, IEEE Trans. Magn., 2006, 42(10), 2694–2696 Search PubMed.
- A. A. Balandin, et al., Superior thermal conductivity of single-layer graphene, Nano Lett., 2008, 8(3), 902–907 CrossRef CAS PubMed.
- K. B. Akram, et al., Electrolyte-induced modulation of electronic transport in the presence of surface charge impurities on bilayer graphene, Phys. Status Solidi A, 2017, 214(9), 1700156 CrossRef.
- W. Wan, et al., Highly controllable and green reduction of graphene oxide to flexible graphene film with high strength, Mater. Res. Bull., 2013, 48(11), 4797–4803 CrossRef CAS.
- A. J. Samuels and J. D. Carey, Engineering Graphene Conductivity for Flexible and High-Frequency Applications, ACS Appl. Mater. Interfaces, 2015, 7(40), 22246–22255 CrossRef CAS PubMed.
- K. ul Hasan, et al., A miniature graphene-based biosensor for intracellular glucose measurements, Electrochim. Acta, 2015, 174, 574–580 CrossRef.
- L.-Z. Bai, et al., Inductive heating property of graphene oxide–Fe3O4 nanoparticles hybrid in an AC magnetic field for localized hyperthermia, Mater. Lett., 2012, 68, 399–401 CrossRef CAS.
- L. Ai, C. Zhang and Z. Chen, Removal of methylene blue from aqueous solution by a solvothermal-synthesized graphene/magnetite composite, J. Hazard. Mater., 2011, 192(3), 1515–1524 CrossRef CAS PubMed.
- V. Chandra, et al., Water-dispersible magnetite-reduced graphene oxide composites for arsenic removal, ACS Nano, 2010, 4(7), 3979–3986 CrossRef CAS PubMed.
- M. Dar and S. Ahmed, Effect of light and heavy ion irradiation on graphene device matrix: optical and transport Characteristics, Radiat. Phys. Chem., 2019, 156, 67–72 CrossRef CAS.
- S. Stankovich, et al., Synthesis of graphene-based nanosheets via chemical reduction of exfoliated graphite oxide, Carbon, 2007, 45(7), 1558–1565 CrossRef CAS.
- J. Su, et al., Fe3O4–graphene nanocomposites with improved lithium storage and magnetism properties, J. Phys. Chem. C, 2011, 115(30), 14469–14477 CrossRef CAS.
- B. Lim and S. Zohren, Time series forecasting with deep learning: a survey, 2020, arXiv preprint arXiv:2004.13408.
- R. Stoean, et al., Ranking Information Extracted from Uncertainty Quantification of the Prediction of a Deep Learning Model on Medical Time Series Data, Mathematics, 2020, 8(7), 1078 CrossRef.
- Y. Yao, et al., Synthesis, characterization, and adsorption properties of magnetic Fe3O4@graphene nanocomposite, Chem. Eng. J., 2012, 184, 326–332 CrossRef CAS.
- P. Berger, et al., Preparation and properties of an aqueous ferrofluid, J. Chem. Educ., 1999, 76(7), 943 CrossRef CAS.
- M. Paliwal and U. A. Kumar, Neural networks and statistical techniques: A review of applications, Expert Systems with Applications, 2009, 36(1), 2–17 CrossRef.
- G. Zhang, B. E. Patuwo and M. Y. Hu, Forecasting with artificial neural networks: the state of the art, Int. J. Forecast., 1998, 14(1), 35–62 CrossRef.
- M. Qi and G. P. Zhang, An investigation of model selection criteria for neural network time series forecasting, Eur. J. Oper. Res., 2001, 132(3), 666–680 CrossRef.
- M. Khashei and M. Bijari, An artificial neural network (p, d, q) model for timeseries forecasting, Expert Systems with Applications, 2010, 37(1), 479–489 CrossRef.
- A. Tealab, H. Hefny and A. Badr, Forecasting of nonlinear time series using ANN, Future Computing Inform. J., 2017, 2(1), 39–47 CrossRef.
- I. Goodfellow, Y. Bengio and A. Courville, Deep learning, MIT Press, 2016 Search PubMed.
- C. E. Pedreira, M. C. Medeiros and C. E. Pedreira, What are the effects of forecasting linear time series with neural networks?, What Are The Effects of Forecasting, Texto para discussão, 2001 Search PubMed.
- M. Kayri, Predictive abilities of bayesian regularization and Levenberg–Marquardt algorithms in artificial neural networks: a comparative empirical study on social data, Math. Comput. Appl., 2016, 21(2), 20 Search PubMed.
- K. P. Murphy, Machine learning: a probabilistic perspective, MIT Press, 2012 Search PubMed.
- F. Burden and D. Winkler, Bayesian regularization of neural networks, in Artificial neural networks, Springer, 2008, p. 23–42 Search PubMed.
- R. D. Etzioni and J. B. Kadane, Bayesian statistical methods in public health and medicine, Annu. Rev. Public Health, 1995, 16(1), 23–41 CrossRef CAS PubMed.
- L. D. Broemeling, Bayesian Inference for Stochastic Processes, Chapman and Hall/CRC, 2017 Search PubMed.
- K. B. Akram, et al., Giant ac magnetoconductivity in rGO–Fe3O4 composites, J. Magn. Magn. Mater., 2020, 499, 166174 CrossRef CAS.
- O. V. Yazyev and L. Helm, Defect-induced magnetism in graphene, Phys. Rev. B: Condens. Matter Mater. Phys., 2007, 75(12), 125408 CrossRef.
- D. Thapa, et al., Properties of magnetite nanoparticles synthesized through a novel chemical route, Mater. Lett., 2004, 58(21), 2692–2694 CrossRef CAS.
- P. Fannin and S. Charles, The study of a ferrofluid exhibiting both Brownian and Neel relaxation, J. Phys. D: Appl. Phys., 1989, 22(1), 187 CrossRef CAS.
- J. Motoyama, et al., Size dependent heat generation of magnetite nanoparticles under AC magnetic field for cancer therapy, BioMagnetic Research and Technology, 2008, 6(1), 4 CrossRef PubMed.
- M. F. Erdoğan, et al., The effect of scrubbing hands with iodine-containing solutions on urinary iodine concentrations of the operating room staff, Thyroid, 2013, 23(3), 342–345 CrossRef PubMed.
- P. Burnham, et al., Magnetization and specific absorption rate studies of ball-milled iron oxide nanoparticles for biomedicine, J. Nanopart., 2013, 2013 Search PubMed.
- S. C. Wuang, et al., Synthesis and functionalization of polypyrrole–Fe3O4 nanoparticles for applications in biomedicine, J. Mater. Chem., 2007, 17(31), 3354–3362 RSC.
- M. Nauman, et al., Size-dependent magnetic and magnetothermal properties of gadolinium silicide nanoparticles, RSC Adv., 2020, 10(47), 28383–28389 RSC.
- E. L. Verde, et al., Field dependent transition to the non-linear regime in magnetic hyperthermia experiments: comparison between maghemite, copper, zinc, nickel and cobalt ferrite nanoparticles of similar sizes, AIP Adv., 2012, 2(3), 032120 CrossRef.
- S. Manzoor, et al., Study of magnetothermal properties of strontium doped lanthanum manganite nanoparticles for hyperthermia applications, IEEE Trans. Magn., 2013, 49(7), 3504–3507 CAS.
| This journal is © The Royal Society of Chemistry 2021 |

