 Open Access Article
A SnO2QDs/GO/PPY ternary composite film as positive and graphene oxide/charcoal as negative electrodes assembled solid state asymmetric supercapacitor for high energy storage applications
M. Vandanaa,
Y. S. Nagarajua,
H. Ganesha,
S. Veeresha,
H. Vijeth b,
M. Basappaa and
H. Devendrappa
 *a
*a
aDepartment of Physics, Mangalore University, Mangalagangothri, Mangalore, 574199, India. E-mail: dehu2010@gmail.com
bDepartment of Physics, Mangalore Institute of Technology and Engineering Moodbidri, Badaga Mijar, Karnataka 574225, India
First published on 16th August 2021
Abstract
The work demonstrates tin oxide quantum dots/graphene oxide/polypyrrole (SnO2QDs/GO/PPY) ternary composite deposited on titanium foil as a positive electrode and graphene oxide (GO)/charcoal on titanium foil as negative electrode separated by polyvinyl alcohol/potassium hydroxide (PVA/KOH) gel-electrolyte as a solid-state asymmetric supercapacitor for high energy storage applications. Here, tin oxide quantum dots (SnO2QDs) were successfully synthesized by a hydrothermal technique, and SnO2QDs/GO/PPY ternary composite was synthesized by an in situ method with pyrrole monomer, SnO2, and GO. A pH value controlled, which maintained the uniform size of SnO2QDs dispersed on PPY, through GO ternary composite was used for fabricating the asymmetric supercapacitor electrode with the configuration (SnO2QDs/GO/PPY)/GO/charcoal (85![[thin space (1/6-em)]](https://www.rsc.org/images/entities/char_2009.gif) :
:![[thin space (1/6-em)]](https://www.rsc.org/images/entities/char_2009.gif) 10
10![[thin space (1/6-em)]](https://www.rsc.org/images/entities/char_2009.gif) :
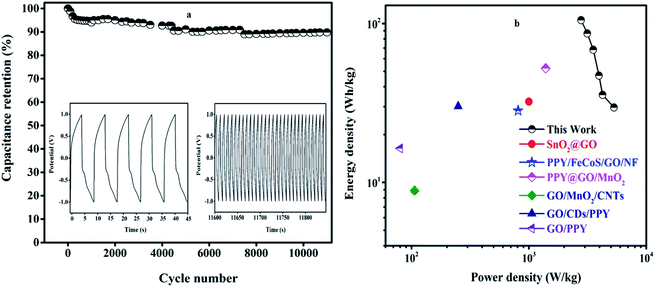
:![[thin space (1/6-em)]](https://www.rsc.org/images/entities/char_2009.gif) 5). The device achieved the highest specific capacitance of 1296 F g−1, exhibited an energy density of 29.6 W h kg−1 and the highest power density of 5310.26 W kg−1 in the operating voltage from 0 to 1.2 V. The device also possessed excellent reliability and retained the capacitance of 90% after 11
5). The device achieved the highest specific capacitance of 1296 F g−1, exhibited an energy density of 29.6 W h kg−1 and the highest power density of 5310.26 W kg−1 in the operating voltage from 0 to 1.2 V. The device also possessed excellent reliability and retained the capacitance of 90% after 11![[thin space (1/6-em)]](https://www.rsc.org/images/entities/char_2009.gif) 000 GCD cycles. This ternary composite is a prominent material for potential applications in next-generation energy storage and portable electronic devices.
000 GCD cycles. This ternary composite is a prominent material for potential applications in next-generation energy storage and portable electronic devices.
1. Introduction
Nowadays, the developing world is facing scarcity of storage energy due to more energy consumption for use in portable devices including mobiles, laptops, tabs, computers, optical display devices, growing renewable energy sources by modern society,1,2 and heavy high energy devices such as high-power backups3,4 and electric trucks. Therefore, batteries are generally used as storage devices with a high energy density of (50–100 W h kg−1),5 but cannot achieve full success due to low power density; thus, they have limited practical applications and industrial production. Recently, supercapacitors have emerged as a new energy storage devices, which have simple operation principles, such as rapid charging–discharging rate, high power density, low cost, environmental friendliness, long cycle life, low maintenance costs, and high safety;6–10 these advantages may provide sustainable power supply to modern industry, electronics and applicability in portable and wearable electronics.11–14 Supercapacitor is consisting of two main parameters, which include power density and energy density parameters: specific capacitance (Csp) and potential window; these can be enhanced by varying the properties of the electroactive materials.15,16 Hence, researchers have paid more attention to synthesize efficient electroactive ternary materials by controlling the pH of SnO2 during the synthesis process and concentration for improving its surface area that is required to design high-performance supercapacitors. Supercapacitors can store charges either by ion adsorption mechanisms, i.e., EDLCs17 or by faradic reactions. Generally, according to different charge storage mechanisms, supercapacitors are categorized into two types, EDLC and pseudocapacitors.18 The charge is stored at the electrode surface and the reversible adsorption/desorption of ions takes place to form an electrical double layer (EDLC) (generally carbon materials including graphene, activated carbon, carbon aerogel, porous carbon, and carbon nanotubes) at the electrode/electrolyte interface. In the past, graphene oxide (GO) has retained substantial attention in energy storage devices due to its superior; properties, such as high electrical conductivity, large specific surface area (2675 m2 g−1), and excellent chemical stability. Unfortunately, the unstrained restacking of graphene nanosheets causes exhausting electrolyte ion-diffusion and the low capacitance (from EDLC) restricted their practical applications.19–22 The GO with pseudocapacitive materials has achieved the high capacitance with a better electrochemical performance. The pseudocapacitor mechanism involves surface redox reactions between the electrolyte and the electrode material. Therefore, compared to EDLC, pseudocapacitors have a higher energy density, and the capacitance enhancement is associated with multiple oxidation states of transition metals. Some metal oxides23 such as ruthenium oxide (RuO2),24 CoMoO4,25 TiO2,26 cobalt oxide (Co3O4),27 manganese oxide (MnO2),28 SnO2, Fe3O4,29 and SiO2/TiO2 (ref. 30) exhibited high capacitance; among these SnO2 has been considered one of the novel materials for supercapacitors due to the enhanced cycle stability and it shows excellent electrochemical performance. Recently, Wang et al.31 reported a one-pot synthesis of SnO2/graphene, showing a Csp of 99.7 F g−1. Liu et al.32 studied SnO2 nanostructures, which gave rise to Csp of 187.7 F g−1 at current densities of 1.0 A g−1. Chen Mingxi et al.33 reported SnO2/rGO droplet aerogel with complex morphologies and their application in supercapacitors exhibited Csps of 310 F g−1 and 180 Fcm−3. Ramesh et al.34 produced a GO@SnO2 electrode for supercapacitor applications that exhibited Csp of ∼378 F g−1 at a current density of 4 A g−1 and a maximum cycle stability of up to 5000 cycles. Du Xianfeng et al.35 proposed a SnO2@polypyrrole composite that produced a high Csp of about 790 mA h g−1 at 200 mA g−1 after 200 cycles. The conjugated polymers are one more class of pseudocapacitors useful to improve the conductivity of the electrode material. Among various conductive polymers, such as polypyrrole (PPY), polyaniline (PANI), polythiophene (PTH), polyacetylene and PEDOT,36–40 PPY is a promising candidate as pseudocapacitive electrode material due to its good chemical stability, low cost, and reversible redox processes, and large volumetric change during charge/discharge and earth abundance excellent electrical conductivity. At present, the performance of polypyrrole is improved significantly by combining metal oxides such as SnO2 and carbon nanomaterials like graphene oxide play an important role in supercapacitor applications. Recently, the development of asymmetric supercapacitors (ASCs)41 is achieved based on the extended operating voltage window and improved energy density. Normally, supercapacitors are fabricated by using pseudocapacitance materials (positive electrode) with a carbon-based material (negative electrode).Here, we investigated the performance of a supercapacitor with a large operating voltage window, we construct solid-state ASCs consisting of SnO2QDs/GO/PPY (SGP4) as the positive electrode, GO/charcoal as the negative electrode, and a polyvinyl alcohol (PVA)/KOH used as a gel electrolyte. The pH-controlled uniform-size SnO2QDs were prepared using a simple hydrothermal treatment, and SnO2QDs/GO/PPY (SGP) ternary composites were prepared by a one-pot in situ chemical oxidation method. We investigated the structural, optical, and electrochemical, properties of ternary composites. The electrochemical study proved that the SnO2QDs/GO/PPY composite electrode exhibited the highest specific capacitance compared to pure SnO2QDs, GO and PPY. SnO2QDs/GO/PPY ternary asymmetric supercapacitors device was fabricated and its electrochemical characterizations were carried out by the two-electrode system. Measured CV, GCD, EIS, ED, and cycle stability were compared with other reported values. Obtained results demonstrate that SnO2QDs/GO/PPY ternary materials have great potential for supercapacitors.
2. Experimental methods
2.1. Materials
Pyrrole monomer (C4H5N) (99%), ferric chloride (FeCl3) (97%), tin(IV) chloride pentahydrate (SnCl4·5H2O) (98%), polyvinyl alcohol (PVA) (99%) graphite powder (99.99%), and polyvinylidene difluoride (PVDF) (99%) were obtained from Sigma-Aldrich and used without further purification. Potassium hydroxide (KOH), N-methyl-2-pyrrolidone (NMP), activated carbon, nitric acid (HNO3), sulphuric acid (H2SO4), hydrazine hydrate (N2H4·H2O) (98%) were purchased from Merck Chemicals. All the reagents were used as received without any purification. Ultra-pure water was used throughout the experiments, which was obtained using a Milli-Q system from Millipore (Milford MA, USA).2.2. Synthesis of SnO2 quantum dots
The 3.79 g of SnCl4·5H2O (0.1 M) and 1.92 g of hydrazine hydrate (0.3 M) were added to 200 ml of distilled water with constant stirring. The immediate reaction of SnCl4 with hydrazine hydrate (N2H4·H2O) forms a white precipitate. After 20 minutes of stirring, the solution was poured into a stainless steel autoclave heated at 180 °C for 24 hours. The product was centrifuged at 2000 rpm for 20 minutes and rinsed with distilled (DI) water, dried at 50 °C for 2 hours, SnO2 quantum dots powder was thus obtained.2.3. Synthesis of graphene oxide (GO)
GO was synthesized by the modified Hummer's method. Briefly, 1.5 g of graphite powder was added to the solution of 23 ml of concentrated H2SO4 and 1.5 g of NaNO3. The above solution was mixed and stirred several times, continuously, further 3 g of KMnO4 was added to the flask and stirring was maintained for 2 hours. Then, 46 ml of DI water was added drop-wise to the flask and heated at 60 °C for 2 hours with continuous stirring, 10 ml of H2O2 was then added to the flask with constant stirring for 1 hour. The colour of the solution turned yellowish-brown. The yellowish-brown GO suspension was filtered and washed with DI water several times and dried at 50 °C for 2 hours.2.4. Synthesis of SnO2QDs/graphene oxide/PPY ternary composite
The SnO2QDs/GO/PPY ternary composite was synthesized by in situ chemical oxidation polymerization of pyrrole. 2 ml of pyrrole monomer was added to 100 ml of 1 M HCl stirred for 1 h, followed by drop-wise addition of SnO2QDs and GO suspension (the ratio of GO to SGP was 1![[thin space (1/6-em)]](https://www.rsc.org/images/entities/char_2009.gif) :
:![[thin space (1/6-em)]](https://www.rsc.org/images/entities/char_2009.gif) 9). The above solution was sonicated for 30 min and kept at 0 °C for 24 h. Then, 11.354 g of FeCl3 in 100 ml of 1 M HCl was added drop-wise to the pyrrole suspension kept in an ice bath (temperature 0 °C) with constant stirring and kept for one day for polymerization. The suspension was centrifuged at 3000 rpm for 15 min and washed with DI water several times, SnO2QDs/graphene oxide/PPY ternary composite powder was obtained.
9). The above solution was sonicated for 30 min and kept at 0 °C for 24 h. Then, 11.354 g of FeCl3 in 100 ml of 1 M HCl was added drop-wise to the pyrrole suspension kept in an ice bath (temperature 0 °C) with constant stirring and kept for one day for polymerization. The suspension was centrifuged at 3000 rpm for 15 min and washed with DI water several times, SnO2QDs/graphene oxide/PPY ternary composite powder was obtained.
3. Characterization techniques
The chemical change was analyzed by Fourier transform infrared (FT-IR) absorption measurements on an ATR ALPHA BRUKER instrument and X-ray measurements were performed on a Rigaku Miniflex-II diffractometer using CuKα radiation of wavelength λ = 1.5406 Angstrom. TEM images were obtained using a JEOL-JEM2100 transmission electron microscope. An electrochemical workstation CH-166E was used for measurement of electrochemical performance. XPS analysis was performed using an AXIS-ULTRA instrument from AXIS-165. Chemical analysis was performed using Raman (LabRAM) spectroscopy with UV visible Raman 325 nm and 514 nm LASER .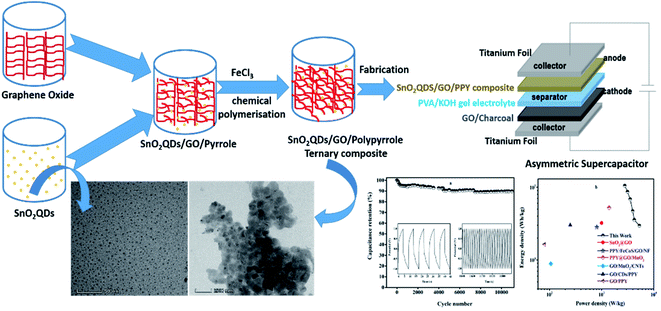 | ||
| Scheme 1 Representation of synthesis steps of SnO2QDs/GO/PPY ternary composites and SnO2QDs/GO/PPY//GO/charcoal asymmetric supercapacitor device. | ||
4. Supercapacitor device fabrication
The electrochemical performance of SnO2QDS, GO, PPY, and SnO2QDS/GO/PPY ternary composites was studied on a CH166E electrochemical instrument with three electrodes, where the counter-electrode was a platinum wire and the reference electrode was Ag/AgCl and the working electrodes were prepared by mixing the synthesized SnO2QDS/GO/PPY with a small amount of PVDF with the ratio of 95![[thin space (1/6-em)]](https://www.rsc.org/images/entities/char_2009.gif) :
:![[thin space (1/6-em)]](https://www.rsc.org/images/entities/char_2009.gif) 5 in NMP solvent; the prepared slurry was coated on a titanium sheet and dried at 60 °C for 4 hours to evaporate off the solvent. 3 M-KOH was used as an electrolyte. But in the two-electrode system, the asymmetric supercapacitor device contained both positive and negative electrodes. The SnO2QDS/GO/PPY//GO/charcoal asymmetric device was fabricated by sandwiching the prepared SnO2QDS/GO/PPY coated titanium foil as a positive electrode and graphene oxide/charcoal, coated titanium foil as the negative electrode (ternary composites/GO/PPY in the ratio 85
5 in NMP solvent; the prepared slurry was coated on a titanium sheet and dried at 60 °C for 4 hours to evaporate off the solvent. 3 M-KOH was used as an electrolyte. But in the two-electrode system, the asymmetric supercapacitor device contained both positive and negative electrodes. The SnO2QDS/GO/PPY//GO/charcoal asymmetric device was fabricated by sandwiching the prepared SnO2QDS/GO/PPY coated titanium foil as a positive electrode and graphene oxide/charcoal, coated titanium foil as the negative electrode (ternary composites/GO/PPY in the ratio 85![[thin space (1/6-em)]](https://www.rsc.org/images/entities/char_2009.gif) :
:![[thin space (1/6-em)]](https://www.rsc.org/images/entities/char_2009.gif) 10
10![[thin space (1/6-em)]](https://www.rsc.org/images/entities/char_2009.gif) :
:![[thin space (1/6-em)]](https://www.rsc.org/images/entities/char_2009.gif) 5) separated by Whatman 93 filter paper with a PVA-KOH gel electrolyte.42 The specific capacitance (Csp) (F g−1) was calculated from the cyclic voltammetry curve using the equation,
5) separated by Whatman 93 filter paper with a PVA-KOH gel electrolyte.42 The specific capacitance (Csp) (F g−1) was calculated from the cyclic voltammetry curve using the equation,
 | (1) |
 | (2) |
 | (3) |
 | (4) |
5. Results and discussions
5.1. FT-IR analysis
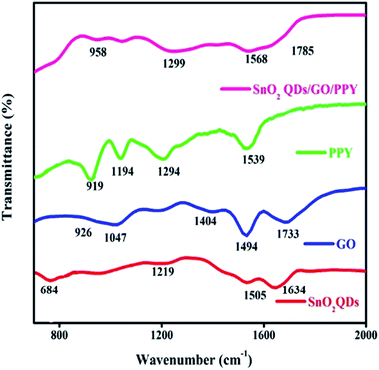
FT-IR spectra of SnO2QDs, GO, PPY and SnO2QDs/GO/PPY composites are shown in Fig. 1. The peak at 684 cm−1 is ascribed to the O–Sn–O bridge functional group of SnO2, which confirms the presence of SnO2 in the crystalline phase.43 The band centered at 1634 cm−1 found in materials is assigned to O–H stretching, which is caused by vibrations of the adsorbed water molecules.The peaks at 1219 and 1505 cm−1 represent the wag and twist band between two metal ions, respectively. 1733 cm−1 is assigned to the C![[double bond, length as m-dash]](https://www.rsc.org/images/entities/char_e001.gif) O bond (carboxyl group) located at the GO edge,44,45 1047 cm−1, and 926 cm−1 assigned to the C–O–C (epoxide) and peroxide bond, respectively.46 The remaining sp2 carbon in the graphite is represented at 1494 cm−1. The PPY peak at 1539 cm−1 is assigned to the C–C vibration, 1194 cm−1 peak exhibits the C–N stretching vibration.47 The peak near 919 cm−1 is assigned to the
O bond (carboxyl group) located at the GO edge,44,45 1047 cm−1, and 926 cm−1 assigned to the C–O–C (epoxide) and peroxide bond, respectively.46 The remaining sp2 carbon in the graphite is represented at 1494 cm−1. The PPY peak at 1539 cm−1 is assigned to the C–C vibration, 1194 cm−1 peak exhibits the C–N stretching vibration.47 The peak near 919 cm−1 is assigned to the ![[double bond, length as m-dash]](https://www.rsc.org/images/entities/char_e001.gif) C–N plane deformation mode.48 The band at 1294 cm−1 confirms the
C–N plane deformation mode.48 The band at 1294 cm−1 confirms the ![[double bond, length as m-dash]](https://www.rsc.org/images/entities/char_e001.gif) C–H in-plane vibration. Notably, in the composite, the peak at 1539 cm−1 of PPY is assigned to the C–C bending vibration shifted to 1568 cm−1 due to the effective combination of three kinds of material. The 1733 cm−1 peak of graphene oxide is shifted to 1785 cm−1 in SGP, upon increasing the concentration of graphene oxide, the original peak of graphene oxide is shifted in the SGP composite as confirmed from the formation of bipolaron.
C–H in-plane vibration. Notably, in the composite, the peak at 1539 cm−1 of PPY is assigned to the C–C bending vibration shifted to 1568 cm−1 due to the effective combination of three kinds of material. The 1733 cm−1 peak of graphene oxide is shifted to 1785 cm−1 in SGP, upon increasing the concentration of graphene oxide, the original peak of graphene oxide is shifted in the SGP composite as confirmed from the formation of bipolaron.
5.2. XRD analysis
The polycrystalline phase of SnO2QDs was analyzed by XRD as shown in Fig. 2. The diffraction peaks are located at 26.3°, 33.7°, 37.9°, 51.71°, 64.70°, 70.6°, 77.8° are indexed to the crystal planes (110), (101), (200), (211), (220), (202), (321), respectively, which are in good agreement with the JCPDS (card no 41-1445) values.49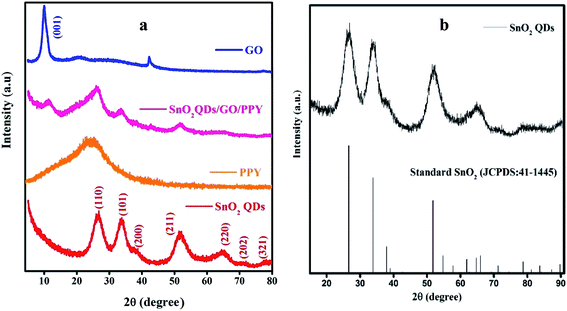 | ||
| Fig. 2 XRD pattern of (a) SnO2QDs, PPY, GO and SnO2QDs/GO/PPY composites and (b) corresponding JCPDS data of standard SnO2 (JCPDS: 41-1445). | ||
The wide diffraction peak at 2θ = 9.78° with the (001) crystal plane shows the oxygen functional groups present in graphene.50 The small peaks observed at 2θ = 20° and 42° indicate that graphene is not fully interconnected with an oxygen atom. The amorphous nature of polypyrrole51 is attributed to the broad peak at about 2θ = 24.63°. The SnO2QDs/GO/PPY composite contains all the characteristic peaks of both SnO2QDs, GO and PPY. The broad peak in the SGP3 composite at 2θ = 26.2° represents the polymer present in the composite and there is no agglomeration of the polymer and SnO2QDs on the graphene oxide surface and they are well dispersed in the composite.
5.3. Raman spectroscopy analysis
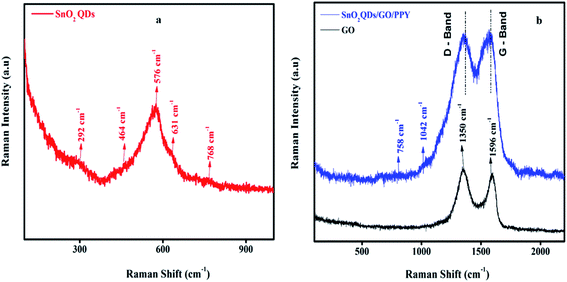
Fig. 3 shows the structural changes in SnO2QDs, GO and SnO2QDs/GO/PPY ternary composites as reflected in the Raman spectra. The five Raman active modes observed in the SnO2QDs at 292, 464, 576, 631, and 768 cm−1 are related to Raman forbidden modes of Eu (doubly-degenerate vibration), A2u, A1g, B2g (singly-degenerate vibration), respectively.52The band at 464 cm−1 is related to the vibrational features demonstrating the surface defect in SnO2QDs, as shown in Fig. 3(a).
Furthermore, the presence of bands in the region of 900–1042 cm−1 indicates the presence of PPY in SnO2QDs/GO/PPY ternary composite, as shown in Fig. 3(b). The D/G ratio from 0.89 (GO) to 1.01 (SnO2QDs/GO/PPY ternary composite) and Ig/I2d ratio of SGP3 composite is 0.39, suggesting that GO is reduced and more defects are formed in tin oxide/PPY composites. The broad peaks in the composite appearing at 1353 and 1599 cm−1 are ascribed to the G and D bands of graphene oxide, respectively,53 in the composite.
5.4. TEM analysis
Fig. 4(a and b) shows the HR-TEM and, TEM images of SnO2QDs along with the corresponding selected area electron diffraction pattern shown in Fig. 4(c) revealing clear lattice fringes. The tetragonal crystal structure of SnO2 quantum dots was studied by lattice spacing of approximately 0.33 nm as shown in Fig. 4(a).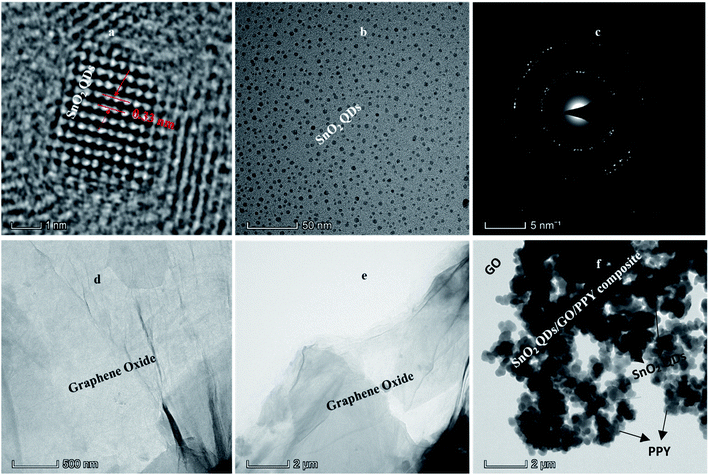 | ||
| Fig. 4 HRTEM analysis of SnO2QDs (a) TEM analysis of SnO2QDs (b) and SAED pattern of SnO2QDs (c) and TEM image of GO (d and e) and SnO2QDs/GO/PPY composite (f). | ||
Under hydrothermal conditions, the size and morphology of quantum dots depend on the reaction temperature, time duration, and the pH of the solution. If the pH value is changed, SnO2 quantum dots further turn into cubic shapes with larger sizes.54 Fig. 4(b) shows the spherical SnO2QDs with particle sizes varying from 2 to 5 nm obtained at 180 °C, 24 h at a pH of 10. The SAED pattern shown in Fig. 4(c) confirms that the rutile tetragonal SnO2QDs are well crystallized. The TEM image of graphene oxide shows a transparent graphene sheet with thin-film morphology due to the rapid elimination of intercalated oxygen by using exfoliation or sonication to remove the multilayer disordered graphene sheets.
Fig. 4(f) shows a black dot array of SnO2 quantum dots covered by PPY and graphene oxide layers and distribution on the graphene sheet through the strong electrostatic binding between SnO2QDs and PPY. In the ternary composite SnO2, QDs were dispersed into GO and PPY layers. Some hollow SnO2 particles are broken, because of sonication in the preparation process of ternary nanocomposites.
5.5. XPS analysis
XPS is used to study the chemical states of the synthesized ternary SnO2QDs/GO/PPY composites. The wide scan spectrum and resolved spectra of C 1s, O 1s, Sn 3d, and N 1s, are shown in Fig. 5(a–e). The wide scan spectrum shown in Fig. 5(a) demonstrates the presence of carbon (C), oxygen (O), tin (Sn), and nitrogen (N) elements in the SnO2QDs/GO/PPY ternary composite. The high-resolution deconvoluted spectra of C 1s in the SnO2QDs/GO/PPY composites are shown in Fig. 5(b). The lowest binding energy peak observed at 285.29 eV is linked with the C–N bond of PPY present in the SGP composite.55 The peak at 286.19 eV corresponds to the C–OH bond and 288.68 eV is attributed to the C![[double bond, length as m-dash]](https://www.rsc.org/images/entities/char_e001.gif) O bond obtained due to the low reduced ability of tin still containing some amount of oxygenated groups present in the composite. The peak at 284.69 eV represents the C–C bond due to the presence of graphene and PPY in the composite. Fig. 5(c) shows the O 1s core-level spectra of SGP composite composed of 3 peaks at 531.2, 532.5, and 533.4 eV. The lowest peak at 531.2 eV is attributed to the binding energy of the Sn–O bond56 in the composite and the other two resemble C
O bond obtained due to the low reduced ability of tin still containing some amount of oxygenated groups present in the composite. The peak at 284.69 eV represents the C–C bond due to the presence of graphene and PPY in the composite. Fig. 5(c) shows the O 1s core-level spectra of SGP composite composed of 3 peaks at 531.2, 532.5, and 533.4 eV. The lowest peak at 531.2 eV is attributed to the binding energy of the Sn–O bond56 in the composite and the other two resemble C![[double bond, length as m-dash]](https://www.rsc.org/images/entities/char_e001.gif) O and C–OH bonds that help in the dispersion of SnO2QDs on the graphene sheet through electrostatic attraction and hydrogen bonding.
O and C–OH bonds that help in the dispersion of SnO2QDs on the graphene sheet through electrostatic attraction and hydrogen bonding.
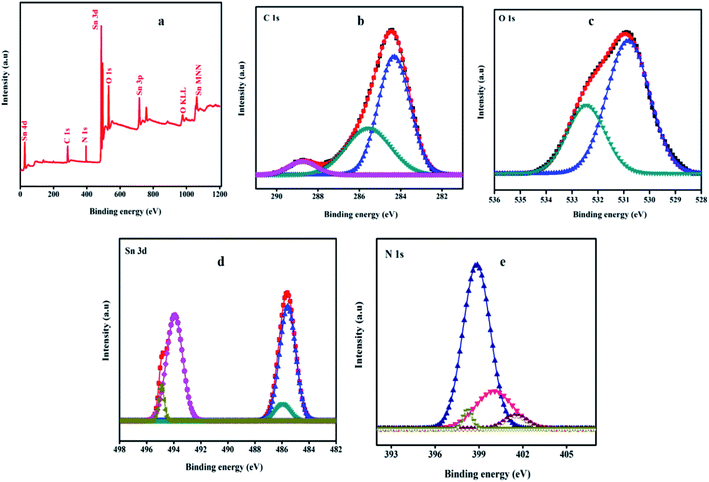 | ||
| Fig. 5 XPS survey scan spectra of (a) SnO2QDs/GO/PPY composite, (b) deconvoluted spectra for C 1s, (c) O 1s, (d) Sn 3d, and N 1s (e) of SnO2QDs/GO/PPY composite. | ||
Fig. 5(d) shows the Sn 3d spectrum decomposed into two peaks at 486.8 and 495.4 eV. The lowest binding energy peak at 486.8 eV is assigned to Sn 3d5/2 and the higher binding energy peak (495.4 eV) is ascribed to Sn 3d3/2, these results are in good agreement with the energy splitting of standard SnO2.57 The peak separation between Sn 3d3/2 and Sn 3d5/2 are 8.6 eV and 1.587, respectively, is the area ratio between these two peaks. Fig. 5(e) presents the N 1s core-level XPS spectra. There is an existence of PPY present in the SnO2QDs/GO/PPY composite and the deconvoluted spectra showing four peaks, out of them the two peaks at 398.8 eV indicate the –C![[double bond, length as m-dash]](https://www.rsc.org/images/entities/char_e001.gif) N bond and 400.1 eV, 401.65 eV are assigned to –NH- and –NH+- positive and negatively charged, respectively, of the amine link structure present in the SnO2QDs/GO/PPY composite.
N bond and 400.1 eV, 401.65 eV are assigned to –NH- and –NH+- positive and negatively charged, respectively, of the amine link structure present in the SnO2QDs/GO/PPY composite.
5.6. Electrochemical analysis of PPY, SnO2QDs, GO and SnO2QDs/GO/PPY composite
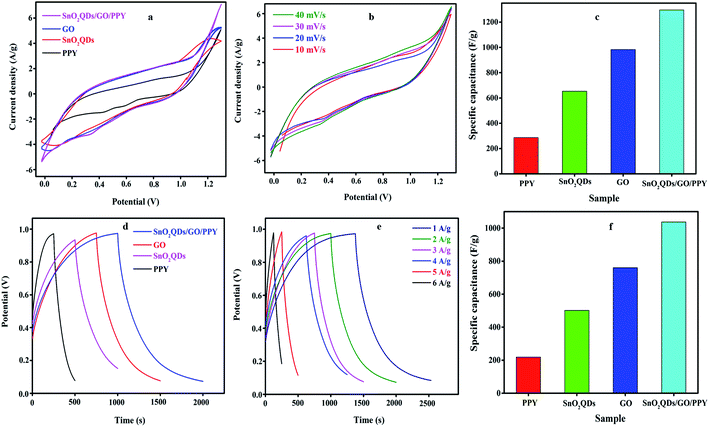
The electrochemical analysis of PPY, SnO2QDs, GO and SnO2QDs/GO/PPY composite was studied from CV and GCD curves. Fig. 6(a) shows the cyclic voltammetry curve at 40 mV s−1 within the potential window 0 to 1.2 V.The area of the CV curve increases for the SnO2QDs/GO/PPY composite indicates high electrical conductivity, indicating higher specific capacitance compared to pure SnO2QDs, GO, and PPY. It possesses both EDL capacitance and apparent pseudocapacitance nature due to the presence of PPY and SnO2 in the composite, as proved in the redox peak. The combined effect of SnO2, GO and PPY is the reason for the large area redox peak. The reversible redox reaction of tin oxide quantum dots is,
| SnO2 + OH− ↔ SnO3H + e− |
Fig. 6(b) shows that CV curves of SnO2QDs/GO/PPY composite at scan rates from 10 to 40 mV s−1 retain a similar rectangular shape without any distortion with increasing scan rate in the CV curve. The small shift in the redox peak with respect to the scan rate indicates the good response of ions and EDL capacitive behavior.58 Fig. 6(c) shows the Csp calculated from cyclic voltammetry curves by using eqn (1). The SnO2QDs/GO/PPY composite exhibits the highest Csp of 1296.14 F g−1 at 40 mV s−1, which is higher than that of pure PPY (286.34 F g−1), SnO2QDs (652.83 F g−1), and pure GO (983.65 F g−1). As the scan rate increases, Csp goes down, exhibiting a better rate capacity. Galvanostatic charging-discharging curves of SnO2QDs, GO, PPY, and SnO2QDs/GO/PPY (SGP) composite at 4 A g−1 are shown in Fig. 6(d). All the GCD curves show the nearly triangular profile (EDLC behavior) with a very small iR-drop in response to the redox reaction between the electrode–electrolyte interfaces, which is reliable with CV results. The discharge time of the SnO2QDs/GO/PPY composite at 4 A g−1 is (2000 s) larger than that of pure SnO2QDs (1000 s), GO (1500 s) and PPY (500 s). The GCD curves of the SGP composite at different current densities (1 A g−1 to 6 A g−1) are shown in Fig. 6(e). If the current density is higher, the discharge time decreases, indicating that the redox reaction reversibly takes place under diffusion control and symmetrical triangles with small iR-drop show good supercapacitor performance.59 The Csp of asymmetric supercapacitors was calculated using eqn (2) from the discharge curves of Fig. 6(f). The obtained Csp of the SnO2QDs/GO/PPY composite is 1037.34 F g−1 at 4 A g−1, and it shows a more capacitive nature than that of pure PPY (218.67 F g−1), SnO2QDs (502 F g−1), GO (760.55 F g−1). The larger value of the Csp of the composite is mainly because of the synergistic combination of three kinds of components in the ternary compound containing EDLC of GO, SnO2QDs, and pseudocapacitance of polypyrrole.54,55 The Nyquist plots of SnO2QDs, GO, PPY and SGP ternary composites are shown in Fig. (7). EIS is measured from 0.1 Hz to 100 kHz, where the solution resistance, Rs and the charge-transfer resistance Rct, at the electrode/electrolyte surface and W is the Warburg impedance, which exhibits ion-diffusion at the electrode/electrolyte interface. Rs of SGP, GO, SnO2QDs, and PPY are found to be 0.92, 1.35, 1.51 and 1.66 Ω, respectively. In the low-frequency region, SnO2QDs/GO/PPY plot shows a more vertical shape that represents the better capacitive behavior.
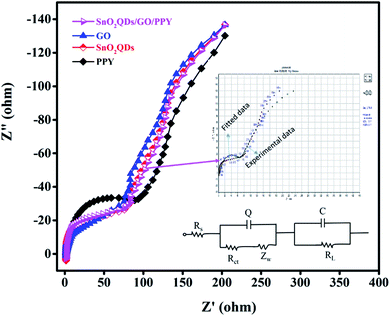 | ||
| Fig. 7 Nyquist plots of PPY, SnO2QDs, GO, and SnO2QDs/GO/PPY nanocomposite with an equivalent circuit for the SnO2QDs/GO/PPY nanocomposite. | ||
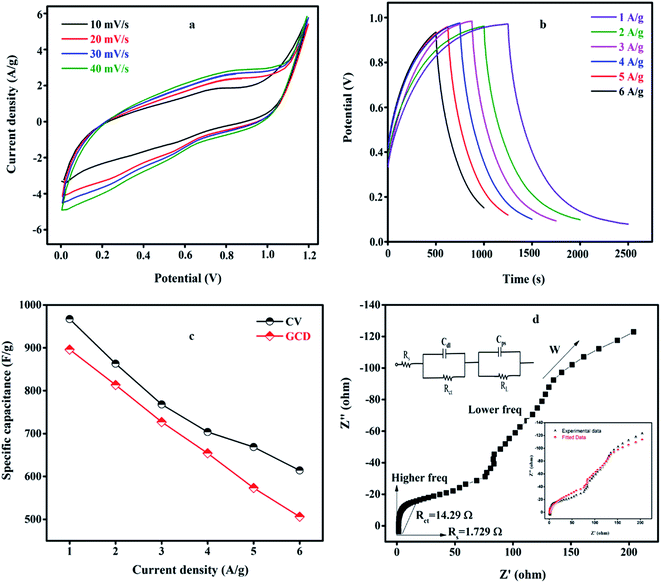
The inset is the equivalent circuit for SnO2QDs/GO/PPY composite. Rct values of SGP, GO, SnO2QDs, and PPY are 72, 74, 82 and 94 Ω, respectively. The composite shows a low value of Rct and Rs indicating high conductivity. The diffusion takes place from high to low frequency, therefore, W is in series with Rct (Scheme 1).
The CV curves of the asymmetric supercapacitors were recorded at various scan rates from 10 to 40 mV s−1 in the potential window of 0 to 1.2 V as shown in Fig. 8(a). The SGP composite shows the quasi rectangular-shaped CV curves showing a pseudocapacitance behavior. All CV curves have symmetrical shapes indicating a stable electrochemical performance. As the scan rate increases from 10 to 40 mV s−1, the area under the CV curve is large showing the highest capacitance electrode material. The GCD plot of an asymmetric supercapacitor device at a different current density from 1 to 6 A g−1 is shown in Fig. 8(b). The triangular charge–discharge profiles for all current densities indicate a good response to the redox reaction that takes place at the electrode and electrolyte interface. The GCD curves show less voltage drop exhibits good electrochemical reversibility. The plots of the specific capacitance vs. current density are shown in Fig. 8(c). The SnO2QDs/GO/PPY device exhibiting the maximum specific capacitance at 1 A g−1 from CV is 967.012 F g−1 and from GCD is 896.07 F g−1, still retained to 506 F g−1 at 6 A g−1 of current density represents the excellent stability of the device. As the current density increases, the specific capacitance found decreases as shown in Fig. 8(c). EIS plots of asymmetric devices are sown in Fig. 8(d). The vertical line in the Nyquist plot represents the low-frequency region and the semicircle observed in the high-frequency region shown in the figure indicates the ideal supercapacitive behavior. Rct and Rs values of the asymmetric device are 14.29 Ω and 1.729 Ω, respectively. The inset in Fig. 8(d) shows the equivalent circuit of SnO2QDs/GO/PPY//GO/charcoal asymmetric supercapacitor device fitted using Randles Circuit Model.60 The cycle stability of the device was carried out using the GCD curve shown in Fig. 9(a), (inset). The device showed 92.68% capacitance retention after 10![[thin space (1/6-em)]](https://www.rsc.org/images/entities/char_2009.gif) 000 cycles at 6 A g−1, which was due to the synergetic contribution of three components (i) SnO2QDs prevent the agglomeration of PPY and attainability of electrolyte increases, (ii) polypyrrole increases the pseudocapacitance of the asymmetric SGP device, (iii) graphene oxide acts as a conductive bridge between SnO2QDs and PPY and it increases the electrical double layer capacitance of the device.
000 cycles at 6 A g−1, which was due to the synergetic contribution of three components (i) SnO2QDs prevent the agglomeration of PPY and attainability of electrolyte increases, (ii) polypyrrole increases the pseudocapacitance of the asymmetric SGP device, (iii) graphene oxide acts as a conductive bridge between SnO2QDs and PPY and it increases the electrical double layer capacitance of the device.
The energy and power density were analyzed from the GCD curve using eqn (3) and (4). The SnO2QDs/GO/PPY//GO/charcoal asymmetric device shows the energy density of 29.6 W h kg−1 and highest power density of 5310.26 W kg−1, these results are higher than those previously reported in the literature for graphene–polymer composites. For example, SnO2/GO61 electrochemical supercapacitors exhibit an energy density of 32.2 W h kg−1 with a power density of 1000 W kg−1, reaching a specific capacitance of 348 F g−1, PPY/FeCoS-rGO/NF//rGO.62 The ASC device exhibits a Csp of 94 F g−1 and ED of 28 W h kg−1 at a power density of 810 W kg−1. The PPy/GO|PPy/MnO2 (ref. 63) symmetrical supercapacitor preserves Csp of 786 F g−1, the energy density of 52 W h kg−1 at a specific power of 1392 W kg−1 with cycle stability of over 1000 cycles. Graphene/MnO2/CNTs64 nanocomposite-based high-performance supercapacitor produces the specific capacitance of 372 F g−1. GO/CDs/PPY65 exhibiting a Csp of 576 F g−1 at a current density of 0.5 A g−1. The GO/PPY66 composite electrode exhibits the highest Csp of 481 F g−1, PPy/FeCoS–rGO/rGO67 asymmetric device exhibits a specific capacitance of 94 F g−1 and an energy density of 28 W h kg−1 at a power density of 810 W kg−1, NiCo2S4@PPy/NF//AC device68 exhibits a high energy density of 34 W h kg−1 at a power density of 120 W kg−1 with 80.64% of the retention, RGO/PPY69 films achieved the Csp of 361 F g−1 and exhibited 80% of retention for 5000 cycles. MnO2@PANI//MnO2@PANI70 asymmetric supercapacitor showed higher energy density of 37 W h kg−1, PPY micro/nanosphere71 showed high capacitance of 568 F g−1, demonstrating 77% retention of the capacitance. The observed results suggested that SnO2QDs/GO/PPY ternary composite electrodes are favorable for high-performance solid-state asymmetric supercapacitor applications.
6. Conclusions
In summary, we successfully synthesized SnO2QDs using a one-step hydrothermal method and SnO2QDs/GO/PPY ternary composites by an in situ chemical technique. The SnO2QDs/GO/PPY electrode revealed a high Csp of 1296 F g−1 at 40 mV s−1. To investigate the practical applications, we assembled an asymmetric supercapacitor based on SnO2QDs/GO/PPY ternary composite used as positive and GO/charcoal as the negative electrode. A device delivers a Csp of 967.012 F g−1 at the 1 A g−1 current density. The maximum energy density achieved by the asymmetric device is 29.6 W h kg−1 with the highest power density of 5310.26 W kg−1 (92.68% capacitance retention). The SnO2QDs/GO/PPY//GO/charcoal asymmetric device has excellent cycle stability attributed to the synergetic effect of different materials present in the polypyrrole. These results demonstrate that SnO2QDs/GO/PPY is favourable electrode material for novel energy storage devices.Conflicts of interest
This is certified that there is no conflict of interest with results present in the manuscript.Acknowledgements
Authors gladly acknowledge the INUP program, CENSE, IISC Bangalore, India and also acknowledged to the commission of OBC, Bangalore, the government of Karnataka for providing financial support.References
- Z. Yu, L. Tetard, L. Zhai and J. Thomas, Energy Environ. Sci., 2015, 8(3), 702–730 RSC.
- H. Wang and H. Dai, Chem. Soc. Rev., 2013, 42(7), 3088–3113 RSC.
- N. Omar, M. Daowd, O. Hegazy, G. Mulder, J. M. Timmermans, T. Coosemans, P. Vanden Bossche and J. Van Mierlo, Energies, 2012, 5, 138–156 CrossRef.
- A. Emadi, K. Rajashekara and S. S. Williamson, IEEE Trans. Veh. Technol., 2005, 4, 763–770 CrossRef.
- L. Chen, X. Fan, E. Hu, X. Ji, J. Chen, S. Hou and C. Wang, Chem, 2019, 5(4), 896–912 CAS.
- M. Li, J. Cheng, J. Wang, F. Liu and X. Zhang, Electrochim. Acta, 2016, 206, 108–115 CrossRef CAS.
- W. Wang, Q. Hao, W. Lei, X. Xia and X. Wang, RSC Adv., 2012, 2, 10268–10274 RSC.
- X. Wang, X. Han, M. Lim, N. Singh, C. L. Gan, M. Jan and P. S. Lee, J. Phys. Chem. C, 2012, 116, 12448–12454 CrossRef CAS.
- W. Wei, W. Ye, J. Wang, C. Huang, J. B. Xiong, H. Qiao, L. Mi and P. Yan, ACS Appl. Mater. Interfaces, 2019, 11(35), 32269–32281 CrossRef CAS PubMed.
- W. Wei, J. Wu, S. Cui, Y. Zhao, W. Chen and L. Mi, Nanoscale, 2019, 11(13), 6243–6253 RSC.
- B. Tong, W. Wei, Z. Wu, L. Zhao, W. Ye, J. Wang and L. Mi, ACS Appl. Energy Mater., 2021, 4(4), 3221–3230 CrossRef CAS.
- C. Xu, Z. Li, C. Yang, P. Zou, B. Xie, Z. Lin, Z. Zhang, B. Li, F. Kang and C. P. Wong, Adv. Mater., 2016, 28(21), 4105–4110 CrossRef CAS PubMed.
- Q. Lv, S. Wang, H. Sun, J. Luo, J. Xiao, J. Xiao, F. Xiao and S. Wang, Nano Lett., 2016, 16(1), 40–47 CrossRef CAS PubMed.
- M. Mo, C. Chen, H. Gao, M. Chen and D. Li, Electrochim. Acta, 2018, 269, 11–20 CrossRef CAS.
- S. Vivekchand, C. S. Rout, K. Subrahmanyam, A. Govindaraj and C. Rao, J. Chem. Sci., 2008, 120(1), 9–13 CrossRef CAS.
- X. Yu, B. Lu and Z. Xu, Adv. Mater., 2014, 26(7), 1044–1051 CrossRef CAS PubMed.
- L. L. Zhang and X. Zhao, Chem. Soc. Rev., 2009, 38(9), 2520–2531 RSC.
- L. Zhao, Y. S. Hu, H. Li, Z. Wang and L. Chen, Adv. Mater., 2011, 23(11), 1385–1388 CrossRef CAS.
- A. L. Ivanovskii, Russ. Chem. Rev., 2012, 81(7), 571–605 CrossRef.
- J. Chen, C. Li and G. Shi, J. Phys. Chem. Lett., 2013, 4(8), 1244–1253 CrossRef CAS PubMed.
- J. Mao, J. Iocozzia, J. Huang, K. Meng, Y. Lai and Z. Lin, Energy Environ. Sci., 2018, 11(4), 772–799 RSC.
- Y. Tang, Z. He, J. A. Mosseler and Y. Ni, Cellulose, 2014, 21(6), 4569–4581 CrossRef CAS.
- B. S. Dakshayini, K. R Reddy, A. Mishra, N. P. Shetti, S. J. Malode, S. Basu and A. V. Raghu, Microchem. J., 2019, 147, 7–24 CrossRef CAS.
- J. Zang, S. J. Bao, C. M. Li, H. Bian, X. Cui, Q. Bao, C. Q. Sun, J. Guo and K. Lian, J. Phys. Chem. C, 2008, 112, 14843–14847 CrossRef CAS.
- K. K. Purushothaman, B. Saravanakumar, I. M. Babu, B. Sethuraman and G. Muralidharan, RSC Adv., 2014, 4, 23485–23491 RSC.
- L. l. Jiang, X. Lu, C. M. Xie, G. J. Wan, H. p. Zhang and T. Youhong, J. Phys. Chem. C, 2015, 119, 3903–3910 CrossRef CAS.
- S. K. Meher and G. R. Rao, J. Phys. Chem. C, 2011, 115, 15646–15654 CrossRef CAS.
- J. Yan, Z. Fan, T. Wei, W. Qian, M. Zhang and F. Wei, Carbon, 2010, 48, 3825–3833 CrossRef CAS.
- X. Du, C. Wang, M. Chen, Y. Jiao and J. Wang, J. Phys. Chem. C, 2009, 113, 2643–2646 CrossRef CAS.
- S. Shanmugan, S. Gorjian, A. H. Elsheikh, F. A Essa, Z. M. Omara and A. V. Raghu, Energy Sources A: Recovery Util. Environ. Eff., 2020, 1–14 CAS.
- S. Wang and X. Wang, Electrochim. Acta, 2011, 56(9), 3338–3344 CrossRef CAS.
- M. Chen, H. Wang, L. Li, Z. Zhang, C. Wang, Y. Liu and J. Gao, ACS Appl. Mater. Interfaces, 2014, 6(16), 14327–14337 CrossRef CAS PubMed.
- M. Chen, H. Wang, L. Li, Z. Zhang, C. Wang, Y. Liu and J. Gao, ACS Appl. Mater. Interfaces, 2014, 6(16), 14327–14337 CrossRef CAS PubMed.
- S. Ramesh, H. M. Yadav, J. Y. Lee and G. W. Hong, Sci. Rep., 2019, 9(1), 1–10 Search PubMed.
- X. Du, T. Yang, J. Lin, T. Feng, J. Zhu, L. Lu and J. Wang, ACS Appl. Mater. Interfaces, 2016, 8(24), 15598–15606 CrossRef CAS.
- R. Prabhu, T. Jeevananda, K. R. Reddy and A. V. Raghu, Mater. Sci. Technol., 2021, 4, 107–112 CAS.
- R. Prabhu, B. Roopashree, T. Jeevananda, S. Rao, K. R. Reddy and A. V. Raghu, Mater. Sci. Technol., 2021, 4, 92–99 CAS.
- Q. Cheng, J. Tang, J. Ma, H. Zhang, N. Shinya and L. C. Qin, J. Phys. Chem. C, 2011, 115, 23584–23590 CrossRef CAS.
- M. H. Bai, T. Y. Liu, F. Luan, Y. Li and X. X. Liu, J. Mater. Chem. A, 2014, 2, 10882–10888 RSC.
- A. Laforgue, J. Power Sources, 2011, 196, 559–564 CrossRef CAS.
- S. A. El Khodary, I. S. Yahia, H. Y. Zahran and M. Ibrahim, Phys. B, 2019, 556, 66–74 CrossRef CAS.
- H. Vijeth, S. P. Ashokkumar, L. Yesappa, M. Vandana and H. Devendrappa, Electrochim. Acta, 2020, 13, 6651 Search PubMed.
- N. M. Shaalan, D. Hamad, A. Y. Abdel-Latief and M. A. Abdel-Rahim, Prog. Nat. Sci.: Mater. Int., 2016, 26(2), 145–151 CrossRef CAS.
- M. Akram, A. T. Saleh, W. A. W Ibrahim, A. S. Awan and R. Hussain, Ceram. Int., 2016, 42, 8613–8619 CrossRef CAS.
- D. P. Suhas, A. V. Raghu, H. M. Jeong and T. M. Aminabhavi, RSC Adv., 2013, 3(38), 17120–17130 RSC.
- D. P. Suhas, T. M. Aminabhavi, H. M. Jeong and A. V. Raghu, RSC Adv., 2015, 5(122), 100984–100995 RSC.
- E. T Selvi, S. M Sundar, P. Selvakumar and P. M. Ponnusamy, J. Mater. Sci.: Mater. Electron., 2017, 28, 7713–7723 CrossRef.
- H. Zhu, D. Yang, G. Yu, H. Zhang and K. A. Yao, Nanotechnology, 2006, 17, 2386 CrossRef CAS.
- H. Gu, C. Zhao, Y. Zhang and G. Shao, Nanotechnology, 2018, 29(38), 385401 CrossRef.
- B. Gupta, N. Kumar, K. Panda, V. Kanan, S. Joshi and I. Visoly-Fisher, Sci. Rep., 2017, 7(1), 1–14 CrossRef CAS.
- T. K. Vishnuvardhan, V. R. Kulkarni, C. Basavaraja and S. C. Raghavendra, Bull. Mater. Sci., 2006, 29(1), 77–83 CrossRef CAS.
- A. Das, V. Bonu, A. K. Prasad, D. Panda, S. Dhara and A. K. Tyagi, J. Mater. Chem., 2014, 2(1), 164–171 CAS.
- De. Lima, M. S. F. Costa, I. N. Bastos, J. M. Granjeiro and de. Almeida Soares, Mater. Res., 2002, 5(3), 1980–5373 Search PubMed.
- V. Bonu and A. Das, Mapan, 2013, 28(4), 259–262 CrossRef.
- S. Bose, T. Kuila, M. E. Uddin, N. H. Kim, K. T. Lau and J. H. Lee, Polymer, 2010, 51, 5921 CrossRef CAS.
- Y. Li, S. Zhu, Q. Liu, J. Gu, Z. Guo, Z. Chen, C. Feng, D. Zhang and W. J. Moon, J. Mater. Chem., 2012, 22, 2766 RSC.
- A. Guimin, N. Na, Z. Xinrong, M. Zhenjiang, M. Shiding, D. Kunlun and L. Zhimin, Nanotechnology, 2007, 18, 435707 CrossRef.
- D. Zhang, X. Zhang, Y. Chen, P. Yu, C. Wang and Y. Ma, J. Power Sources, 2011, 196, 5990 CrossRef CAS.
- Y. Bo, Y. Zhao, Z. Cai, A. Bahi, C. Liu and F. Ko, Cellulose, 2018, 25(7), 4079–4091 CrossRef CAS.
- M. Vandana, H. Vijeth, S. P. Ashokkumar and H. Devendrappa, Inorg. Chem. Commun., 2020, 117, 107941 CrossRef CAS.
- C. T. De Hsieh, W. Y. Lee, C. E. Lee and H. Teng, J. Phys. Chem., 2014, 118(28), 15146–15153 Search PubMed.
- A. Karimi, I. Kazeminezhad, L. Naderi and S. Shahrokhian, J. Phys. Chem., 2020, 124(8), 4393–4407 CAS.
- S. Kulandaivalu, N. Suhaimi and Y. Sulaiman, Sci. Rep., 2019, 9(1), 1–10 CAS.
- Y. Cheng, S. Lu, H. Zhang, C. V. Varanasi and J. Liu, Nano Lett., 2012, 12(8), 4206–4211 CrossRef CAS PubMed.
- X. Zhang, J. Wang, J. Liu, J. Wu, H. Chen and H. Bi, Carbon, 2017, 115, 134–146 CrossRef CAS.
- J. Cao, Y. Wang, J. Chen, X. Li, F. C. Walsh, J. H. Ouyang and Y. Zhou, J. Mater. Chem., 2015, 3, 14445–14457 RSC.
- A. Karimi, I. Kazeminezhad, L. Naderi and S. Shahrokhian, J. Phys. Chem. C, 2020, 124(8), 4393–4407 CrossRef CAS.
- M. Yan, Y. Yao, J. Wen, L. Long, M. Kong, G. Zhang and Z. Huang, ACS Appl. Mater. Interfaces, 2016, 8(37), 24525–24535 CrossRef CAS PubMed.
- J. Chen, Y. Wang, J. Cao, Y. Liu, Y. Zhou, J. H. Ouyang and D. Jia, ACS Appl. Mater. Interfaces, 2017, 9(23), 19831–19842 CrossRef CAS PubMed.
- K. Ghosh, C. Y. Yue, M. M. Sk and R. K. Jena, ACS Appl. Mater. Interfaces, 2017, 9(18), 15350–15363 CrossRef CAS PubMed.
- J. Lee, H. Jeong, R. Lassarote Lavall, A. Busnaina, Y. Kim, Y. J. Jung and H. Lee, ACS Appl. Mater. Interfaces, 2017, 9(38), 33203–33211 CrossRef CAS PubMed.
| This journal is © The Royal Society of Chemistry 2021 |

