 Open Access Article
Facile synthetic routes for photocatalytic Pb3(BTC)2·H2O coordination polymers†
Jinxiu Maa,
Zhijuan Fenga,
Jianyu Wei *b,
Feng Li
 *ac,
Taohai Li
 ac and
Dabin Zhangd
aCollege of Chemistry, Key Lab of Environment Friendly Chemistry and Application in Ministry of Education, Xiangtan University, Xiangtan, 411105, China. E-mail: fengli@xtu.edu.cn
bChina Tobacco Guangxi Industrial Co., Ltd, Nanning, Guangxi 530001, PR China. E-mail: jtx_wjy@163.com
cNano and Molecular Systems Research Unit, Faculty of Science, University of Oulu, P. O. Box 3000, FIN-90014, Finland
dSchool of Mechanical Engineering, Guizhou University, Guiyang, Guizhou 550025, China
First published on 22nd June 2021
Abstract
Herein, we report on the successful synthesis of photocatalytic Pb3(BTC)2·H2O polymers via different methods including the surfactant-assisted hydrothermal method, ultrasonic method and reflux method. As the crystal growth is subjected to preparation atmosphere, changes in reaction conditions do not alter the crystal structures of products, but vary their morphology. High ultraviolet-light-driven photocatalytic abilities are attributed to the stable Pb3(BTC)2·H2O, and the effective productions of h+ and ˙OH on the catalysts.
Introduction
Efficient removal of organic pollutants from wastewater has become an important subject due to its ecological and environmental importances.1–3 Traditional water treatment methods such as adsorption, coagulation, and membrane separation are costly and accompanied by secondary pollutants.4 It has been reported that semiconductor photocatalysts such as TiO2, ZnO, Fe2O3, CdS, GaP and ZnS can effectively degrade a wide range of organic pollutants.5–11 However, difficult post-separation, easy agglomeration, and low solar energy conversion efficiency of these inorganic catalysts limit their large-scale applications. To overcome these drawbacks, much attention has been paid to new types of photocatalysts. In the past two decades, metal–organic frameworks (MOFs) have been intensively studied due to their unusual properties and their high potential as a new class of crystalline porous materials.12–14 For example, Fan et al.15 assembled two Cd(II) CPs with excellent chemical stability by a mixed ligand strategy to detect Cr(VI) anions, DCN pesticides, and NFT antibiotics in water. Zhao et al.16 reported an exceptionally stable luminescent cadmium(II) metal–organic framework as a dual-functional chemosensor for detecting Cr(VI) anions and nitro-containing antibiotics in aqueous media. Cheng et al.17 prepared nanostructures of three new cobalt(II) complexes by a sonochemical process. MOFs typically consist of central metal ions surrounded by organic modes. Recent research also showed that these materials, acting as catalysts, may lead to photocatalytic degradation of organic pollutants.18–24The Pb(II) cation is an important player in MOFs and polynuclear complexes, which display interesting structural features as a result of the large radius, adoption of different coordination numbers and the possible occurrence of a stereochemically active lone pair of electrons.25 For example, Pb3(BTC)2·H2O (BTC = 1,3,5-benzenetricarboxylate) contains 2 different BTC trianions, 3 different Pb cations and 3 different carboxylate coordination modes. Though the first success was reported in 2000 by a dedicated hydrothermal method,26 its properties are far less than understood. In addition, considering the energies and environments required, it is extremely difficult to use a hydrothermal/solvothermal approach for the large-scale preparation of MOFs in industries. Therefore, new facile and large-scale preparation methods are desired.
In this work, Pb3(BTC)2·H2O was fabricated by different synthesis methods including the hydrothermal method, ultrasonic method and reflux method. The morphology, crystal structure, and thermal stability are extensively studied, and the influences of preparation conditions on the photocatalytic properties are discussed. The results indicate that Pb3(BTC)2·H2O is a potential functional material.
Experimental
Materials
Pb(OAc)·3H2O, 1,3,5-benzene tricarboxylic acid (H3BTC), and anhydrous ethanol were purchased from commercial suppliers and used without further purification.Hydrothermal synthesis of Pb3(BTC)2·H2O
The synthesis was carried out via a route reported in the published literature.26 Colourless crystals were obtained by centrifugation, washed several times with ethanol and water, and dried in air at room temperature for characterization.Synthesis of Pb3(BTC)2·H2O at ambient pressure under ultrasonic irradiation
A solution was obtained by dissolving 0.5 g (2.38 mmol) H3BTC in 25 mL ethanol under stirring, and named solution A. Solution B was prepared by dissolving 1.355 g (3.57 mmol) Pb(OAc)·3H2O in 25 mL deionized water under stirring. Later, solution A was added into solution B under vigorous stirring at room temperature and a large amount of white precipitate occurred immediately. The mixture was exposed to ultrasonic irradiation for 30 min.27,28 The ultrasound supply energies for particle dispersion and creation of ultrasonic cavitation.29 Finally, the precipitate was obtained by centrifugation, washed several times with ethanol and water, and dried in air at room temperature for characterization.Synthesis of Pb3(BTC)2·H2O at ambient pressure under reflux
Similar to the ultrasonic synthesis, a white precipitate was first obtained and then heated under reflux for 24 h. Finally, the precipitate was obtained by centrifugation, washed several times with ethanol and water, and dried in air at room temperature for characterization.Synthesis of Pb3(BTC)2·H2O with different surfactants
First, 0.1 g (0.476 mmol) of H3BTC and 0.271 g (0.714 mmol) of Pb(OAc)·3H2O were put into a beaker. Then, 10 mL of H2O was added into the beaker and stirred for 10 min to produce a white precipitate. Following this, 0.05 g of a different surfactant (CTAB, SDBS, and PEG-1000) was added. After stirring for another 30 min, the mixed solution was transferred to a Teflon-lined stainless steel hydrothermal reaction vessel. The reaction kettle was kept at 180 °C for 2 hours and then naturally cooled down to room temperature. Finally, the precipitate was obtained by centrifugation, washed several times with ethanol and water, and dried in air at room temperature for characterization.Characterization
The composition and crystal structure of products were determined by powder XRD measurements using a MiniFlex II diffractometer (continuous, 30 kV, 15 mA, increment = 0.02°). The surface morphology and chemical composition of products were characterized using a scanning electron microscope (SEM, JSM-6490-LV) equipped with an energy-dispersive X-ray spectrometer (EDS). FTIR spectra were recorded using a Fourier transform spectrometer (Nicolet 6700) in the region of 4000–500 cm−1. Thermogravimetric analysis (TGA) was performed in nitrogen atmosphere at a scan state of 20 °C min−1 from 50 °C to 600 °C using a Shimadzu TGA-50 thermogravimetric analyser.Photocatalytic activity investigation
Photocatalytic activities of as-prepared Pb3(BTC)2·H2O were evaluated by the degradation of rhodamine B (RhB) and methylene blue (MB) aqueous solution (the initial concentration is 5 mg L−1) under UV light irradiation. A 300 W high-pressure mercury lamp was employed as the light source. The distance between the sample and lamp was 10 cm. As for photocatalysis, 50 mg Pb3(BTC)2·H2O was added into 100 mL RhB and MB aqueous solution. Before irradiation, all samples were immersed in a dye solution and kept in the darkness for 30 min to ensure an adsorption/desorption equilibrium. Afterwards, 3 mL of the solution was taken at given time intervals (20 min) and separated by centrifugation. The changes in the dye's absorption spectra were recorded by measuring the maximal absorption using a UV-Vis spectrophotometer (Cary 100, Agilent).Results and discussion
Characterization and photocatalytic performance of products synthesized by different methods
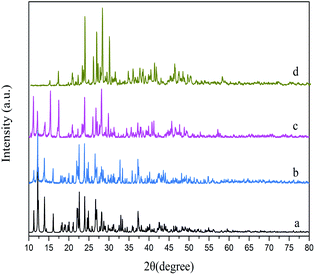
The products prepared by a hydrothermal method, ultrasonic method and reflux method were respectively named HT, US and RF. The XRD patterns of the as-synthesized samples are shown in Fig. 1. No significant difference in the degree of crystallinity is found within these samples. The diffraction peaks of the as-synthesized samples are in agreement with the simulated one generated on the basis of the crystal structure data obtained from the previous literature.26 It is worth noting that the diffraction peaks at low angles of samples prepared under reflux disappeared, which is due to the preferred orientation of crystal growth.The EDS spectra of sample HT (Fig. S1a†) reveal that the samples are composed of C, O and Pb. There are no other impurity elements, which further proves the high purity of as-synthesized Pb3(BTC)2·H2O.
The FTIR spectra of the sample HT is presented in Fig. S1b.† The absorption bands at 756 cm−1 and 711 cm−1 are assigned to the C–H plane bending vibration of the benzene ring. The absorption band at 1516 cm−1 can be considered as a skeleton stretching vibration peak of the benzene ring. The asymmetric stretching frequencies (νas) for the carboxylate group are centred at 1607 cm−1, whereas the symmetric carboxylate stretching frequencies (νs) stay at 1434 cm−1 and 1341 cm−1. The difference in the stretching frequencies (Δν = νas − νs) is 173 cm−1 and 266 cm−1, which demonstrates the monodentate and chelating bidentate coordination modes of the carboxylate groups.30
The thermal stability was studied by TGA (Fig. S1c†). Two weight losses were found. The first one is 30% between 30 °C and 450 °C, in accordance with the loss of water molecules. The dehydrated framework is thermally stable below a temperature of 700 °C and decomposes upon further increase in temperature. The TGA curve indicates that the complexes have good thermal stability.
In order to further study the structure of products, product surface area and pore size distribution were determined. As shown in Table 1, the surface areas of were 2.3601 m2 g−1, 1.6122 m2 g−1, and 1.4541 m2 g−1 for samples prepared by a hydrothermal method, ultrasonic method, and reflux method. The average pore sizes of the products obtained by different synthetic methods are between 2 and 50 nm, indicating that the products belong to mesoporous materials. The mesoporous structure can provide an effective transfer path for chemical reactants and products and help to improve the photocatalytic activity. Additionally, a larger surface area will be more favorable for the absorption of organic pollutants, thereby enhancing the photocatalytic activity.
| Sample | Surface area (m2 g−1) | Pore volume (cm3 g−1) | Pore volume (cm3 g−1) |
|---|---|---|---|
| HT | 2.3601 | 0.000306 | 17.6101 |
| US | 1.6122 | 0.001627 | 13.5476 |
| RF | 1.4541 | 0.001785 | 11.9353 |
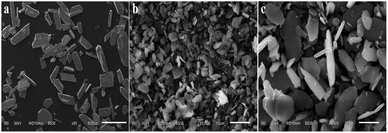
The morphologies of samples prepared by different synthetic methods are presented in Fig. 2. Fig. 2a shows the morphology of sample HT, which presents arrow-shaped lamellar structures. Compared with the sample prepared by the hydrothermal method, the size of the sample prepared by the ultrasonic method and reflux method was reduced to micron level. As shown in Fig. 2b and c, the sample US and sample RF exhibit a lamellar morphology with the average length of 5 μm and 10 μm, respectively. In addition, some spindle structures can be observed in Fig. 2c. The morphology and size of the product depend on environmental factors such as solvent, temperature, stirring, solution concentration and dispersion. Indeed, these morphologies bear the trace of crystal growth. Typically, particles produced via wet chemistry undergo two separate processes of nucleation and growth.31,32 In the ultrasonic synthesis, the “ultrasonic cavitation phenomenon” will lead to instantaneous explosion of cavitation, and produce a local high temperature and high pressure environment. These steps can reduce the interfacial tension, promoting the nucleation in solution. Under the condition of reflux reaction, solute molecules move faster due to the high reaction temperature, which increases the collision frequency, promoting the instantaneous nucleation and avoiding the abnormal growth of grain in the process of synthesis.
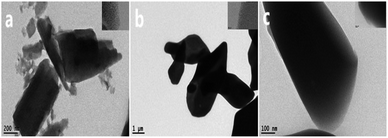
The samples of Pb3(BTC)2·H2O obtained by different synthetic methods were characterized by TEM to observe the microstructure. As can be seen from Fig. 3, the product morphology is a tabular structure, which is consistent with the SEM image. The upper right corner of the illustration is the enlarged TEM diagram from which the observed lamellar particles are self-assembled by a number of nanospheres.
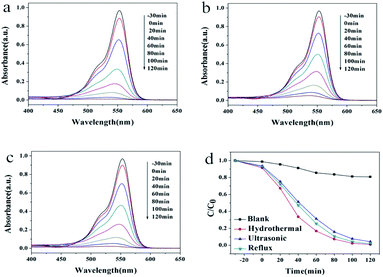
Photocatalytic activities of the as-prepared samples were evaluated by the degradation of the typical organic contaminants rhodamine B (RhB) and methylene blue (MB) aqueous solution under UV light irradiation (Fig. 4 and 5). As shown in Fig. 4a–c, the maximum absorption peak of RhB appears at 553 nm, which decreased gradually with the irradiation time. The degradation speed of the RhB solution on the HT is slightly faster than the other two kinds of samples. The degradation rate was estimated from a formula of η = [(C0 − C)/C0] × 100%, where C0 is the initial concentration of MB and C is the concentration at the irradiation time t. Fig. 4d exhibits the performance of RhB degradation as a function of time under different conditions. As shown in Fig. 4d, after two hours, the photodegradation efficiency of RhB was 19% in the absence of the photocatalyst. When sample HT, US or RF was added into the RhB aqueous solution, the photodegradation efficiencies of RhB were 99%, 94% and 98%, respectively.
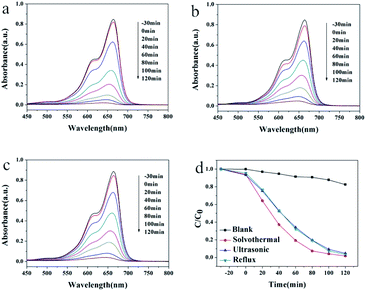
Similarly, the maximum absorption peak of MB appears at 664 nm, which decreased gradually with the irradiation time (Fig. 5a–c). The degradation speed of MB solution in the presence of HT is slightly faster than that of the other two kinds of samples. The degradation rates were also calculated. As shown in Fig. 5d, the photodegradation efficiencies of RhB was 17% after two hours without any photocatalyst. The rate turns to 98%, 95% and 97% for HT, UT and RF catalysts. The photocatalytic results indicated that Pb3(BTC)2·H2O showed excellent photocatalytic degradation activity for rhodamine B (RHB) and methylene blue (MB) as other MOF materials.33,34
The highest catalytic efficiency of the HT sample may be related to the increase in the size of the crystallites of the hydrothermal synthesis method. It may also be due to the degree of defects produced during the hydrothermal process, as photocatalytic activity related to the diffusion of vacancies increases the density of oxygen vacancies on the surface of the catalyst. Thus, the existence of surface defects can greatly influence the efficiency of e−/h+ separation, low recombination, and the corresponding photocatalytic activity.
Characterization and photocatalytic performance of products synthesized using different surfactants
In the hydrothermal synthesis, we further prepared samples without any surfactant, with cationic surfactant (CTAB), anionic surfactant (SDBS), or non-ionic surfactant (PEG 1000), yielding samples of HT (abbreviation for hydrothermal), HT-CTAB, HT-SDBS, and HT-PEG 1000. Fig. 6 shows the XRD patterns of the samples obtained without adding and adding different surfactants, along with the standard spectrum obtained from the simulation of the single crystal structure obtained from the literature in (a). Fig. 6b shows the XRD pattern of the sample HT and c, d, and e show the pattern of the samples HT-CTAB, HT-SDBS and HT-PEG 1000, respectively. It can be seen that the surfactant has little effects on the diffraction peak intensity and crystallinity of the product features. The diffraction peaks under the four reaction conditions are consistent with the peaks of the standard spectrum simulated by the crystal data.26 The crystal structure is identical for all the hydrothermal samples with different surfactants.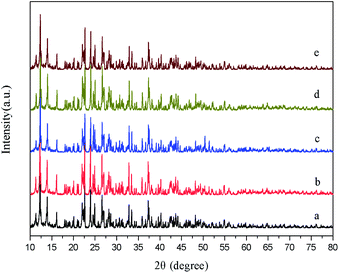 | ||
| Fig. 6 XRD patterns of (a) simulated Pb3(BTC)2·H2O, (b) HT, (c) HT-CTAB, (d) HT-SDBS, and (e) HT-PEG 1000. | ||
However, the sample morphology differs. Fig. 7 shows the SEM images of these Pb3(BTC)2·H2O prepared with surfactants. The morphology of the product is a flaky structure with arrows at both ends (see red circle in Fig. 7a). Many incomplete fragments of the product morphology are observed, attributed to the product breaking during processing. In addition, there may be defects in crystal growth that result in incomplete crystals. When the CTAB was added, the sheet structure becomes thinner and longer as shown in Fig. 7b. The product morphology became irregular in the presence of SDBS in preparation (Fig. 7c) but not with PEG-1000 (Fig. 7d).
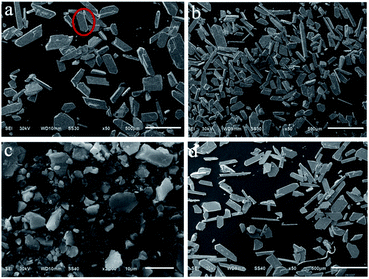 | ||
| Fig. 7 SEM images of samples prepared by different synthetic methods: (a) HT; (b) HT-CTAB; (c) HT-SDBS; and (d) HT-PEG 1000. | ||
From the above studies, it can be seen that the addition of surfactants has little effect on the product phase, but can regulate the morphology of the product. Since the morphology of the crystal is related to its growth environment, the crystal growth process is anisotropic growth of the crystal surface. The functional group on the surfactant selectively adsorbs to different crystal planes, which results in different generation rates of different crystal planes, and ultimately results in the formation of different morphologies.35 In addition, the effect of the soft template of the surfactant in the solution also affects the morphology of the product.36
The photocatalytic abilities of samples prepared with surfactants are also studied. The UV-Vis spectra of the RhB solution are depicted in Fig. 8 for samples synthesized without and with different surfactants. Under UV light irradiation, the absorbance of the RhB solution at 553 nm decreases rapidly with time, indicating the continuous decrease in the RhB concentration. Moreover, no impurity peaks were found during the degradation process, which shows that no new substances are generated during the degradation process. From the final degradation effect, the photocatalytic activity of the four hydrothermal products showed little difference. The rate of catalyzed degradation of RhB by the sample HT is slightly faster, while the rate of degradation by HT-CTAB is slightly slower. All the RhB solutions were completely degraded after 2 hours of light irradiation. Similar results are also found in the degradation of the MB dyes. In Fig. 9, almost all of the RhB solutions were completely degraded after 2 hours of light irradiation.
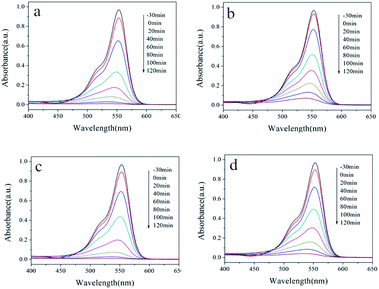 | ||
| Fig. 8 UV-Vis absorption spectra of the RhB solution at different time points with (a) HT, (b) HT-CTAB, (c) HT-SDBS, and (d) HT-PEG 1000. | ||
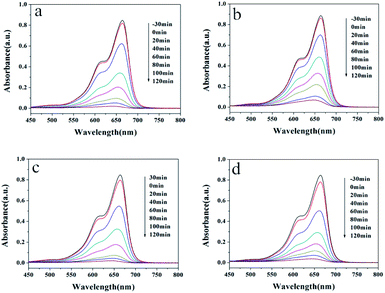 | ||
| Fig. 9 UV-Vis absorption spectra of the MB solution at different time points with (a) HT, (b) HT-CTAB, (c) HT-SDBS, and (d) HT-PEG 1000. | ||
The UV-Vis absorption edge has an affinity with the energy band of the catalyst. Therefore, it is necessary to study the optical properties of the heterojunctions. Fig. 10 presents the UV-Vis diffuse reflectance spectra of samples prepared by different synthetic methods. Located at 300–325 nm, the stronger absorption peak of HT denotes a better photoabsorption and poses better photocatalytic degradation ability. The absorption edges of HT, US, and RF were determined to be 350 nm, 337 nm and 325 nm, corresponding to bandgaps of 3.54 eV, 3.68 eV and 3.82 eV, respectively. The UV-Vis diffuse reflectance spectra of samples prepared by different surfactants are shown in Fig. S2.† The absorption edges of HT-CTAB, HT-SDBS, and HT-PEG 1000 were determined to be 339 nm, 350 nm and 345 nm, corresponding to bandgaps of 3.66 eV, 3.54 eV and 3.60 eV, respectively. Thus, the HT owns the smallest bandgap and can absorb the widest spectrum for the highest photocatalytic activity. This is consistent with the experimental results.
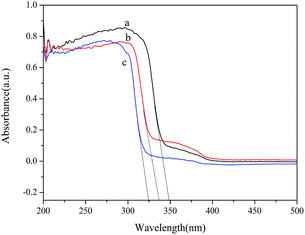 | ||
| Fig. 10 UV-Vis diffuse reflectance spectra of samples prepared by different synthetic methods: (a) HT; (b) US; and (c) RF. | ||
For the photocatalytic degradation process, active species of optical cavity (h+) and hydroxyl radicals (˙OH) play a key role. In order to explore the main active species in photocatalytic degradation process, various radical scavengers were introduced to react with active species for evaluating their contribution to the photodegradation of RhB by the change in degradation efficiency. In this work, isopropanol and ethanol were adopted for scavenging ˙OH,37,38 and EDTA-Na2 was adopted as a h+ scavenger.39,40 The above-mentioned radical scavengers were added to the RhB aqueous solution together with sample HT before irradiation. The photocatalytic degradation curves of RhB with various scavengers are shown in Fig. 11.
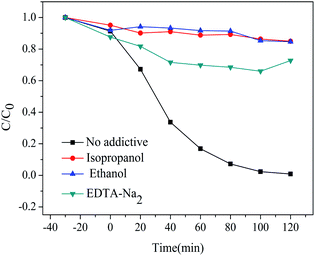 | ||
| Fig. 11 Degradation of RhB in the presence of different radical scavengers under UV light irradiation. | ||
Without any scavenger, the degradation rate of RhB was 99% after irradiation for 2 h. When adding EDTA-Na2, the photocatalytic degradation rate of RhB solution reduced to 27%, showing that h+ has played a much important role in the photocatalytic process. When isopropanol and ethanol were added, the photocatalytic degradation rate of the RhB solution reduced to 15%, indicating that ˙OH was also important in the photocatalytic process. To prove this, we performed an electron paramagnetic resonance (EPR) technique on the HT samples. As shown in Fig. S4,† after seven minutes of light, a strong EPR signal peak of ˙OH was found compared to the darkness, suggesting that the sample could produce a large amount of ˙OH radicals under simulated ultraviolet conditions. In conclusion, ˙OH and h+ are the main active species for the degradation of RhB under UV light irradiation.
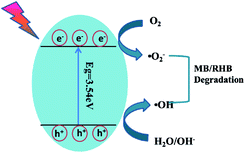
Based on the above-mentioned experimental results, a possible mechanism for the degradation of organic dyes by Pb3(BTC)2·H2O was proposed. As shown in Fig. 12, under the irradiation of ultraviolet light, photogenerated electrons transition from the valence band to the conduction band, thus forming positively charged holes and negatively charged electrons on the surface of Pb3(BTC)2·H2O. Due to the generation of positive holes and negative electrons, redox reactions occur at the surface of semiconductors. Negatively charged electrons can interact with the oxygen on the surface of Pb3(BTC)2·H2O, generating reactive oxygen species including superoxide and elemental oxygen. The presence of superoxide and elemental oxygen as an electron scavenger extends the recombination of electron–hole pairs and forms superoxide radicals (˙O2−). The reaction of the valence band hole (h+) with water molecules may lead to the formation of hydroxyl radicals (˙OH) attached on the surface of Pb3(BTC)2·H2O. The hydroxyl radical is an extremely strong, non-selective oxidant, which leads to the partial or complete mineralization of organics. Reactive oxides such as superoxide and elemental oxygen can mineralize organic pollutants into CO2 and H2O.
In practice, catalyst recovery and recycling has vital significance. As shown in Fig. 13, after five cycles of photocatalysis reactions, the sample is capable of degrading RhB and MB dyes up to 90% and 90%. This indicates that the Pb3(BTC)2·H2O photocatalyst remains stable under intensive UV irradiation. Furthermore, a comparison of PXRD analysis of the fresh sample and after 5 recycling runs of HT was carried out, as shown in Fig. S3.† In the XRD spectra, the positions and the intensity of these three samples show no significant changes, indicating that there is no transformation of the crystal structures and the phases of these three samples, which indicates that the HT photocatalyst has an ideal physical and chemical stability.
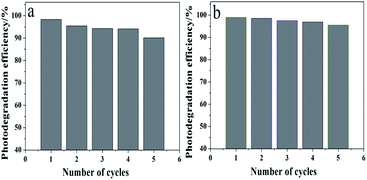 | ||
| Fig. 13 Repeated cycles of UV-induced photocatalytic degradation of using the Pb3(BTC)2·H2O photocatalyst: (a) RhB and (b) MB. | ||
Conclusion
In summary, a photocatalytic Pb3(BTC)2·H2O coordination MOF has been successfully fabricated by different facile methods in the presence of different surfactants. The preparation condition does not change the sample microstructure, but varies its morphology. A similar variation is also found when altering the surfactants. Photocatalytic experiments showed that the photocatalytic activity of the sample prepared by a hydrothermal method was slightly better than that of the samples prepared by ultrasonic and reflux methods, and the surfactant has little effect on the photocatalytic activity of the product. This is attributed to a lower bandgap and higher photo absorbance. The catalytic mechanism was also studied in scavenger tests. It was found that both ˙OH and h+ are the main active species during photodegradation. Besides providing the synthetic routes of a MOF photocatalyst and photocatalytic mechanism, the work is hoped to accelerate large-scale production of cheap catalysts that can be eventually used in water treatment.Conflicts of interest
There are no conflicts to declare.Acknowledgements
The authors acknowledge with thanks the financial support of the National Natural Science Foundation of China (51965009) and Hunan 2011 Collaborative Innovation Center of Chemical Engineering & Technology with Environmental Benignity and Effective Resource Utilization and Science and Technology Plan Project of Guizhou Province: [2019]5616.Notes and references
- T. Ochiai and A. Fujishima, J. Photochem. Photobiol., C, 2012, 13, 247–262 CrossRef CAS.
- H. Park, Y. Park, W. Kim and W. Choi, J. Photochem. Photobiol., C, 2013, 15, 1–20 CrossRef CAS.
- S. Baruah, M. Jaisai and J. Dutta, Catal. Sci. Technol., 2012, 2, 918–921 RSC.
- M. I. Litter, Appl. Catal., B, 1999, 23, 89–114 CrossRef CAS.
- G. Li, Z. Wang, M. Yu, Z. Quan and J. Lin, J. Solid State Chem., 2006, 179, 2698–2706 CrossRef CAS.
- G. Li, M. Yu, Z. Wang, J. Lin, R. Wang and J. Fang, J. Nanosci. Nanotechnol., 2006, 6, 1416–1422 CrossRef CAS PubMed.
- J. Lu, J.-X. Lin, X.-L. Zhao and R. Cao, Chem. Commun., 2012, 48, 669–671 RSC.
- M. R. Hoffmann, S. T. Martin, W. Choi and D. W. Bahnemann, Chem. Rev., 1995, 95, 69–96 CrossRef CAS.
- T. L. Thompson and J. T. Yates, Chem. Rev., 2006, 106, 4428–4453 CrossRef CAS PubMed.
- A. Mills and S. Le Hunte, J. Photochem. Photobiol., A, 1997, 108, 1–35 CrossRef CAS; M. Yu, Z. Wang, J. Lin, R. Wang and J. Fang, J. Nanosci. Nanotechnol., 2006, 6, 1416–1422 CrossRef PubMed.
- K. Ayoub, E. D. van Hullebusch, M. Cassir and A. Bermond, J. Hazard. Mater., 2010, 178, 10–28 CrossRef CAS PubMed.
- E. Biemmi, A. Darga, N. Stock and T. Bein, Microporous Mesoporous Mater., 2008, 114, 380–386 CrossRef CAS.
- J. L. C. Rowsell and O. M. Yaghi, Microporous Mesoporous Mater., 2004, 73, 3–14 CrossRef CAS.
- H. Furukawa, K. E. Cordova, M. O'Keeffe and O. M. Yaghi, Science, 2013, 341, 974 CrossRef CAS PubMed.
- L. M. Fan, F. Wang, D. S. Zhao and X. H. Sun, et al., Spectrochim. Acta, Part A, 2020, 239, 118467 CrossRef CAS PubMed.
- L. Fan, D. Zhao and B. Li, et al., CrystEngComm, 2021, 23, 1218–1225 RSC.
- X. X. Cheng, S. Hojaghani and M. L. Hu, et al., Ultrason. Sonochem., 2017, 37, 614–622 CrossRef CAS PubMed.
- C. G. Silva, A. Corma and H. Garćıa, J. Mater. Chem., 2010, 20, 3141–3156 RSC.
- F. X. Llabŕes i Xamena, A. Corma and H. Garcia, J. Phys. Chem. C, 2007, 111, 80–85 CrossRef.
- P. Mahata, G. Madras and S. Natarajan, J. Phys. Chem. B, 2006, 110, 13759–13768 CrossRef CAS PubMed.
- J. Gascon, M. D. Herńandez-Alonso, A. R. Almeida, G. P. Van Klink, F. Kapteijn and G. Mul, ChemSusChem, 2008, 1, 981–983 CrossRef CAS PubMed.
- S. Bordiga, C. Lamberti, G. Ricchiardi, L. Regli, F. Bonino, A. Damin, K.-P. Lillerud, M. Bjorgen and A. Zecchina, Chem. Commun., 2004, 2300–2301 RSC.
- Z. Ying, D. S. Deng and L. F. Ma, et al., Chem. Commun., 2013, 49, 10299–10301 RSC.
- J. Wang, L. Zhou and C. Rao, et al., Dyes Pigm., 2021, 190, 109285 CrossRef CAS.
- J. Parr, Polyhedron, 1997, 16, 551 CrossRef CAS.
- M. R. Foreman, T. Gelbrich, M. B. Hursthouse and M. J. Plater, Inorg. Chem. Commun., 2000, 3(5), 255–258 CrossRef.
- W. Yang, J. Feng and H. Zhang, J. Mater. Chem., 2012, 22, 6819 RSC.
- K. Liu, H. P. You, G. Jia, Y. H. Zheng, Y. J. Huang, Y. H. Song, M. Yang, L. H. Zhang and H. J. Zhang, Cryst. Growth Des., 2010, 10, 790–797 CrossRef CAS.
- X. Shi, S. Posyaev, M. Huttla and V. Pankratov, et al., Small, 2018, 14, 1704526 CrossRef PubMed.
- D. Dipankar, R. Subhadip, R. N. D. Purkayastha, P. Raghavaiah and M. Patrick, J. Mol. Struct., 2013, 1053, 127–133 CrossRef.
- J. Park, V. Privman, J. Park and E. Matijevic, J. Phys. Chem. B, 2001, 11630–11635 CrossRef CAS.
- W. Cao, V. Pankratov, M. Huttula, X. Shi, S. Saukko, Z. Huang and M. Zhang, Mater. Chem. Phys., 2015, 158, 89–95 CrossRef CAS.
- K.-G. Liu and F. Rouhani, et al., Catal. Sci. Technol., 2020, 10, 757–767 RSC.
- J. Q. Liu and P. Ying, et al., CrystEngComm, 2019, 21, 4578–4585 RSC.
- R. Liu, F. Liu and Y. Su, et al., Langmuir, 2015, 31(8), 2502–2510 CrossRef PubMed.
- Y. Xia, P. Yang and Y. Sun, et al., Adv. Mater., 2003, 15(5), 353–389 CrossRef CAS.
- L. S. Zhang, K. H. Wong and H. Y. Yip, et al., Environ. Sci. Technol., 2010, 44(4), 1392–1398 CrossRef CAS PubMed.
- R. Palominos, J. Freer and M. A. Mondaca, et al., J. Photochem. Photobiol., A, 2008, 193(2), 139–145 CrossRef CAS.
- Y. Li, J. Wang and H. Yao, et al., J. Mol. Catal. A: Chem., 2011, 334(1), 116–122 CrossRef CAS.
- T. An, J. An and H. Yang, et al., J. Hazard. Mater., 2011, 197, 229–236 CrossRef CAS PubMed.
Footnote |
| † Electronic supplementary information (ESI) available. See DOI: 10.1039/d1ra03346h |
| This journal is © The Royal Society of Chemistry 2021 |

