 Open Access Article
A novel one-step synthesis of Ce/Mn/Fe mixed metal oxide nanocomposites for oxidative removal of hydrogen sulfide at room temperature†
Nishesh Kumar Guptaab,
Jiyeol Bae *ab and
Kwang Soo Kim
 ab
ab
aUniversity of Science and Technology (UST), Daejeon, Republic of Korea
bDepartment of Land, Water, and Environment Research, Korea Institute of Civil Engineering and Building Technology (KICT), Goyang, Republic of Korea. E-mail: baejiyeol@kict.re.kr
First published on 5th August 2021
Abstract
In this study, CeO2/Fe2O3, CeO2/Mn2O3, and CeO2/Mn2O3/Fe2O3 nanocomposites were synthesized by the calcination of molten salt solutions. The microscopic images confirmed polyhedral nanocrystals of 10–20 nm size, clustered to form nanospheres. The elemental mapping confirmed the uniform distribution of transition metal oxides in the CeO2 matrix. The X-ray diffraction analysis confirmed the phase purity of metal oxides in nanocomposites. The surface area of nanocomposites was in the range of 16–21 m2 g−1. X-ray photoelectron spectroscopy confirmed 25–28% of Ce3+ ions in the CeO2 of nanocomposites. These nanocomposites were tested for the removal of hydrogen sulfide gas at room temperature. The maximum adsorption capacity of 28.3 mg g−1 was recorded for CeO2/Mn2O3/Fe2O3 with 500 ppm of H2S gas and 0.2 L min−1 of flow rate. The adsorption mechanism probed by X-ray photoelectron spectroscopy showed the presence of sulfate as the only species formed from the oxidation of H2S, which was further confirmed by ion chromatography. Thus, the study reports room-temperature oxidation of H2S over mixed metal composites, which were synthesized by a novel one-step approach.
1. Introduction
Hydrogen sulfide (H2S) is a toxic malodorous gas released from various anthropogenic and natural activities. The energy sector is one of the largest sources of H2S emission due to its presence in natural gas, tail gas, biogas, and transportation gases like diesel and jet fuels.1 The H2S removal is required for clean burning of fuel and prevention of transport pipelines from corrosion and catalysts from poisoning in the gas reforming processes.1,2 H2S emitted from these sources are oxidized to SO2, which further reacts to form acid rain.3 Thus, the removal of H2S from sources should be prioritized in the interest of human health and the environment. Adsorption and thermal oxidation approaches are simpler, economical, and environmentally benign methods for the adsorptive/catalytic removal of H2S from waste gas streams. For adsorptive removal of H2S, porous adsorbents like activated carbon,4 modified silica,5 zeolites,6 and metal–organic frameworks7,8 have been reported as efficient materials for the purpose. On the same note, metal oxides could be used as adsorbents at low temperatures and thermal catalysts at elevated temperatures.9Numerous metal oxides as single-phase and composites of Cu, Zn, Mn, Co, Fe, Ni, Ce, Zr, V, and Ti have been studied as thermal catalysts for the oxidative removal of H2S at elevated temperatures.9–11 Cerium oxide (CeO2) is used for different catalytic processes as it has abundant oxygen vacancies and redox properties. Also, CeO2 is excellent support for transition metal oxides due to superior metal–support interactions.12,13 More often, CeO2/transition metal oxide composites are used for the catalytic removal of H2S at elevated temperatures.14,15 The same active sites in these metal oxides have been used for H2S sensing at low temperatures.16 Thus, it can be safely assumed that these metal oxide composites could be suitable for the catalytic oxidation of H2S at low temperatures or even at room temperature.
Though room temperature H2S oxidation studies on CeO2 or CeO2-based composites are scarce, several reports on H2S sensing over these materials are available in the literature.16,17 Many of the transition metal oxides show excellent H2S adsorptive/oxidative behaviour at room temperature.18 Our previous work on the H2S removal using Mn2O3/Fe2O3 have demonstrated that even these transition metals could effectively oxidize H2S to elemental sulfur and sulfates at room temperature.19 It is interesting to explore CeO2/transition metal oxides (Mn2O3 and Fe2O3) as nanocomposites for the room temperature removal of H2S.
In this work, we have developed nanocomposites of CeO2 with Mn2O3 and Fe2O3 by the calcination of molten salt solutions in the air. The synthesized nanocomposites were characterized by various microscopic and spectroscopic techniques. Furthermore, the synthesized nanocomposites were tested for the removal of H2S in ambient conditions. The adsorption mechanism was probed by energy-dispersive X-ray spectroscopy (EDAX), powder X-ray diffraction (PXRD), and X-ray photoelectron spectroscopy (XPS).
2. Materials and methods
2.1. Chemicals
Cerium(III) nitrate hexahydrate (Ce(NO3)3·6H2O, purity 98.0%), manganese(II) nitrate tetrahydrate (Mn(NO3)2·4H2O, purity >97.0%), and iron(III) nitrate nonahydrate (Fe(NO3)3·9H2O, purity 98.5%) were procured from Sigma Aldrich, Germany. H2S gas (500 ppm balanced with N2 gas) was purchased from Union Gas, Korea.2.2. Synthesis of adsorbents
The mixed metal oxides were prepared by the calcination of molten salt solutions in the air. In a typical synthesis process, nitrate salts of Ce, Mn, and Fe (3![[thin space (1/6-em)]](https://www.rsc.org/images/entities/char_2009.gif) :
:![[thin space (1/6-em)]](https://www.rsc.org/images/entities/char_2009.gif) 1
1![[thin space (1/6-em)]](https://www.rsc.org/images/entities/char_2009.gif) :
:![[thin space (1/6-em)]](https://www.rsc.org/images/entities/char_2009.gif) 1 molar ratio) were mixed in an alumina crucible. The salt mixture was placed in a hot air oven at 70 °C for 24 h to yield a molten salt solution. The molten salt solution was calcined at 700 °C for 24 h to get the desired product. The finely grounded product was named CeMnFe. Likewise, CeMn and CeFe were synthesized by taking Ce
1 molar ratio) were mixed in an alumina crucible. The salt mixture was placed in a hot air oven at 70 °C for 24 h to yield a molten salt solution. The molten salt solution was calcined at 700 °C for 24 h to get the desired product. The finely grounded product was named CeMnFe. Likewise, CeMn and CeFe were synthesized by taking Ce![[thin space (1/6-em)]](https://www.rsc.org/images/entities/char_2009.gif) :
:![[thin space (1/6-em)]](https://www.rsc.org/images/entities/char_2009.gif) Mn and Ce
Mn and Ce![[thin space (1/6-em)]](https://www.rsc.org/images/entities/char_2009.gif) :
:![[thin space (1/6-em)]](https://www.rsc.org/images/entities/char_2009.gif) Fe in a 3
Fe in a 3![[thin space (1/6-em)]](https://www.rsc.org/images/entities/char_2009.gif) :
:![[thin space (1/6-em)]](https://www.rsc.org/images/entities/char_2009.gif) 1 molar ratio. Fe2O3, Mn2O3, and CeO2 were synthesized using the same protocol from their respective nitrate salts.
1 molar ratio. Fe2O3, Mn2O3, and CeO2 were synthesized using the same protocol from their respective nitrate salts.
2.3. Analytical instruments
The scanning electron microscopy (SEM) images were recorded on a Hitachi S-4300 microscope after coating the samples with a gold–platinum alloy by ion-sputtering (E-1048 Hitachi ion sputter). Transmission electron microscopy (TEM) images were obtained on a JEM-2010F, JEOL, Japan microscope. EDAX analysis was done using X-Maxn 80T, United Kingdom. The nitrogen adsorption–desorption analyses were performed using a Gemini series Micromeritics 2360 instrument at −196 °C after degassing at 400 °C for 6 h. PXRD patterns of mixed metal oxides were recorded on an Ultima IV X-ray diffractometer (Rigajku, Japan) with Cu Kα and Ni filter. The scanning speed was set to 3° min−1. Fourier-Transform Infrared spectroscopy (FTIR) spectra were obtained on an FTIR spectrometer (Cary 670, Agilent) after pelletization with KBr. XPS analyses were done on a K-alpha XPS instrument (Thermo Scientific Inc., United Kingdom) with a monochromatic Al Kα X-ray source. The pressure was set to 4.8 × 10⁻⁹ mbar. Spectra were charge corrected to the main line of the C 1s spectrum (aromatic carbon) set to 284.7 eV. Spectra were analyzed using CasaXPS version 2.3.14. GL(p) = Gaussian/Lorentzian product formula where the mixing is determined by m = p/100, GL(100) is a pure Lorentzian while GL(0) is pure Gaussian. GL(30) was used in the present work. The H2S concentration in effluent gas was analyzed by a GSR-310 multi-gas analyzer (Sensoronic, Korea) with 0.1 ppm as the detection limit. The sulfate in the aqueous phase was quantified by ion chromatography (Thermo Fischer Scientific, AQUION system).2.4. Adsorption experiment
The breakthrough column studies were performed at room temperature and atmospheric pressure. Exactly 1.0 g of adsorbent was placed in between the glass wool, which was supported on silica beads in a pyrex tube (height: 50 cm, inner diameter: 1 cm).7 Through it, H2S gas was passed at a fixed flow rate. The effluent gas was analyzed every 15 s. The effluent concentration of 100 ppm (20%) was considered as the breakthrough point. The effect of moisture was studied by passing moist air (relative humidity ∼60%) through the adsorbent bed at a flow rate of 0.2 L min−1 for 0.5 h. It was followed by passing H2S gas at a flow rate of 0.2 L min−1. The effect of air was investigated by blowing atmospheric air at a flow rate of 0.5 L min−1 for 1 h, followed by passing H2S gas at a flow rate of 0.2 L min−1. The spent adsorbent was regenerated by soaking 1.0 g of adsorbent in 20 mL of ammonium hydroxide solution (0.9 mol L−1). After phase separation and drying, the regenerated adsorbent was packed and studied for the next cycle. The adsorption capacity (q, mg g−1) at the breakthrough point was calculated by integration of the area above the breakthrough curve.
 | (1) |
3. Results and discussion
3.1. Characterization of adsorbents
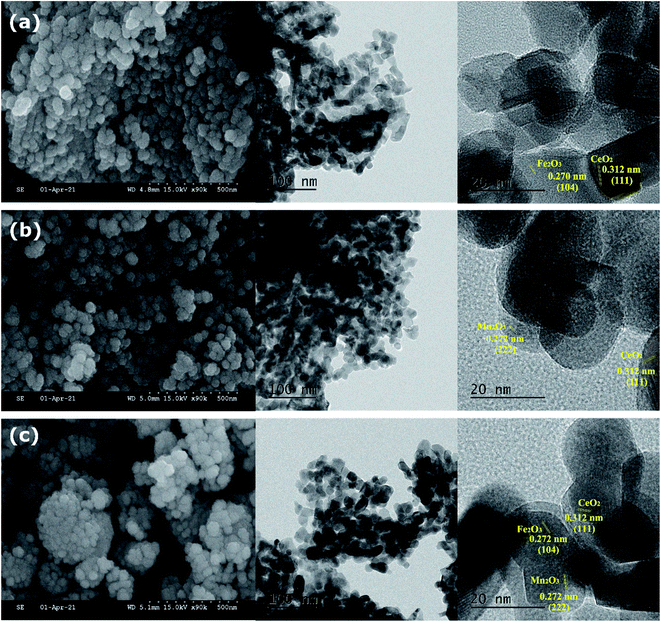
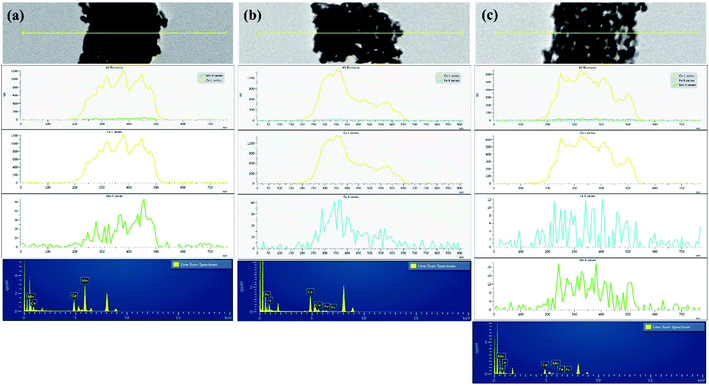
The SEM and TEM micrographs of mixed metal oxide nanocomposites are shown in Fig. 1. All three mixed metal oxide nanocomposites have nanospheres clustered together. The HRTEM image at 100 nm resolution showed that the nanospheres were formed with polyhedral nanocrystals of 10–20 nm size. The crystallite planes were assigned by measuring the fringe width in the HRTEM image and correlating it with the inter-planar spacing (d) from the PXRD pattern. The fringe width of 0.312 nm was assigned to the most intense (111) plane of CeO2,20 whereas the fringe width of 0.270 nm was assigned to the (104) plane of α-Fe2O3.21 Thus, CeO2 and Fe2O3 nanoparticles were closely present in CeFe (Fig. 1a). In CeMn, the fringe width of 0.270 nm was assigned to the (222) plane of α-Mn2O3 (ref. 22; Fig. 1b). For CeMnFe, CeO2, Fe2O3, and Mn2O3 nanoparticles were confirmed with their fringe width values (Fig. 1c).The EDAX line mapping and 2D elemental mapping of mixed metal oxide nanocomposites are shown in Fig. 2 and Fig. S1,† respectively. In CeMn, the Mn density was distributed over the Ce density, which confirmed the deposition of Fe2O3 over ceria nanoparticles (Fig. 2a). Moreover, the presence of some N was due to the presence of residual nitrate as nitrate salts were used in the synthesis process (Fig. S1†). For CeFe, besides Ce, O, and N, a uniform presence of Fe was observed (Fig. 2b). In CeMnFe, a uniform presence of Mn and Fe was observed over Ce (Fig. 2c). Thus, the elemental density analysis and line mapping confirmed the uniform distribution of transition metal oxides over CeO2.
Porosity properties and specific surface area of nanocomposites were calculated from N2 adsorption–desorption isotherms at −196 °C (Fig. 3a, Fig. S2–S4†). The N2 isotherms were found identical for all three nanocomposites. The surface area (SBET) of 18.9, 20.6, and 15.6 m2 g−1 was measured for CeFe, CeMn, and CeMnFe, respectively. The pore volume (Vp), average pore diameter (Dp,avg), and SBET values are listed in Table 1.
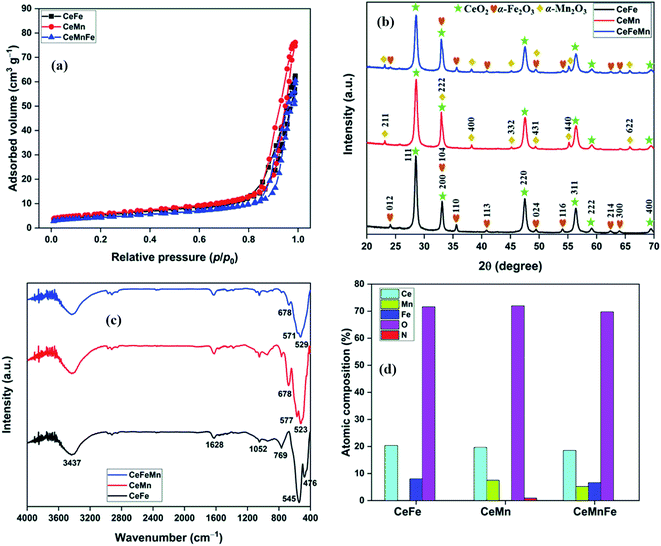 | ||
| Fig. 3 (a) N2 adsorption–desorption isotherms; (b) PXRD patterns; (c) FTIR spectra of mixed metal oxides; (d) atomic composition from XPS analysis. | ||
| Adsorbent | SBET (m2 g−1) | Vp (cm3 g−1) | Dp,avg (nm) |
|---|---|---|---|
| CeFe | 18.92 | 0.096 | 20.4 |
| CeMn | 20.56 | 0.118 | 22.9 |
| CeMnFe | 15.64 | 0.094 | 24.0 |
The PXRD patterns of mixed metal oxides are presented in Fig. 3b. The XRD pattern of CeFe has peaks at 28.52°, 33.10°, 47.48°, 56.34°, 59.10°, and 69.50°, which were assigned to the 111, 200, 220, 311, 222, and 400 reflections of CeO2, respectively (JCPDS file no. 81-0792).23 Additional peaks at 24.08°, 33.10°, 35.56°, 40.82°, 49.44°, 54.04°, 62.36°, and 63.94° corresponded to the 012, 104, 110, 113, 024, 116, 214, and 300 reflections of α-Fe2O3, respectively (JCPDS file no. 75-0033).21 Other than CeO2 peaks, additional peaks at 23.14°, 32.96°, 38.24°, 45.18°, 49.34°, 55.18°, and 67.46° for 211, 222, 400, 332, 431, 440, and 622 reflections of α-Mn2O3 (JCPDS file no. 24-0508), respectively, were observed in CeMn.24 For CeMnFe, the peaks corresponding to CeO2, α-Fe2O3, and α-Mn2O3 were present.
The FTIR spectra of mixed metal oxides are shown in Fig. 3c. In the FTIR spectrum of CeFe, the band at 3437 cm−1 coupled with a low-intensity band at 1628 cm−1 was assigned to the stretching and bending mode of O–H bonds in adsorbed water, respectively.25 The high-intensity band at 476 and 545 cm−1 was assigned to the bending and stretching vibration modes of metal–oxygen bonds, respectively.21,26 The band at 1052 cm−1 was due to the presence of Ce–OH overtone.23 In CeMn, the bands at 523 and 577 cm−1 were assigned to the stretching modes of Ce–O/Mn–O bonds.27 The band at 678 cm−1 was due to the antisymmetric Ce–O–Ce stretching mode of the bridged oxide formed by the condensation of adjacent hydroxyl groups on the surface, similar to Sn–O–Sn stretching.28 For CeMnFe, the band in 400–700 cm−1 was broad, with major bands centred at 529, 571, and 678 cm−1 for metal–oxygen stretching vibrations.
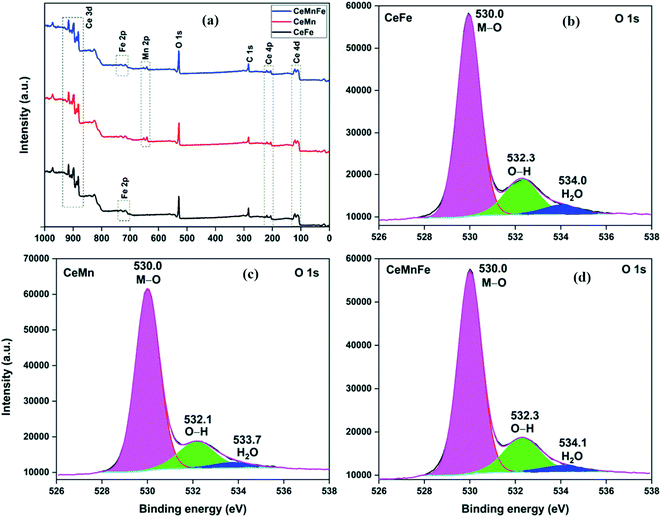
The atomic composition obtained from the TEM-EDX analysis validated the molar ratio of metal salts used in the synthesis process (Fig. 3d). The XPS full scan surveys of CeFe, CeMn, and CeMnFe are shown in Fig. 4a. The XPS survey of CeFe has peaks for Ce, C, O, and Fe. The C peak was due to the adventitious carbon. For CeMn, the peak for Mn 2p was present at ∼640 eV. For CeMnFe, the peaks corresponding to Ce, Mn, Fe, C, and O were distinctly visible. A small contribution of 0.91% for nitrogen due to the use of nitrate salts in the synthesis process was observed only in CeMn. Overall, the samples were nearly free of nitrogen presence. The HRXPS O 1s spectrum of CeFe has three distinct components at 530.0, 532.3, and 534.0 eV, which were assigned to the lattice oxygen (76.2%), hydroxyl groups (19.1%), and adsorbed water molecules (4.7%), respectively (Fig. 4b, Table 2).29 For CeMn (Fig. 4c) and CeMnFe (Fig. 4d), similar contributions were observed for lattice oxygen, O–H, and water molecules (Table S1†).
| Adsorbent | Experimental conditions | qe (mg g−1) | ||
|---|---|---|---|---|
| C0 (ppm) | Flowrate (mL min−1) | Breakthrough point (%) | ||
| a Superscript letters ‘w’ and ‘d’ indicate wet and dry conditions, respectively. | ||||
| Mn3O4 (ref. 18) | 300 | — | 33.3 | 16.0d |
| Nanostructured Fe2O3 (ref. 38) | 200 | — | 10.0 | 2.5d |
| Fe2O3 pellet39 | 150 | 810 | 1.0 | 3.9d |
| α-Fe2O3 powder | 24.7d | |||
| α-Fe2O3 (ref. 40) | 5000 | 20 | 2.6 | 0.0d |
| Mn2O3/Fe2O3 (ref. 19) | 500 | 200 | 80.0 | 12.0d |
| Cu-exchanged titanosilicate41 | 10 | 100 | 5.0 | 47.0d |
| Fe3+-doped Al-pillared montmorillonite42 | 3000 | 500 | 33.3 | 12.7w |
| CeMnFe [present study] | 500 | 200 | 20.0 | 28.3d |
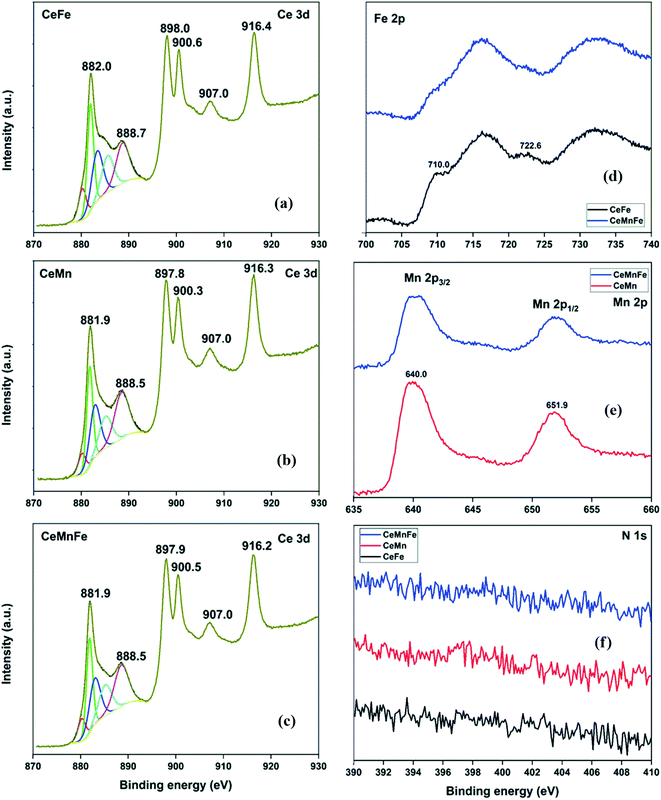
The HRXPS Ce 3d spectrum of CeFe has peaks at 898.0, 888.7, and 882.0 eV was assigned to the Ce 3d5/2 profiles. The Ce 3d3/2 profiles have 916.4, 907.0, and 900.6 eV peaks (Fig. 5a).30 The Ce 3d5/2 peaks were fitted to Ce3+ (28.1%) and Ce4+ (71.9%) oxidation states (Table S2†). For CeMn (Fig. 5b) and CeMnFe (Fig. 5c), similar Ce 3d spectra were observed with 24.1 and 25.5% of Ce3+ ions, respectively. The Fe 2p spectra of CeFe and CeMnFe have peaks at 710.0 (Fe 2p3/2) and 722.6 eV (Fe 2p1/2) along with two shake-up satellites for Fe3+ ions in Fe2O3 (Fig. 5d).31 The Mn 2p spectra of CeMn and CeMnFe have two peaks at 640.0 (Mn 2p3/2) and 651.9 eV (Mn 2p1/2) with a spin–orbit splitting of 11.9 eV for Mn3+ in Mn2O3 (Fig. 5e).32 The HRXPS N 1s showed a negligible presence of nitrogen on the surface of mixed metal oxides (Fig. 5f).
3.2. Breakthrough studies
The H2S breakthrough curves of dry metal oxide nanocomposites are shown in Fig. 6a. Among the three nanocomposites, CeMnFe had the adsorption capacity of 12.0 mg g−1, which was higher than that of CeMn (9.5 mg g−1) and CeFe (4.8 mg g−1). Xue et al. screened a series of transition metal oxides and their nanocomposites for the adsorptive removal of H2S at room temperature. The study found a higher adsorption capacity of mixed metal oxides compared to binary oxides.18 For validation, we have presented the adsorption capacity of pure oxides (Fig. 6b) and physical mixture of these oxides (Fig. 6c). The adsorption capacity of Fe2O3, Mn2O3, and CeO2 was 0.3, 1.6, and 1.9 mg g−1, respectively. The physically mixed oxides did not show any significant improvement in the H2S adsorption performance. The adsorption capacity of Ce/Fe (1.3 mg g−1), Ce/Mn (1.7 mg g−1), and Ce/Mn/Fe (1.6 mg g−1) were predominantly due to the higher proportion of CeO2 in the mixture. Thus, it was conclusive that the formation of these oxides as nanocomposites was of prime importance to improve the H2S adsorption capacity. In our previous study, we reported H2S adsorption over Mn2O3/Fe2O3 nanocomposite at room temperature. The study confirmed the involvement of both Mn2O3 and Fe2O3 in the oxidation of H2S. The redox behaviour of transition metal ions in these nanocomposites was responsible for enhanced adsorption capacity.19 Here, Ce3+/Ce4+, Fe2+/Fe3+, and Mn2+/Mn3+ redox behaviour played an important role in the oxidation of H2S over the nanocomposites.33 The effect of moisture in the H2S adsorption capacity was studied by adding moisture to the adsorbent bed, followed by the passing of H2S gas (Fig. 6d). The presence of moisture in adsorbents negatively affected the H2S removal process. Reportedly, moisture enhances the H2S removal capacity of metal oxides, where the formation of moisture film on the surface promotes reactive dissociation of H2S molecules.34 On the contrary, moisture may decrease the adsorption capacity by competing with the H2S adsorption sites.8,35 Here, we expected the competitive effect of water molecules for the active sites.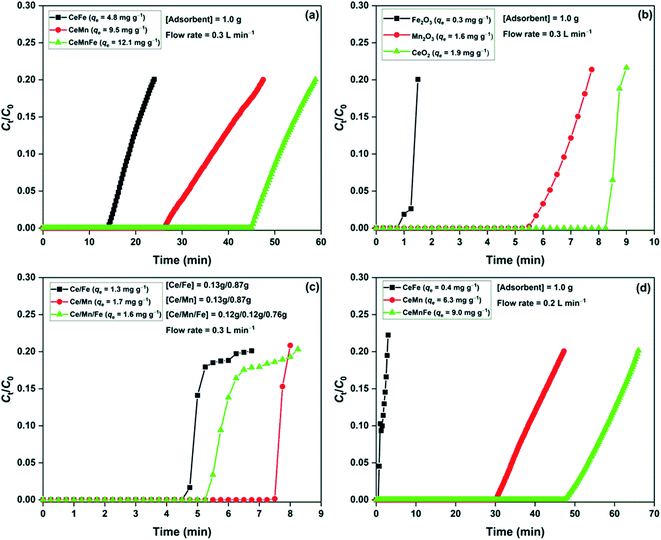 | ||
| Fig. 6 H2S breakthrough curves of (a) metal oxide nanocomposites; (b) pure oxides; (c) physically mixed oxides in dry condition; (d) metal oxide nanocomposite in moist condition. | ||
The effect of bed loading was studied by varying CeMnFe mass with a fixed flow rate of 0.3 L min−1 (Fig. 7a). The adsorption capacity slightly improved with the increase in the bed loading due to increased contact time with the increased adsorbent mass (bed length).36 The effect of flow rate on CeMnFe adsorption capacity was studied by varying the flow rate with a fixed adsorbent mass of 1.0 g (Fig. 7b). The adsorption capacity of 28.3 mg g−1 with 0.2 L min−1 decreased to 12.0 mg g−1 with 0.3 L min−1 flowrate. The increasing flow rate disfavored the adsorption process by decreasing the contact time, which, in turn, lowered the H2S interaction with the CeMnFe composite. A drastic decrease in the adsorption capacity was due to a low surface area and porosity, which resulted in limited diffusion of H2S at a higher flow rate. The competitive effect of air constituent on the H2S adsorption process was studied by passing ambient air through the adsorbent bed for 1 h, which was followed by H2S gas (Fig. 7c). The main components of ambient air, i.e. O2, CO2, and moisture, play a decisive role in the H2S removal process. CO2 is an acidic gas, which shows competitive behavior for H2S adsorption and negatively affects the adsorption capacity.37 While O2 promotes the adsorption process by forming oxidized sulfur byproducts, moisture lowers the H2S adsorption capacity, observed in the present study. The decreased adsorption capacity of CeFe (4.8 mg g−1), CeMn (6.3 mg g−1), and CeMnFe (7.8 mg g−1) showed that the negative role of CO2 and moisture outweighs the positive role of O2. Nonetheless, the adsorption capacity was satisfactory. The reusability of CeMnFe was tested by soaking the spent adsorbent in 0.9 mol L−1 ammonium hydroxide solution for 2 days (Fig. 7d). The material showed the adsorption capacity of 11.6, 9.2, and 6.3 mg g−1 in the first, second, and third cycle, respectively. Thus, it was possible to regenerate the synthesized nanocomposites for multiple cycles and recover H2S-oxidized products as ammonium sulfate (liquid fertilizer).34
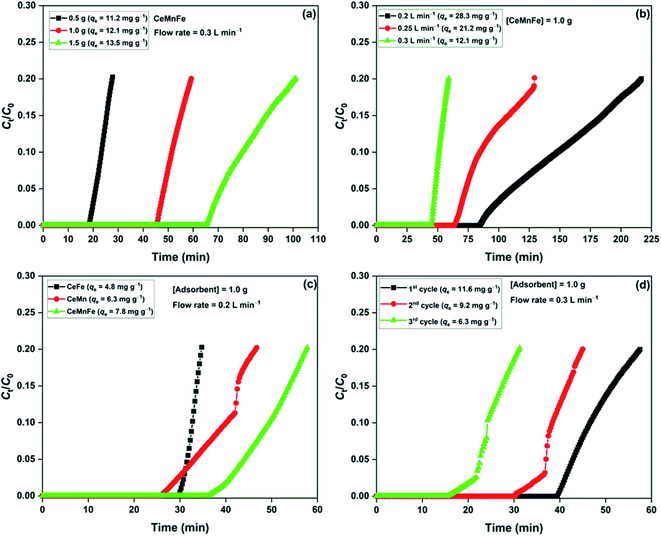 | ||
| Fig. 7 (a) Effect of dosage; (b) effect of flow rate; (c) effect of ambient air on H2S adsorption capacity; (d) reusability of CeMnFe. | ||
The adsorption capacity of synthesized nanocomposites was compared with the reported adsorbents in the literature. The adsorption capacity of CeMnFe was found higher than the Fe and Mn-based adsorbents (Table 2). In the literature, Ce-based adsorbents have not been reported for room temperature removal of H2S. Thus, the study provides the first account of CeO2-based adsorbents for H2S removal in ambient conditions.
3.3. Adsorption mechanism
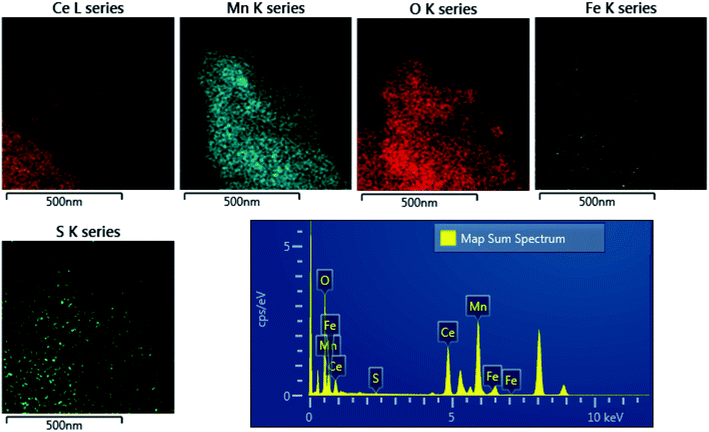
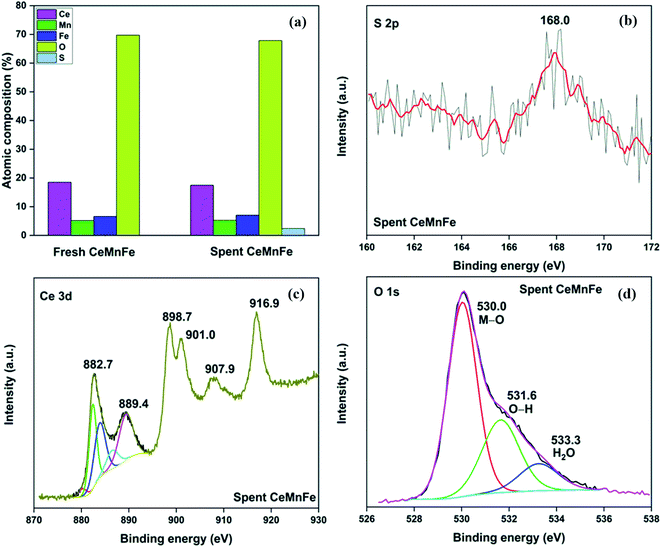
The distribution of sulfur in the spent CeMnFe nanocomposite was confirmed by EDAX elemental mapping (Fig. 8). Besides Ce, Mn, O, and Fe in the nanocomposite, wide distribution of S was observed after H2S adsorption. The wide distribution of S in the adsorbent was an indication of the delocalized catalytic sites over oxides of Ce, Mn, and Fe. Thus, preliminary assessment from the EDAX analysis showed the involvement of all three oxides in the adsorption of H2S. The PXRD pattern of CeMnFe before and after H2S adsorption is shown in Fig. S5.† The diffraction patterns showed no new peaks for sulfur species. Both patterns were nearly similar, suggesting no phase transformation in the nanocomposite. Moreover, there was no shift in the diffraction peaks after H2S adsorption, which indicated an insignificant lattice S2− in the metal oxide lattice. Since vacant sites were not traced in these nanocomposites, it was an unlikely event to observe the incorporation of S2− in the lattice. Other pathways involved the reactive interaction of H2S with the metal oxide surface yielding HS− and –OH group.43 More information on the S species and involvement of metal ions in the process have been probed using XPS analysis.The XPS analysis for the spent CeMnFe nanocomposite is available in Fig. 9. Apart from Ce, Mn, Fe, and O, 2.39% of S was confirmed based on the % atomic composition (Fig. 9a). The HRXPS S 2p spectrum of spent CeMnFe had a peak at 168.0 eV for SO42− species (Fig. 9b).7 Other than sulfate, no other species like sulfur or sulfide species could be detected by any analysis. The sulfate presence in adsorbents was confirmed by stripping the spent nanocomposites with distilled water. A 1.0 g of spent adsorbent was placed in 15 mL of distilled water and left for 48 h at room temperature. After the phase separation, the aqueous phase was analyzed by ion chromatography, which showed the presence of 0.40, 0.44, and 0.55 mg![[thin space (1/6-em)]](https://www.rsc.org/images/entities/char_2009.gif) L−1 of SO42− ions in CeFe, CeMn, and CeMnFe, respectively. These observations confirmed the oxidation of H2S to sulfates over mixed metal oxide nanocomposites. The HRXPS Mn 2p spectra of spent CeMnFe showed a peak shift towards higher binding energy due to the interaction of sulfate species with the Mn sites (Fig. S6†). The weak signals of Fe 2p made it difficult to ascertain its role in the oxidation process (Fig. S7†). The HRXPS Ce 3d spectra had contributions from Ce3+ and Ce4+ sites (Fig. 9c). The Ce3+/(Ce3+ + Ce4+) ratio in CeMnFe dropped from 25.5% in fresh sample to 13.1% in the spent sample, which suggested the involvement of Ce3+/Ce4+ catalytic system in the H2S oxidation process.43 In the HRXPS O 1s spectra, three contributions from lattice oxygen (59.9%), hydroxyl groups (28.8%), and H2O (11.3%) (Fig. 9d). Based on the analysis, the following reactions have been proposed for the oxidation process.
L−1 of SO42− ions in CeFe, CeMn, and CeMnFe, respectively. These observations confirmed the oxidation of H2S to sulfates over mixed metal oxide nanocomposites. The HRXPS Mn 2p spectra of spent CeMnFe showed a peak shift towards higher binding energy due to the interaction of sulfate species with the Mn sites (Fig. S6†). The weak signals of Fe 2p made it difficult to ascertain its role in the oxidation process (Fig. S7†). The HRXPS Ce 3d spectra had contributions from Ce3+ and Ce4+ sites (Fig. 9c). The Ce3+/(Ce3+ + Ce4+) ratio in CeMnFe dropped from 25.5% in fresh sample to 13.1% in the spent sample, which suggested the involvement of Ce3+/Ce4+ catalytic system in the H2S oxidation process.43 In the HRXPS O 1s spectra, three contributions from lattice oxygen (59.9%), hydroxyl groups (28.8%), and H2O (11.3%) (Fig. 9d). Based on the analysis, the following reactions have been proposed for the oxidation process.
| 2(O2−) + H2S → S2− + 2(–OH) | (2) |
| 2Mn+ + S2− → 2M(n−1) + S | (3) |
 | (4) |
 | (5) |
Since we have observed abundant hydroxyl groups and water molecules in the spent CeMnFe, these reactant species were not the reaction-driven species for the oxidation process. Eqn (4) and (5) hinted at the important role of adsorbed molecular oxygen in the M(n−1)+/Mn+ catalytic system and the formation of sulfate species. Thus, the deactivation of the oxidation process was due to the consumption of molecular oxygen during the oxidation process.
4. Conclusion
We have developed a novel one-step method for the fabrication of mixed metal oxide nanocomposites of Ce/Mn/Fe. The nanocomposites were synthesized by air calcination of molten salt solutions at 700 °C. The microscopic analyses confirmed the formation of polyhedral nanoparticles of size 10–20 nm, which agglomerated to form nanospheres. The PXRD patterns confirmed CeO2, α-Fe2O3, and α-Mn2O3 in respective nanocomposites. The synthesized nanocomposites have a surface area in the range of 16–21 m2 g−1. The nanocomposites were studied for the adsorptive removal of H2S gas in ambient conditions. CeMnFe showed a superior adsorption capacity compared to other synthesized nanocomposites. The maximum adsorption capacity of 28.3 mg g−1 was recorded for CeMnFe with 500 ppm of H2S gas and 0.2 L min−1 of flow rate. The TEM-EDAX analysis confirmed the presence of S species over the nanocomposite. The XRD and XPS analyses proved the formation of sulfate species as the byproduct of H2S oxidation. The study provides an easy method for the fabrication of mixed metal nanocomposites with excellent physicochemical properties. Moreover, we report the first instance of using CeO2-based materials for the room temperature desulfurization process.Author contributions
N. K. G. was responsible for conceptualization, data curation, formal analysis, software, writing the original draft. N. K. G and J. B. were in charge of methodology, visualization, and validation. K. S. K was responsible for funding acquisition, investigation, project administration, resources, and supervision.Conflicts of interest
There are no conflicts to declare.Acknowledgements
The authors are very grateful for the funds [Project #20210152-001] provided by the “Korea Institute of Civil Engineering and Building Technology” (KICT), Republic of Korea.References
- M. S. Shah, M. Tsapatsis and J. I. Siepmann, Chem. Rev., 2017, 117, 9755–9803 CrossRef CAS.
- L. Popoola, A. Grema, G. Latinwo, B. Gutti and A. Balogun, Int. J. Ind. Chem., 2013, 4, 35 CrossRef.
- O. W. Awe, D. P. Minh, N. Lyczko, A. Nzihou and Y. Zhao, J. Environ. Chem. Eng., 2017, 5, 1809–1820 CrossRef CAS.
- S. Wang, H. Nam and H. Nam, J. Environ. Chem. Eng., 2020, 8, 103683 CrossRef CAS.
- C. N. Okonkwo, H. Fang, D. S. Sholl, J. E. Leisen and C. W. Jones, ACS Sustainable Chem. Eng., 2020, 8, 10102–10114 CrossRef CAS.
- L. H. de Oliveira, J. G. Meneguin, M. V. Pereira, E. A. da Silva, W. M. Grava, J. F. do Nascimento and P. A. Arroyo, Microporous Mesoporous Mater., 2019, 284, 247–257 CrossRef CAS.
- N. K. Gupta, S. Kim, J. Bae and K. S. Kim, RSC Adv., 2021, 11, 4890–4900 RSC.
- N. K. Gupta, S. Kim, J. Bae and K. Soo Kim, Chem. Eng. J., 2021, 411, 128536 CrossRef CAS.
- A. Georgiadis, N. Charisiou and M. Goula, Catalysts, 2020, 10, 521 CrossRef CAS.
- K. V. Bineesh, D.-K. Kim, D.-W. Kim, H.-J. Cho and D.-W. Park, Energy Environ. Sci., 2010, 3, 302 RSC.
- A. A. Davydov, V. I. Marshneva and M. L. Shepotko, Appl. Catal., A, 2003, 244, 93–100 CrossRef CAS.
- T. Montini, M. Melchionna, M. Monai and P. Fornasiero, Chem. Rev., 2016, 116, 5987–6041 CrossRef CAS.
- H. T. Bui, S. Weon, J. W. Bae, E.-J. Kim, B. Kim, Y.-Y. Ahn, K. Kim, H. Lee and W. Kim, J. Hazard. Mater., 2021, 404, 123976 CrossRef CAS PubMed.
- D.-H. Kang, M.-I. Kim and D.-W. Park, Korean J. Chem. Eng., 2016, 33, 838–843 CrossRef CAS.
- V. Palma and D. Barba, Int. J. Hydrogen Energy, 2014, 39, 21524–21530 CrossRef CAS.
- D. N. Oosthuizen, D. E. Motaung and H. C. Swart, Appl. Surf. Sci., 2020, 505, 144356 CrossRef CAS.
- Z. Li, X. Niu, Z. Lin, N. Wang, H. Shen, W. Liu, K. Sun, Y. Q. Fu and Z. Wang, J. Alloys Compd., 2016, 682, 647–653 CrossRef CAS.
- M. Xue, R. Chitrakar, K. Sakane and K. Ooi, Green Chem., 2003, 5, 529–534 RSC.
- S. Kim, N. K. Gupta, J. Bae and K. S. Kim, J. Environ. Chem. Eng., 2021, 9, 105216 CrossRef CAS.
- P. S. Murphin Kumar, S. Thiripuranthagan, T. Imai, G. Kumar, A. Pugazhendhi, S. R. Vijayan, R. Esparza, H. Abe and S. K. Krishnan, ACS Sustainable Chem. Eng., 2017, 5, 11290–11299 CrossRef CAS.
- N. K. Gupta, Y. Ghaffari, J. Bae and K. S. Kim, J. Mol. Liq., 2020, 301, 112473 CrossRef CAS.
- J. Wang, G. Zhu, L. Deng, L. Kang, Z. Hao and Z. Liu, CrystEngComm, 2012, 14, 8253 RSC.
- M. S. Pujar, S. M. Hunagund, D. A. Barretto, V. R. Desai, S. Patil, S. K. Vootla and A. H. Sidarai, Bull. Mater. Sci., 2020, 43, 24 CrossRef CAS.
- P. Pal, A. K. Giri, S. Mahanty and A. B. Panda, CrystEngComm, 2014, 16, 10560–10568 RSC.
- G. Bharath and N. Ponpandian, RSC Adv., 2015, 5, 84685–84693 RSC.
- Y. H. Leung, M. M. N. Yung, A. M. C. Ng, A. P. Y. Ma, S. W. Y. Wong, C. M. N. Chan, Y. H. Ng, A. B. Djurišić, M. Guo, M. T. Wong, F. C. C. Leung, W. K. Chan, K. M. Y. Leung and H. K. Lee, J. Photochem. Photobiol., B, 2015, 145, 48–59 CrossRef CAS.
- S. Gnanam and V. Rajendran, J. Sol-Gel Sci. Technol., 2011, 58, 62–69 CrossRef CAS.
- S. Bellayer, L. Viau, Z. Tebby, T. Toupance, J. L. Bideau and A. Vioux, Dalton Trans., 2009, 1307 RSC.
- S. Poulin, R. França, L. Moreau-Bélanger and E. Sacher, J. Phys. Chem. C, 2010, 114, 10711–10718 CrossRef CAS.
- J. Pang, W. Li, Z. Cao, J. Xu, X. Li and X. Zhang, Appl. Surf. Sci., 2018, 439, 420–429 CrossRef CAS.
- M. C. Biesinger, L. W. M. Lau, A. R. Gerson, R. St and C. Smart, Appl. Surf. Sci., 2010, 257, 887–898 CrossRef CAS.
- Y.-H. Son, P. T. M. Bui, H.-R. Lee, M. S. Akhtar, D. K. Shah and O.-B. Yang, Coatings, 2019, 9, 631 CrossRef.
- A. Mirzaei, S. S. Kim and H. W. Kim, J. Hazard. Mater., 2018, 357, 314–331 CrossRef CAS.
- N. K. Gupta, J. Bae and K. S. Kim, Chem. Eng. J., 2021, 130909 Search PubMed.
- C. Weinlaender, R. Neubauer, M. Hauth and C. Hochenauer, Chem. Ing. Tech., 2017, 89, 1247–1254 CrossRef CAS.
- N. Q. Long and T. X. Loc, Adsorption, 2016, 22, 397–408 CrossRef.
- R. Sitthikhankaew, D. Chadwick, S. Assabumrungrat and N. Laosiripojana, Fuel Process. Technol., 2014, 124, 249–257 CrossRef CAS.
- D. M. Cristiano, R. de A. Mohedano, W. C. Nadaleti, A. B. de Castilhos Junior, V. A. Lourenço, D. F. H. Gonçalves and P. B. Filho, Renewable Energy, 2020, 154, 151–160 CrossRef CAS.
- C. Costa, M. Cornacchia, M. Pagliero, B. Fabiano, M. Vocciante and A. P. Reverberi, Materials, 2020, 13, 4725 CrossRef CAS PubMed.
- Y. Cao, X. Zheng, Z. Du, L. Shen, Y. Zheng, C. Au and L. Jiang, Ind. Eng. Chem. Res., 2019, 58, 19353–19360 CrossRef CAS.
- S. Rezaei, A. Tavana, J. A. Sawada, L. Wu, A. S. M. Junaid and S. M. Kuznicki, Ind. Eng. Chem. Res., 2012, 51, 12430–12434 CrossRef CAS.
- D. Nguyen-Thanh, K. Block and T. J. Bandosz, Chemosphere, 2005, 59, 343–353 CrossRef CAS PubMed.
- X. Zheng, Y. Li, L. Zhang, L. Shen, Y. Xiao, Y. Zhang, C. Au and L. Jiang, Appl. Catal., B, 2019, 252, 98–110 CrossRef CAS.
Footnote |
| † Electronic supplementary information (ESI) available. See DOI: 10.1039/d1ra03309c |
| This journal is © The Royal Society of Chemistry 2021 |

