
 Open Access Article
 This Open Access Article is licensed under a Creative Commons Attribution-Non Commercial 3.0 Unported Licence
The stability and electronic and photocatalytic properties of the ZnWO4 (010) surface determined from first-principles and thermodynamic calculations†
Yonggang Wuab,
Jihua Zhang c,
Bingwei Longa and
Hong Zhang*a
c,
Bingwei Longa and
Hong Zhang*a
aCollege of Physics, Sichuan University, Sichuan 610065, China
bSchool of Physics and Electronic Science, Guizhou Education University, Guiyang 550018, China
cGuizhou Provincial Key Laboratory of Computational Nano-Material Science, Guizhou Education University, Guiyang 550018, China. E-mail: hongzhang@scu.edu.cn
First published on 5th July 2021
Abstract
We present the results of the generalized-gradient approximation of Perdew, Burke and Ernzerhof (GGA-PBE) and the Heyd–Scuseria–Ernzerhof (HSE06) hybrid functional calculations of the atomic and the electronic structures of ZnWO4 (010) surfaces. The total energies obtained from these calculations are used to analyze the thermodynamic stability of the surfaces. The surface phase diagrams are constructed by surface Gibbs free energies obtained as a function of temperature and oxygen partial pressure. Our results suggested that the stable area of the surface terminations of ZnWO4 (010) has little correlation with the functional selected. The stability phase diagram shows that O-Zn, DL-W, and DL-Zn terminations of ZnWO4 (010) can be stabilized under certain thermodynamic equilibrium conditions. Based on the HSE06 hybrid functional, we calculate the electronic structures for three possible stability surface terminations. It is found that there is a fat band of the surface states in DL-W termination, which shows a delocalized feature. This fat band acts as an electron transition bridge between the valence band (VB) and conduction band (CB). It contributes to visible-light absorption by two-step optical transition with the first transition from the VB to the fat band and the second from the fat band to the CB. Significantly, the conduction band minimum (CBM) band edge position of DL-W termination is favourable for H2 evolution as the CBM edge is located above the water reduction level (H+/H2). Simultaneously, DL-W termination's valence band maximum (VBM) potential shows a strong potential for O2 generation from water oxidation because of the higher VBM edge with respect to the water oxidation level (H2O/O2). These results may help explore ZnWO4 (010) surfaces' intrinsic properties, providing a helpful strategy for experimental studies of ZnWO4-based photocatalysts in the future.
1 Introduction
Zinc tungstate (ZnWO4) is a type of tungstate semiconductor material with unique optical and chemical properties, for example, a high average refractive index, high X-ray absorption coefficient, high light yield, short decay time, and low afterglow to luminescence.1,2 It can be used in photocatalysis, luminescent devices, microwave communications, laser-active hosts, phase-change optical recording media, humidity sensors, scintillation detectors, Li-ion batteries, and tomography systems.3–12 As a critical photocatalyst, monoclinic wolframite structured ZnWO4 has two coordination structures of [ZnO6] and [WO6]. This unique layered structure is beneficial for the separation of electron–hole pairs.13,14 Under ultraviolet (UV) light irradiation, ZnWO4 has been applied for photocatalytic hydrogen production from water and organic pollutant degradation.9,10,15,16 For understanding and predicting the photocatalytic activity of ZnWO4, knowledge of the atomic structure and properties of surfaces is essential.17,18The (010) surface of ZnWO4 has received extensive attention over the past few years because of its suitable cleavage property. Theoretically, Opoku et al. find that the surface energy of the (010) surface is smaller than that of the (100) and (001) surfaces, indicating that the (010) surface is more stable than the (100) and (001) surfaces.19 Therefore, for ZnWO4 crystal, the most preferably exposed surface is the (010) slab. Experimentally, high-quality ZnWO4 crystals of 80–100 mm diameter and 220–240 mm length with a mass of up to 8 kg are successfully grown by direct crystallization in the [010] direction.20,21 The XPS measurements reveal that tungsten and zinc atoms are formal valences +6 and +2, respectively.20 Using density functional theory (DFT) calculations, Sun et al. calculated the electronic properties of mono N- and F-doped and (N, F)-codoped ZnWO4 (010) surfaces. They find that NadFs (N adsorptive and F doping on O site) codoping is a promising way for improving the visible-light photoactivity of ZnWO4 (010) surface.22 As semiconductor photocatalytic heterostructure coupling, various ZnWO4(010)-based heterostructure photocatalysts have been reported, including g-C3N4/ZnWO4(010),23 ZnWO4(010)/BiOI(001),24 and BiNbO4/ZnWO4(010).19 These heterostructures can effectively promote the charge transfer process and improve visible-light catalytic activity. In this context, knowledge of ZnWO4 (010) surface properties would be helpful.
The termination is an important consideration when determining the relative stability of the ZnWO4 (010) surface. Therefore, the ZnWO4 (010) surface properties with different terminations are theoretically and experimentally studied. Theoretically, Pereira et al. find that the ZnWO4 (010) surface is ZnO-terminated using the DFT method.25 Sun et al. performed an ab initio study of the electronic structure of ZnWO4 (010) surface with ZnO-termination using the spin-polarized generalized gradient approximation (GGA), using the Perdew, Burke, and Ernzerhof (PBE) for exchange–correlation functional (GGA-PBE). The calculated results indicated that this ZnO-termination surface bandgap is broader than that of pure ZnWO4 bulk.22 However, all the aforementioned theoretical investigations examined the ZnWO4 (010) surface obtained by simply cleaving the crystal (010) planes. Experimentally, based on high-resolution X-ray reflectivity measurements, WO-termination is found by Atuchin et al.20 However, previous studies did not analyze the ZnWO4 (010) surface's relative stability with different termination under certain environmental conditions. Thus, it is necessary to examine the surface properties of different terminations for ZnWO4 (010) under different chemical potentials at finite temperature and pressure to design new ZnWO4 (010) related materials with excellent photocatalytic activity.
The density functional calculations allowed us to estimate the surface Gibbs free energy and compare the stability of possible surface terminations for the ZnWO4 (010) surface as a function of the chemical environment. Using GGA-PBE and Heyd–Scuseria–Ernzerhof (HSE06) functionals, we calculated the thermodynamic stability and atomic and electronic structures of possible surface terminations for the ZnWO4 (010) surface. These studies are complemented by thermodynamic analysis of the surface stability at different gas pressures and temperatures. Our calculated results show that O-Zn, DL-W, and DL-Zn terminations of ZnWO4 (010) surface can be stabilized under certain thermodynamic equilibrium conditions. Furthermore, the electronic structures for three possible stability surface terminations based on HSE06 functional are calculated. We found a fat band of the surface states in DL-W termination, which could contribute to visible-light absorption. Therefore, an enhanced optical absorption in the visible-light region is predicted in the DL-W termination. Significantly, the and conduction band minimum (CBM) band edge position of DL-W termination is favourable for H2 evolution as the CBM edge is above the water reduction level (H+/H2). Simultaneously, DL-W termination's valence band maximum (VBM) potential shows a strong potential for O2 generation from water oxidation because of the higher VBM edge with respect to the water oxidation level (H2O/O2). The results enable the prediction of ZnWO4 (010) surface structures and properties under the entire range of accessible environmental conditions.
2 Methodology
2.1 Surface structure model
There are two different oxygen sites, one metal-Zn site and one metal-W site in ZnWO4. Along the (010) direction in the crystal structure of ZnWO4, the atomic stacking sequence is –O(R-O-W)–2O(O-W)–W(SL-W)–Zn(DL-Zn)–3O(R-O-Zn)–4O(O-Zn)–2Zn(SL-Zn)–2W(DL-W)–O(R-O-W)–. Correspondingly, crystal planes with (010) orientation can have eight different surface terminations (Fig. 1). To classify the possible terminations, we introduce the surface nomenclature as follows: (i) if the termination is stoichiometric termination and first layer with O, and the subsurface layer with W, we denoted as O-W termination (Fig. 1(a)). (ii) A surface termination first and second layers with W and Zn, respectively, is denoted by SL-W termination (Fig. 1(b)). (iii) A surface termination first, subsurface, third, and fourth layer with Zn, O, O, and Zn, respectively, is denoted by DL-Zn termination (Fig. 1(c)). (iv) R-O-Zn indicates a surface termination first and second layers with O, the third layer with Zn, and the fourth layer with W termination (Fig. 1(d)). (v) A stoichiometric surface termination first layer with O and the subsurface layer with Zn is denoted as O-Zn termination (Fig. 1(e)). (vi) A surface termination first layer with Zn and a second layer with W is denoted by SL-Zn termination (Fig. 1(f)). (vii) A surface termination first, subsurface, third, and fourth layer with W, O, O, and W, respectively, is denoted by DL-W termination (Fig. 1(g)). (viii) A surface termination first and second layers with O and the third layer with W is denoted as R-O-W termination (Fig. 1(h)). The symmetric models concerning the slabs' central layer deal with polar surfaces' polarity issues.26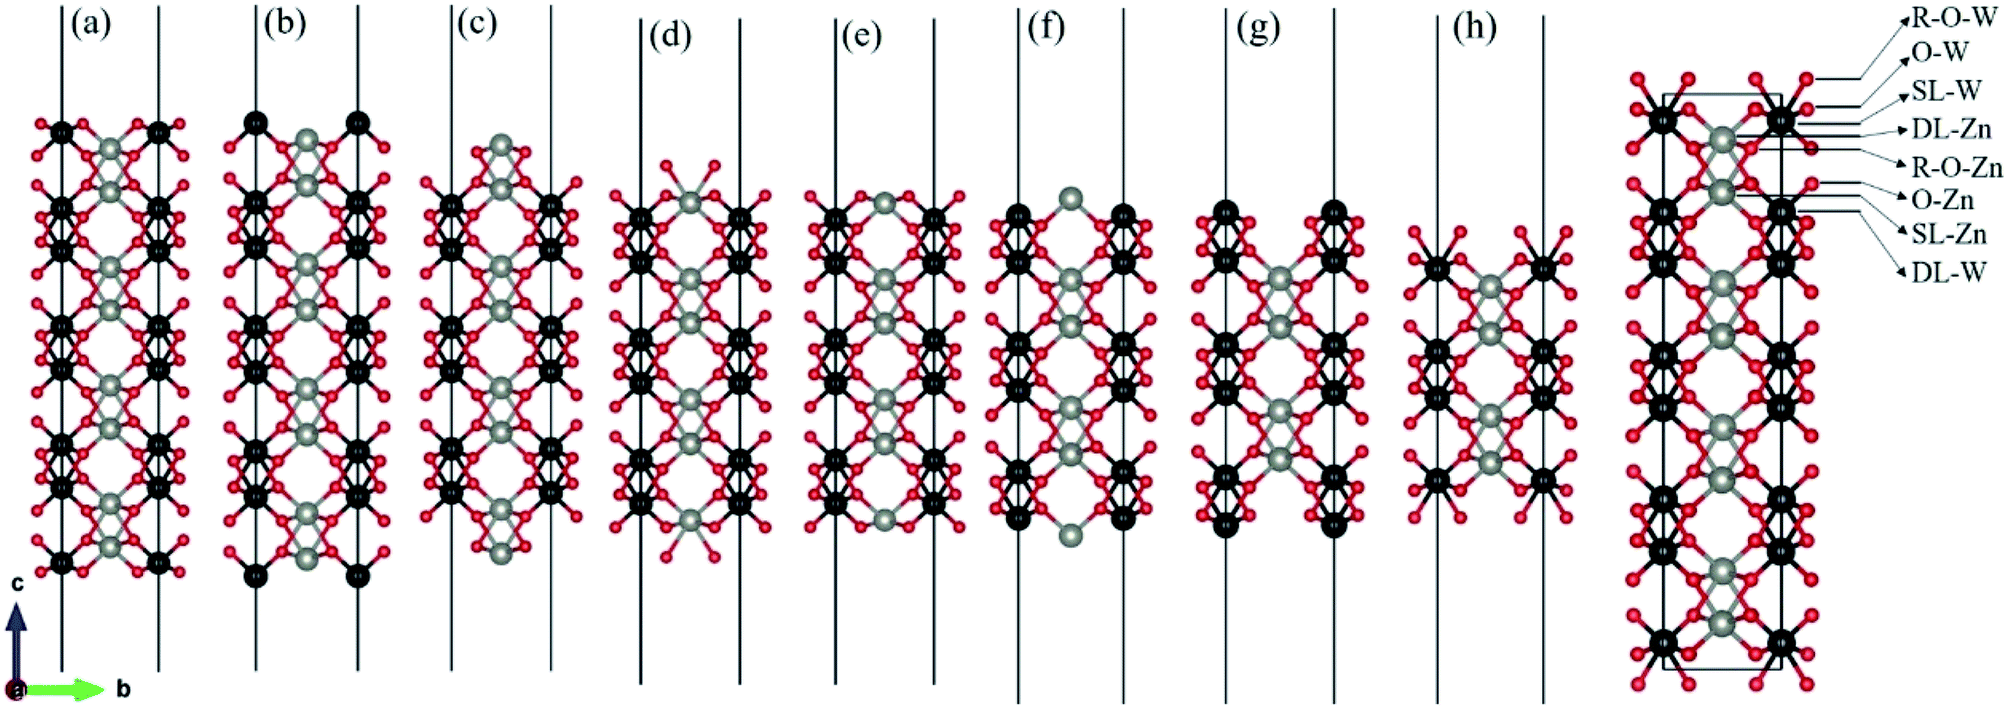 | ||
| Fig. 1 Various possible surface termination structures of ZnWO4 (010) before geometry optimization. (a) O-W term., (b) SL-W term., (c) DL-Zn term., (d) R-O-Zn term., (e) O-Zn term., (f) SL-Zn term., (g) DL-W term., (h) R-O-W term. The red, black and gray balls represent O, W, and Zn atoms, respectively. | ||
After geometry optimization, eight possible surface termination structures of ZnWO4 (010) are shown in Fig. 2. Comparing Fig. 1 and 2, we find that the surface reconstruction of the SL-W, R-O-Zn, SL-Zn, and R-O-W terminations (Fig. 2(b), (d), (f) and (h)) are more evident than that of the O-W, DL-Zn, O-Zn, and DL-W terminations (Fig. 2(a), (c), (e) and (g)). Especially for the O-W and O-Zn terminations (Fig. 2(a) (e)), which are stoichiometric surface termination, there is almost no reconstruction of these surface terminations before and after geometry optimization. Therefore, it is suggested that the O-W and O-Zn terminations' electronic structure is similar to that of the bulk ZnWO4, and no apparent surface state is observed, which is discussed in Section 3.
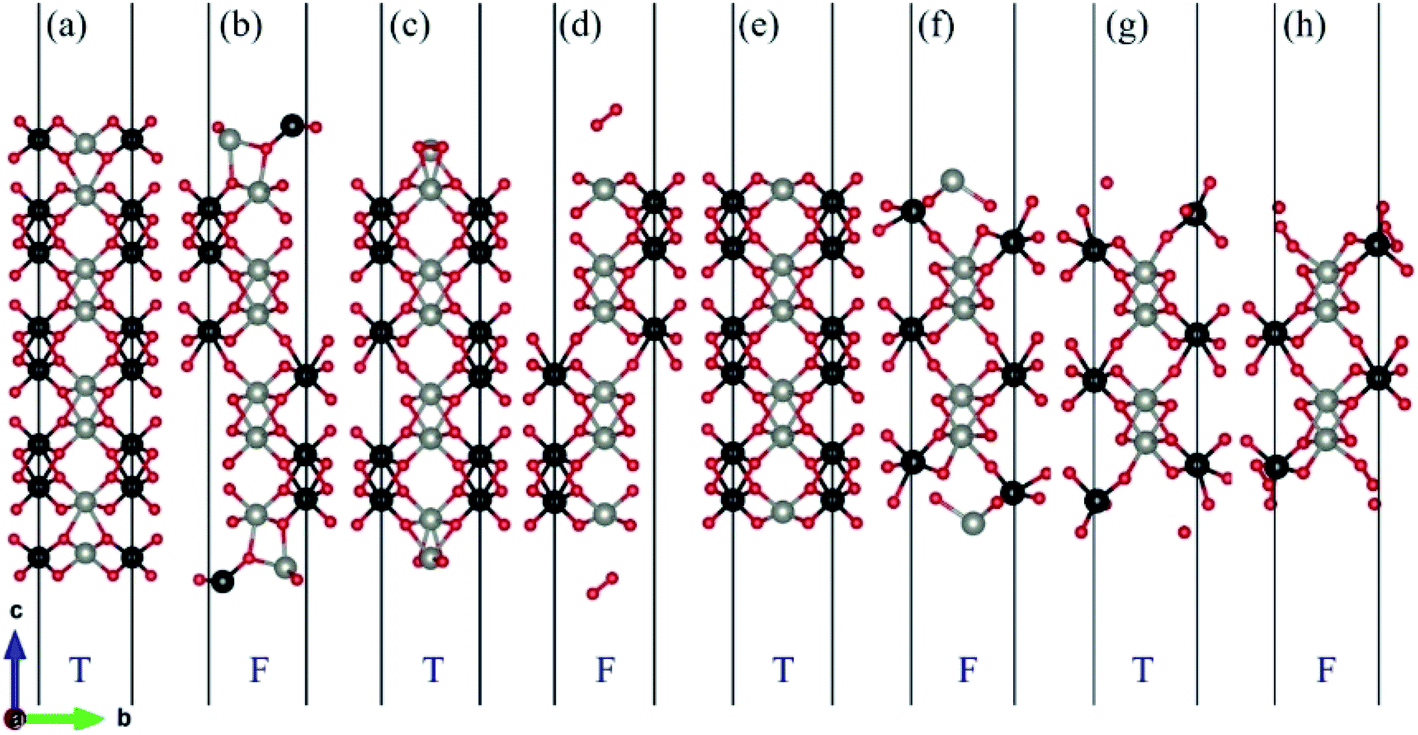 | ||
| Fig. 2 Various possible surface termination structures of ZnWO4 (010) after geometry optimization. (a) O-W term., (b) SL-W term., (c) DL-Zn term., (d) R-O-Zn term., (e) O-Zn term., (f) SL-Zn term., (g) DL-W term., (h) R-O-W term. T represents O-W, DL-Zn, O-Zn, and DL-W terminations are thermodynamically stable. F represents SL-W, R-O-Zn, SL-Zn, and R-O-W terminations are thermodynamically unstable. The red, black and gray balls represent O, W, and Zn atoms, respectively. | ||
We examined the surface energy to analyze the stoichiometric surface termination's stability (O-W and O-Zn terminations). It is defined as follows: Esurf = {E(slab) − nE(bulk)}/2A, where E(slab) and E(bulk) represent the total energies of the slab and bulk models, respectively. Additionally, n is the number of unit cells used to make the slab model, and A represents the surface area. Our calculated results showed that O-W and O-Zn terminations' surface energies are 0.050 and 0.025 eV Å−2, respectively, indicating that the O-Zn termination is more stable than the O-W termination. Therefore, we only consider the case of O-Zn termination in the following sections.
2.2 Computational details
All DFT calculations are performed using the plane-wave projector-augmented wave (PAW) method27 as implemented in the Vienna Ab initio Simulation Package (VASP).28,29 We used the GGA-PBE30 for geometry optimizations. It is known that the GGA-PBE usually suffers from bandgap underestimation.31 The HSE06 (ref. 32 and 33) functional can provide more accurate bandgaps than the GGA methods because of its partial incorporation of exact exchange. Therefore, in this study, using the HSE06 functional, we calculated the electronic structures and band edge positions. The screening parameter is set to 0.2 Å−1 for the HSE06 hybrid functional. We tested the bandgap of bulk ZnWO4 by adjusting the Hartree–Fock mixing parameter (α) from 0.15 to 0.25, as shown in Fig. 3. It was found that when α = 0.19, the calculated bandgap is 3.77 eV for bulk ZnWO4, near to the experimental band gap of 3.75 eV.19,34 The valence electron configurations of the PAW potentials are treated as 5d46s2 for W, 3d104s2 for Zn, and 2s22p4 for O. A kinetic-energy cutoff of 500 eV is evaluated to be sufficient for plane-wave expansion to achieve good convergence. Electronic self-consistent interaction convergence is considered sufficient for a total energy difference of less than 10−5 eV, and the forces on each ion converged to be less than 0.01 eV Å−1. A 15 Å thick vacuum is added to avoid the top and bottom atoms' interactions in the periodic slab images. Monkhorst–Pack k-point meshes in the Brillouin zone are used in the optimization of bulk ZnWO4 (5 × 4 × 5) and surface structures (5 × 5 × 1). All the atom positions are allowed to relax. Furthermore, the pre- and post-processing of the calculation results is completed using VASPKIT software.35 All figures are visualized by using VESTA software.36 For the bulk ZnWO4 structure, we used the monoclinic (space group 13, P2/c) structure and experimental lattice constants37 of a = 4.6829 Å, b = 5.7085 Å, c = 4.922 Å, α = 90°, β = 90.543°, γ = 90° for its conventional cell.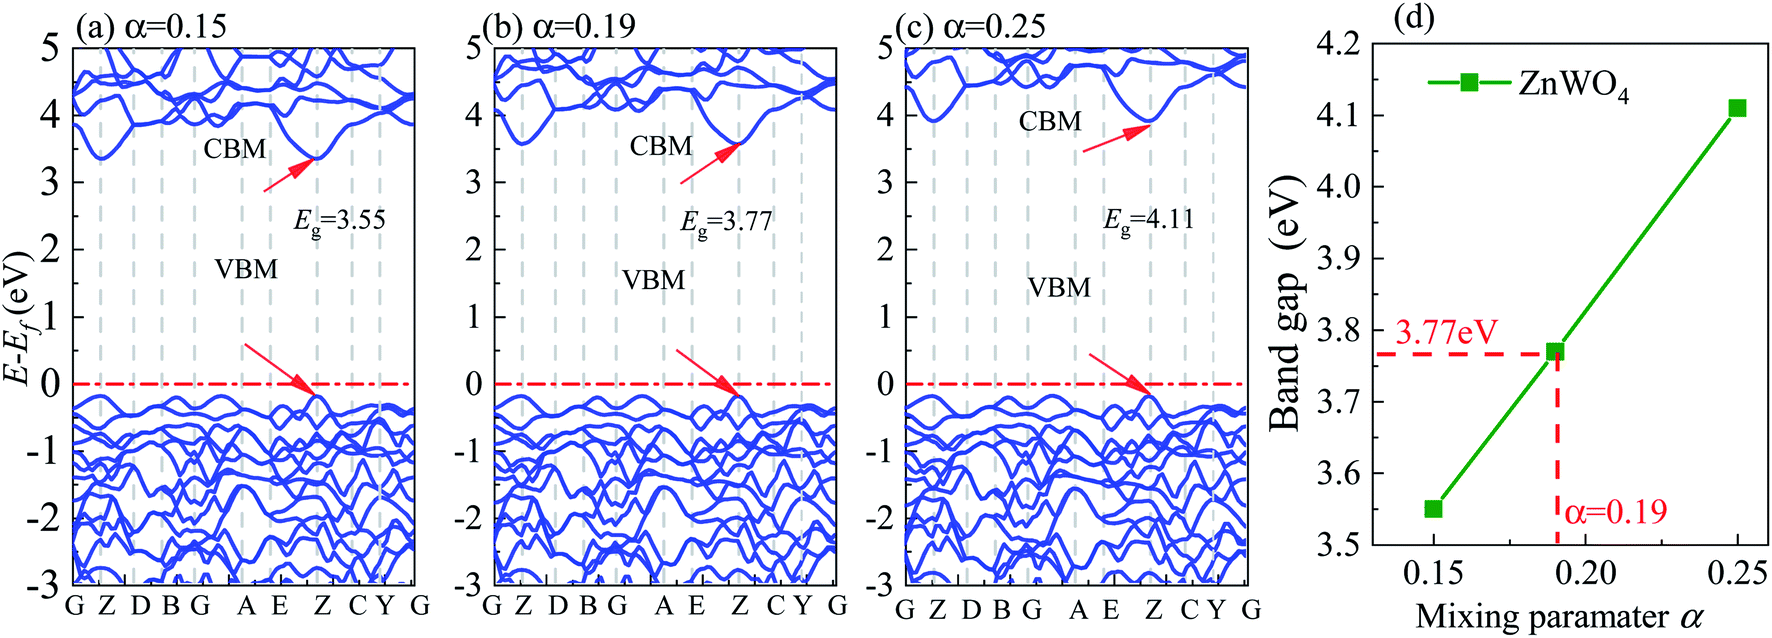 | ||
| Fig. 3 Band structure of bulk ZnWO4 calculated using HSE06 method with different Hartree–Fock mixing parameters (α), (a) α = 0.15, (b) α = 0.19, and (c) α = 0.25. (d) The bandgap as a function of Hartree–Fock mixing parameters (α). | ||
2.3 Thermodynamic stability
The surface Gibbs free energy is used to determine a surface's stability as a function of environmental conditions.38 The surface Gibbs free energy Ω(ZnWO4) is defined as.38–41
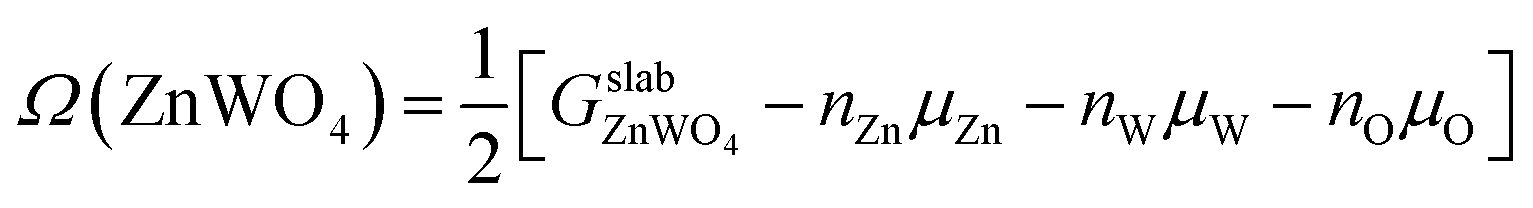 | (1) |
 is the total Gibbs free energy of the slab. The μi (i = Zn, W, O) is the chemical potential of Zn, W, and O. The nZn, nW, and nO are numbers of Zn, W, and O atoms. The factor 1/2 represents that the surface slab has two surface sides per slab.
Under thermal equilibrium growth conditions, the chemical potential μZnWO4 is equal to the bulk crystal Gibbs free energy and is written as a sum of three terms representing each species' chemical potential within the crystal.38–40
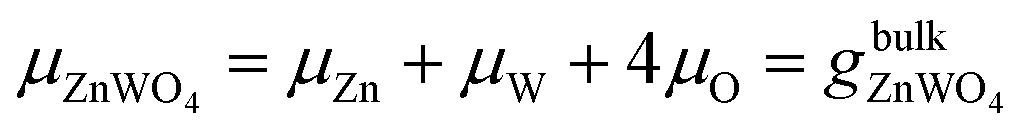 | (2) |
The entropy's contributions and the pressure-volume work to their respective Gibbs free energy can be safely ignored.40–42 We will also ignore the vibration in our DFT calculation because its contributions can easily be disregarded.40,41 Therefore, the Gibbs free energies are considered as total energies of orthorhombic ZnWO4 per formula, which can be obtained from our DFT calculation:
 | (3) |
We assume
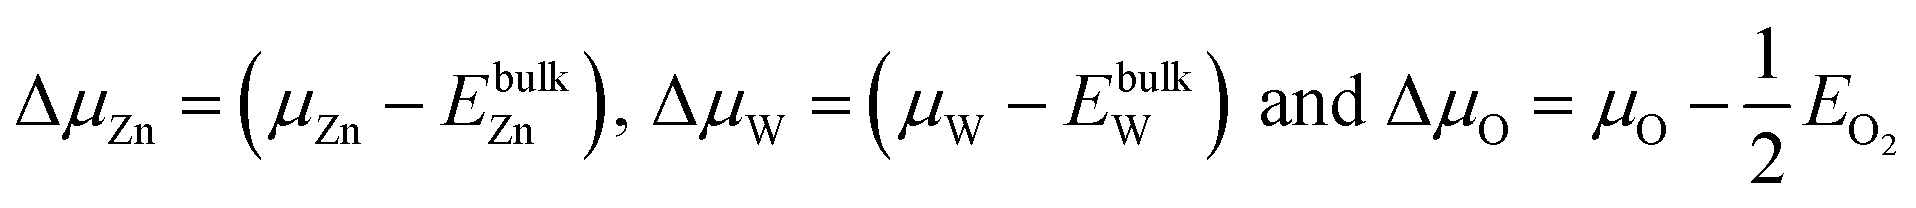 | (4) |
![[3 with combining macron]](https://www.rsc.org/images/entities/char_0033_0304.gif) m), and O2 molecules by DFT calculations, respectively.
m), and O2 molecules by DFT calculations, respectively.
We take ΔμZn and ΔμO as independent variables. When μW was replaced by μZn and μO via eqn (2)–(4), eqn (1) can be written as
 | (5) |
 is total energy of ZnWO4 slab.
We assume
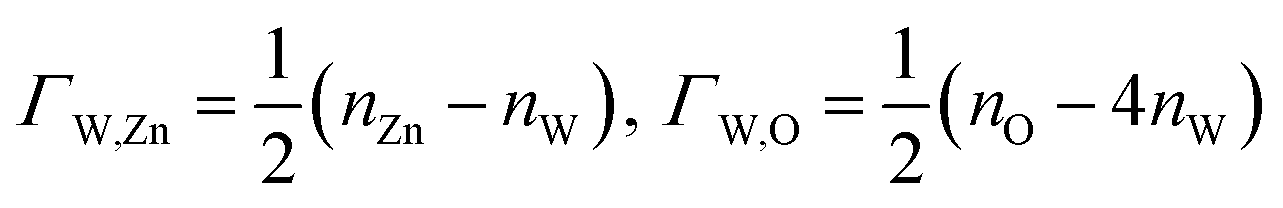 and
and 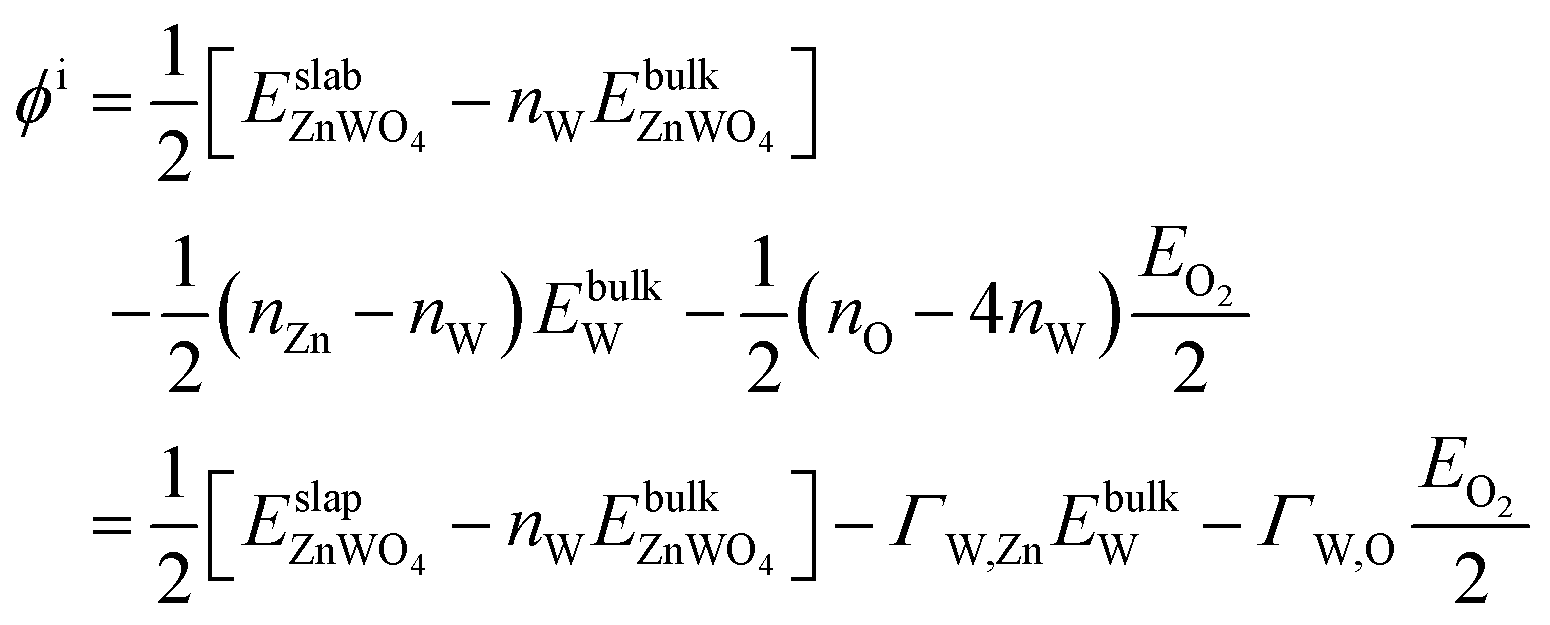
Finally, we can rewrite eqn (5) as
| ΩZnWO4 = ϕi − ΓW,ZnΔμZn − ΓW,OΔμO | (6) |
The GGA-PBE and HSE06 results of ϕi are calculated and listed in Table 1. We find that the results of GGA-PEB and HSE06 are not much different.
| Surface i | ΓW,Zn | ΓW,O | ϕi eV Å−2, GGA-PBE | ϕi eV Å−2, HSE06 |
|---|---|---|---|---|
| O-W term | 0 | 0 | 0.046 | 0.050 |
| SL-W term | 0 | −2 | 0.451 | 0.429 |
| DL-Zn term | 1 | 2 | −0.022 | −0.004 |
| R-O-Zn term | 0 | 2 | — | — |
| O-Zn term | 0 | 0 | 0.023 | 0.025 |
| SL-Zn term | 0 | −2 | 0.419 | 0.402 |
| DL-W term | −1 | −2 | 0.371 | 0.358 |
| R-O-W term | 0 | 2 | 0.119 | 0.173 |
To determine the stable region of ZnWO4, the boundary that prevents metal Zn and W from being precipitated should be given. Moreover, oxygen atoms should be limited to form oxygen molecules. Therefore, the deviation in the Zn and W chemical potentials can be used to provide a limit as follows:
| ΔμZn ≤ 0, ΔμW ≤ 0 | (7) |
The chemical potential of O atoms by its deviation from the energy of an oxygen atom in a free, isolated O2 molecule 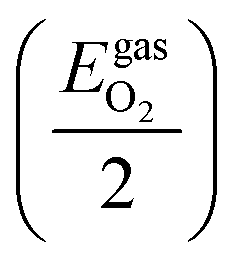
| ΔμO ≤ 0 | (8) |
The inequalities (7) and (8) define the W, Zn, and O chemical potentials' upper boundaries. By combining eqn (2) and inequalities (7) and (8), the lower boundary can derive the following:
| ΔμZn + 4ΔμO ≥ Δgf(ZnWO4) | (9) |
 | (10) |
The additional boundary conditions have to be satisfied to prevent the precipitations of zinc and tungsten oxides,
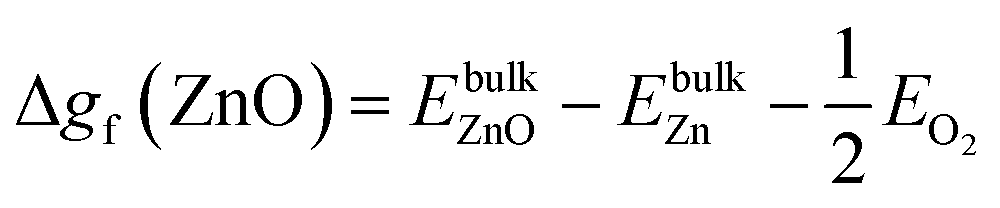
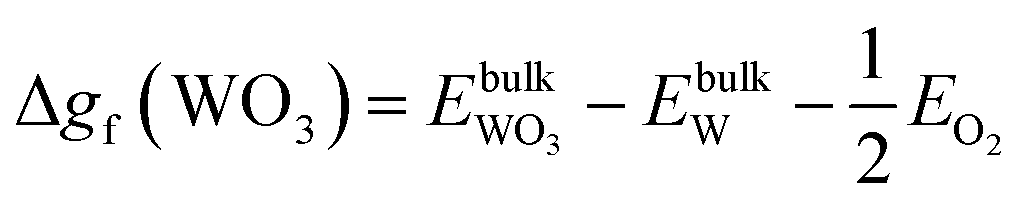
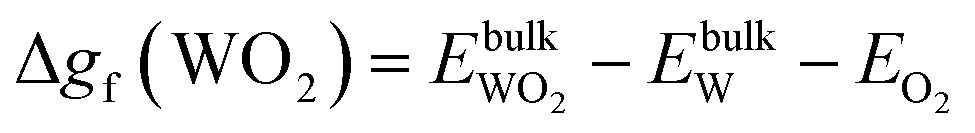
| ΔμW + 2ΔμO ≤ Δgf(WO2), ΔμW + 3ΔμO ≤ Δgf(WO3), ΔμZn + ΔμO ≤ Δgf(ZnO) | (11) |
| Δgf(ZnO) ≥ ΔμZn + ΔμO ≥ Δgf(ZnWO4) − Δgf(WO3) | (12) |
 | (13) |
 | (14) |
 | (15) |
 , and
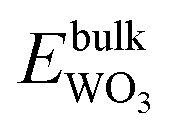
, and  are total energies of ZnO, WO3, and WO2 in the bulk states, respectively. All the above Gibbs free energy of formation and total energies for oxides are obtained from DFT calculations with GGA-PBE and HSE06 functionals.
The oxygen atoms in ZnWO4 are considered in equilibrium with oxygen gas in the atmosphere over the crystal surface, leading to equality of oxygen chemical potentials in a crystal and the atmosphere
 | (16) |
Oxygen chemical potentials are difficult to access in experimental and industrial conditions. The oxygen gas can be considered as an ideal gas. Based on the ideal gas model, oxygen chemical potentials can be expressed as26,40,43
 | (17) |
 | (18) |
To avoid cumbersome and complicated calculations, we write the deviation of the oxygen chemical
 | (19) |
Here, ΔG(T,p) is the temperature-dependent variation of Gibbs free energy of oxygen when at standard pressure p0, available from thermodynamic Tables.39–41 The last term is
 | (20) |
 and standard oxygen entropy
  are taken from thermodynamics data.44 The correction δμ0O in eqn (19) is used to match the DFT calculation and experimental variation of O2, which is given in ESI† of ref. 26. This is because we take the total energy of O2 at 0 K as the reference state. In line with previous studies,39,45 the correction δμ0O was estimated from all the considered oxides and metals, which are −0.146 and 0.420 eV for WO3 and ZnO using the HSE06 method, respectively. The average value of −0.293 eV is used.
3 Result and discussion
3.1 Stability of various surface terminations
As previously demonstrated,39,45–47 the surface Gibbs free energies determine the stability of the different surface terminations as a function of the environmental conditions, such as O partial pressure, temperature, etc. In this paper, we compute the surface Gibbs free energy (eqn (5)) of various terminations (SL-W, R-O-Zn, SL-Zn, R-O-W, O-W, DL-Zn, O-Zn, and DL-W terminations, Fig. 1), as a function of the excess chemical potentials ΔμO and ΔμZn. The surface Gibbs free energy should be positive. This is because if surface Gibbs free energy becomes negative, the surface formation will lead to an energy gain, and the crystal will be destroyed.39 For The HSE06 results, as shown in Fig. 4(b), the black direction indicated by the arrow on each line has positive Gibbs free energy, implying that these terminations are stable and exposed ZnWO4 surface under given chemical conditions.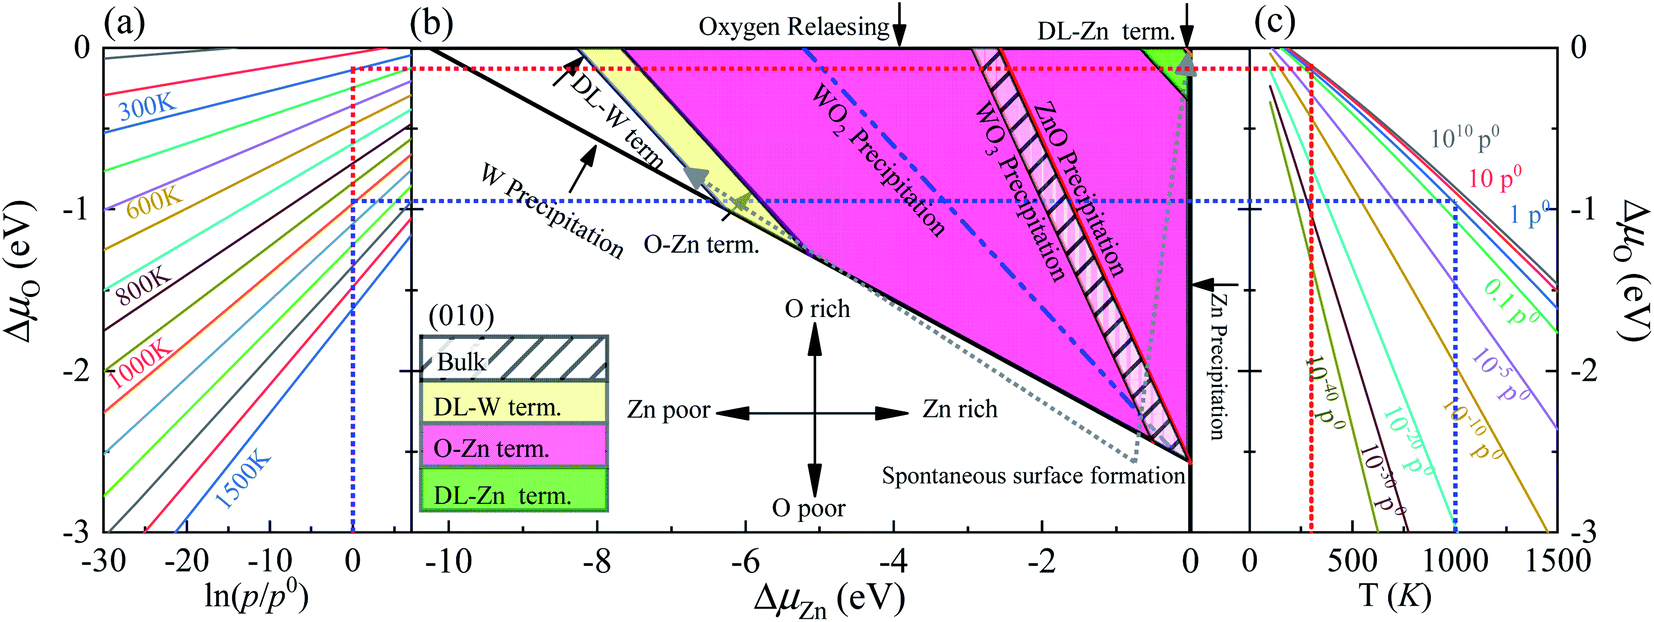 | ||
| Fig. 4 (a) The ΔμO as a function of oxygen gas pressure at various temperatures according to eqn (18), (b) the phase diagrams for ZnWO4 (010) surface with different terminations (DL-W term., O-Zn-W term., DL-Zn term.) as functions of chemical potential variations for Zn and oxygen atoms, (c) the ΔμO as a function of temperature at various oxygen gas pressures according to eqn (18). All total energies are obtained using the HSE06 method. | ||
In addition, the most stable surface termination for any considered ΔμO and ΔμZn has the smallest surface Gibbs free energy.48 The boundaries between stability regions for different surfaces terminations i and j are determined by solving the equation Ωi = Ωj, where Ω is surface Gibbs free energy of terminations i and j. According to the above thermodynamically criterion, the range as
| −8.256 eV < ΓW,ZnΔμZn + ΓW,OΔμO < −0.082 eV | (21) |
This bound is defined as a spontaneous surface formation line (Fig. 4(b)), following ref. 49 and 39. Applying the above, we plotted the phase diagram, Fig. 4(b), showing where the coloured areas (different surface terminations of ZnWO4 (010)) are stable. Similarly, using the GGA-PBE functional, we calculated the phase diagrams for the ZnWO4 (010) surface with different terminations, as shown in Fig. 5. Our results (Fig. 4 and 5) suggested that the stable area for the surface terminations of ZnWO4 (010) has little correlation with the functional selected for calculation.
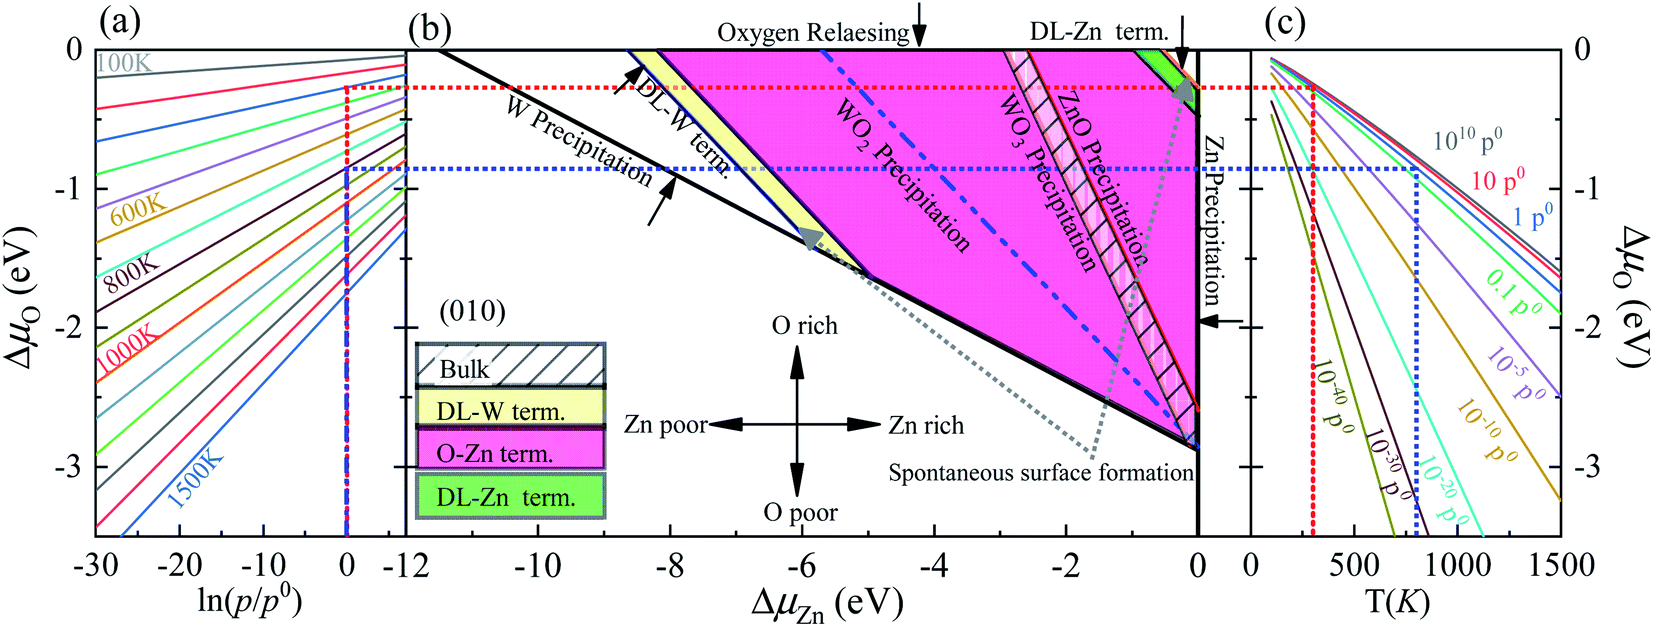 | ||
| Fig. 5 (a) The ΔμO as a function of oxygen gas pressure at a various temperature according to eqn (18), (b) the phase diagrams for ZnWO4 (010) surface with different terminations (DL-W term., O-Zn-W term., DL-Zn term.), as functions of chemical potential variations for bismuth and oxygen atoms, (c) the ΔμO as a function of temperature at various oxygen gas pressures according to eqn (18). All total energies are obtained using the GGA-PBE method. | ||
Pure ZnWO4 can exist when conditions inequality (7)–(9) and inequality (11) and (12) are satisfied. These conditions are shown in Fig. 4(b) by solid lines, indicating where Zn, W, ZnO, WO2, and WO3 occur. The formation energies of ZnWO4, ZnO, WO2, and WO3, which determine respective precipitation lines, are presented in Table 2. These energies agree reasonably well with experimental data shown in the same table. The WO2 and WO3 crystals will grow on the left and below the WO2 and WO3 precipitation lines, respectively. At the same time, the ZnO will grow above and on the ZnO precipitation line's right. Owing to deficiencies in DFT descriptions of relative energies for materials with different degrees of oxidation,39 we treat the obtained data with some caution and highlight the precipitation lines for 3-valent metal oxides WO3, 2-valent ZnO. The only region where a pure ZnWO4 can be obtained is the narrow stripe between the WO3 precipitation line on the right and the ZnO precipitation line on the left, as shown in Fig. 4(b). At the bottom of the diagram, the stripe is limited by the W precipitation line.
The depiction used for establishing the diagrams makes it possible to determine the oxygen environment conditions that correlate with the points on the phase diagrams in Fig. 4(a and c). These functions are calculated from experimental data, taken from ref. 44, following the approach described earlier by eqn (19). For a family of values for the temperature, the dependencies of the oxygen chemical potential on various gas pressures are shown in Fig. 4(a). Likewise, for several gas pressures, the dependencies of the oxygen chemical potentials on the different temperatures are shown in Fig. 4(c).
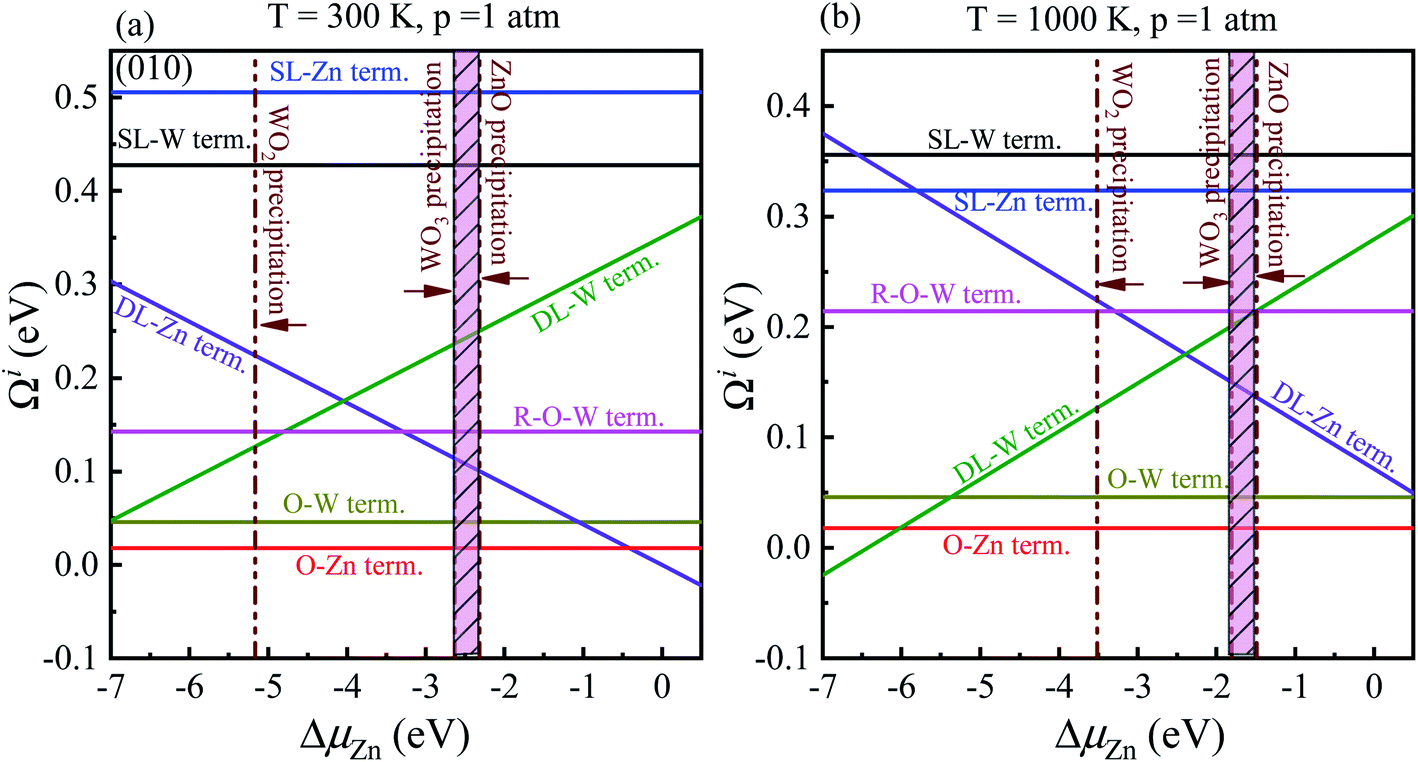
In order to determine the most stable surface region in the diagram at ambient temperature conditions (300 K) and standard oxygen pressure (1 atm), we can draw a vertical line on the two sides of the diagram and a horizontal line on the phase diagram (Fig. 4). Then, the phase diagram is constructed in Fig. 6(a). The surface Gibbs free energy only is a function of ΔμZn because ΔμO value is −0.18 eV at T = 300 K and pO2 = 1 atm. Similarly, the phase diagram is also plotted in Fig. 6(b) at 1000 K and 1 atm. Here, the ΔμO value is −0.90 eV. Fig. 6(a) shows that two surface terminations (the O-Zn and DL-Zn terminations) are the most stable under specific ranges of ΔμZn. When ΔμZn is larger than −0.43 eV at ΔμO = −0.18 eV, the surface Gibbs free energy of the DL-Zn termination becomes smaller than that of other terminations. The DL-Zn termination is the most stable under these chemical conditions. However, when ΔμZn is lower than −0.43 eV, the most stable termination shifts to the O-Zn one. Also, we perform the ab initio molecular dynamics (AIMD) simulations53 at 300 K for 10 ps with 10![[thin space (1/6-em)]](https://www.rsc.org/images/entities/char_2009.gif) 000-time steps to test the thermal stability of the O-Zn and DL-Zn terminations. The canonical ensemble (NVT) with constant temperature is used for the calculations of thermal characteristics. The temperature and energy fluctuation as a function of time by AIMD simulations is shown in Fig. 7. Our calculations demonstrate that the atomic structures of the O-Zn and DL-Zn terminations are still robust after 10 ps of heating. No significant distortions are observed in atomic structures of the O-Zn and DL-Zn terminations, as presented in the snapshots of their atomic structures in Fig. 7. Also, there is no structural transition and no bond breaking in the O-Zn and DL-Zn terminations at 300 K. Therefore, and our results indicated that the O-Zn and DL-Zn terminations are thermally stable at room temperature.
000-time steps to test the thermal stability of the O-Zn and DL-Zn terminations. The canonical ensemble (NVT) with constant temperature is used for the calculations of thermal characteristics. The temperature and energy fluctuation as a function of time by AIMD simulations is shown in Fig. 7. Our calculations demonstrate that the atomic structures of the O-Zn and DL-Zn terminations are still robust after 10 ps of heating. No significant distortions are observed in atomic structures of the O-Zn and DL-Zn terminations, as presented in the snapshots of their atomic structures in Fig. 7. Also, there is no structural transition and no bond breaking in the O-Zn and DL-Zn terminations at 300 K. Therefore, and our results indicated that the O-Zn and DL-Zn terminations are thermally stable at room temperature.
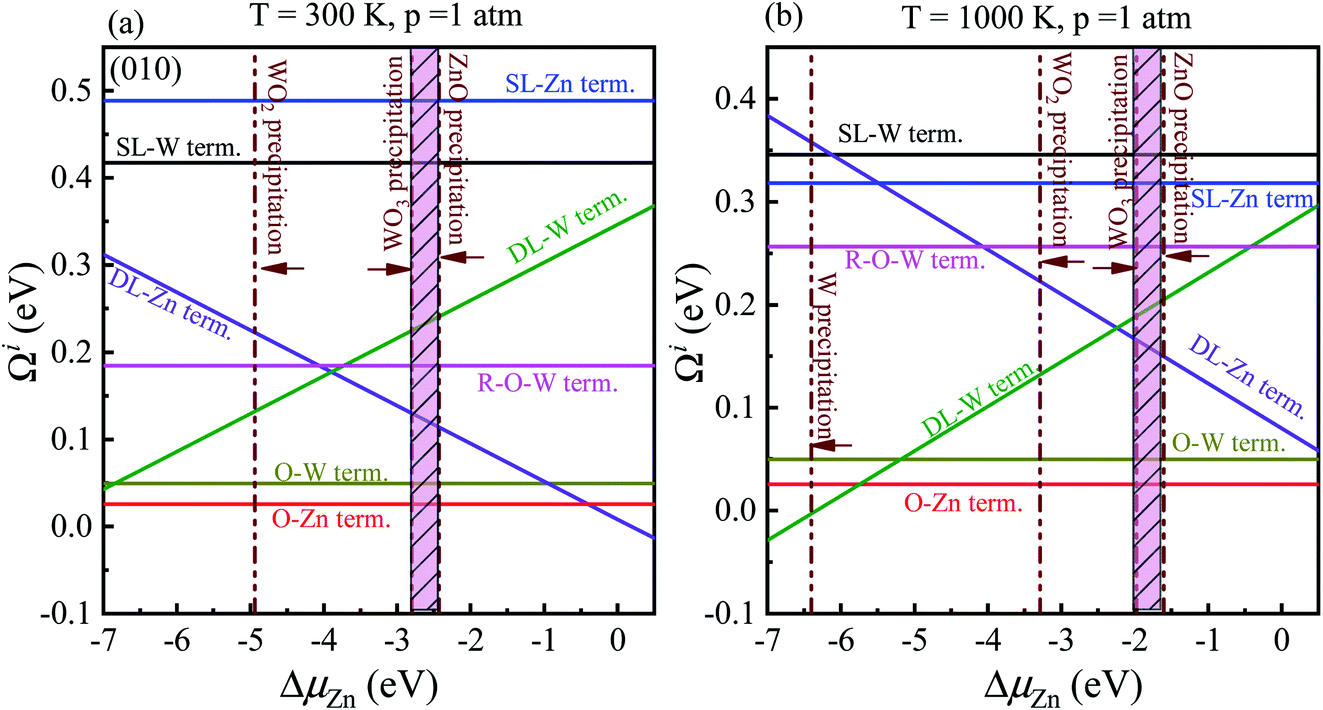 | ||
| Fig. 6 Surface Gibbs free energies as a function of ΔμZn at a certain temperature and pressure for ZnWO4 (010) surface. (a) at T = 300 K and pO2 = 1 atm; (b) at T = 1000 K and pO2 = 1 atm. All total energies are obtained using the HSE06 method. | ||
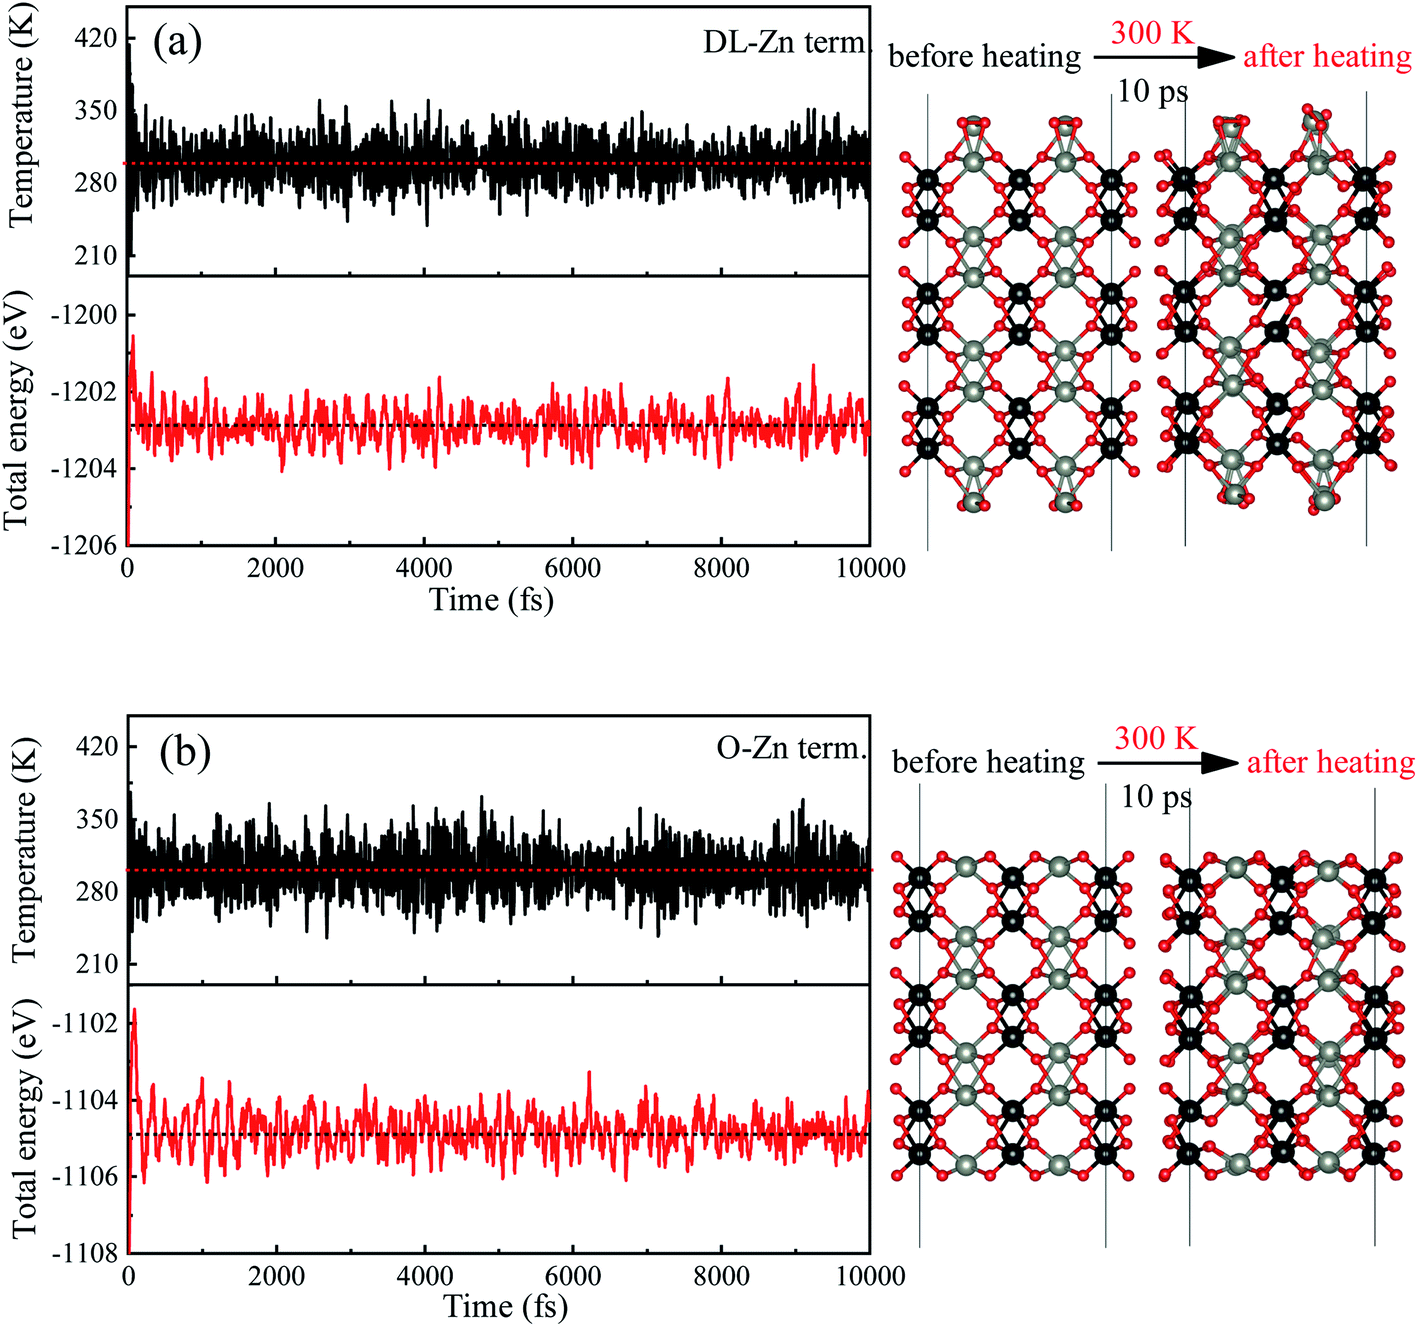 | ||
| Fig. 7 Variations of temperature and energy plotted as a function of time for ab initio molecular dynamics (AIMD) simulations of (a) DL-Zn and (b) O-Zn terminations, under 300 K for 10 ps with a time step of 1 fs. The right parts show the termination structures at 0 ps and 10 ps. The red, black and gray balls represent O, W, and Zn atoms, respectively. | ||
Significantly, with the temperature at 1000 K, the ordering of these surface terminations' stability is changed, as shown in Fig. 6(b). When ΔμZn is larger than −5.78 eV at ΔμO = −0.90 eV, the O-Zn termination is the most stable, while at 300 K, the most stable termination is DL-Zn. This is because the surface Gibbs free energy of the DL-Zn termination is smaller than others. Otherwise, when ΔμO = −0.90 eV, ΔμZn < −5.78 eV, the most stable surface changes into the DL-W termination. The results as mentioned above illustrated that temperature and pressure have significant impacts on the stability of the different surface terminations under certain ΔμO and ΔμZn. Experimentally, Pereira et al.25 investigate surface energy at 0 K base on DFT calculations. They found that O-Zn surface termination is a stable surface. We compared all the surface terminations, which showed that O-Zn termination is one of the three most stable terminations within the ZnWO4 crystal stability region in the considered range of ΔμZn at a temperature under ambient conditions. For GGA-PBE functional, using the same method, we formed the phase diagram in Fig. 8. It is found that the stability of all consider surface terminations are the same as that of HSE06 results. The result obtained by HSE06 is similar to that of GGA-PBE, confirming the accuracy of the result.
 | ||
| Fig. 8 Surface Gibbs free energies as a function of ΔμZn at a certain temperature and pressure for ZnWO4 (010) surface. (a) at T = 300 K and pO2 = 1 atm; (b) at T = 1000 K and pO2 = 1 atm. All total energies are obtained using the GGA-PBE method. | ||
3.2 Electronic structure
We have calculated the band structures, density of states (DOS), partial density of states (PDOS), and layer-resolved density of states (LDOS) for three surface terminations (O-Zn, DL-W, and DL-Zn) using the HSE06 functional. They are shown in Fig. 9 (band structure), Fig. 10 (DOS, PDOS), and Fig. 11 (LDOS). These surface terminations are likely stable under different chemical conditions for a specific range of Zn excess chemical potentials and different temperatures. The band structures, DOS, PDOS, LDOS of O-Zn, DL-W, and DL-Zn terminations using the GGA-PBE functional are shown in Fig. S1–S3.† Comparing the calculated results by these two methods, we can see that HSE06 can correct bandgaps to some extent, whereas the shape of the band structures, DOS, PDOS, and LDOS by HSE06 and GGA-PBE functionals are the same. These results are consistent with previous theoretical results.54 The band structures, DOSs, and PDOS of bulk ZnWO4 are also calculated for a better comparison. Fig. 9(a) shows that the VBM and CBM lie on the gamma point, so bulk ZnWO4 is a direct bandgap semiconductor with a 3.77 eV bandgap, which is in excellent agreement with previous experimental results19,34 and theoretical results.25 However, the bandgap using the GGA-PBE functional (2.86 eV) is smaller than the HSE06 (3.77 eV) functional (Fig. S1(a), S2(a),† 9(a), and 10(a)), which is due to the well-known shortcomings of the GGA-PBE functional.55 Our GGA-PBE result is in agreement with the prediction of Sun et al.22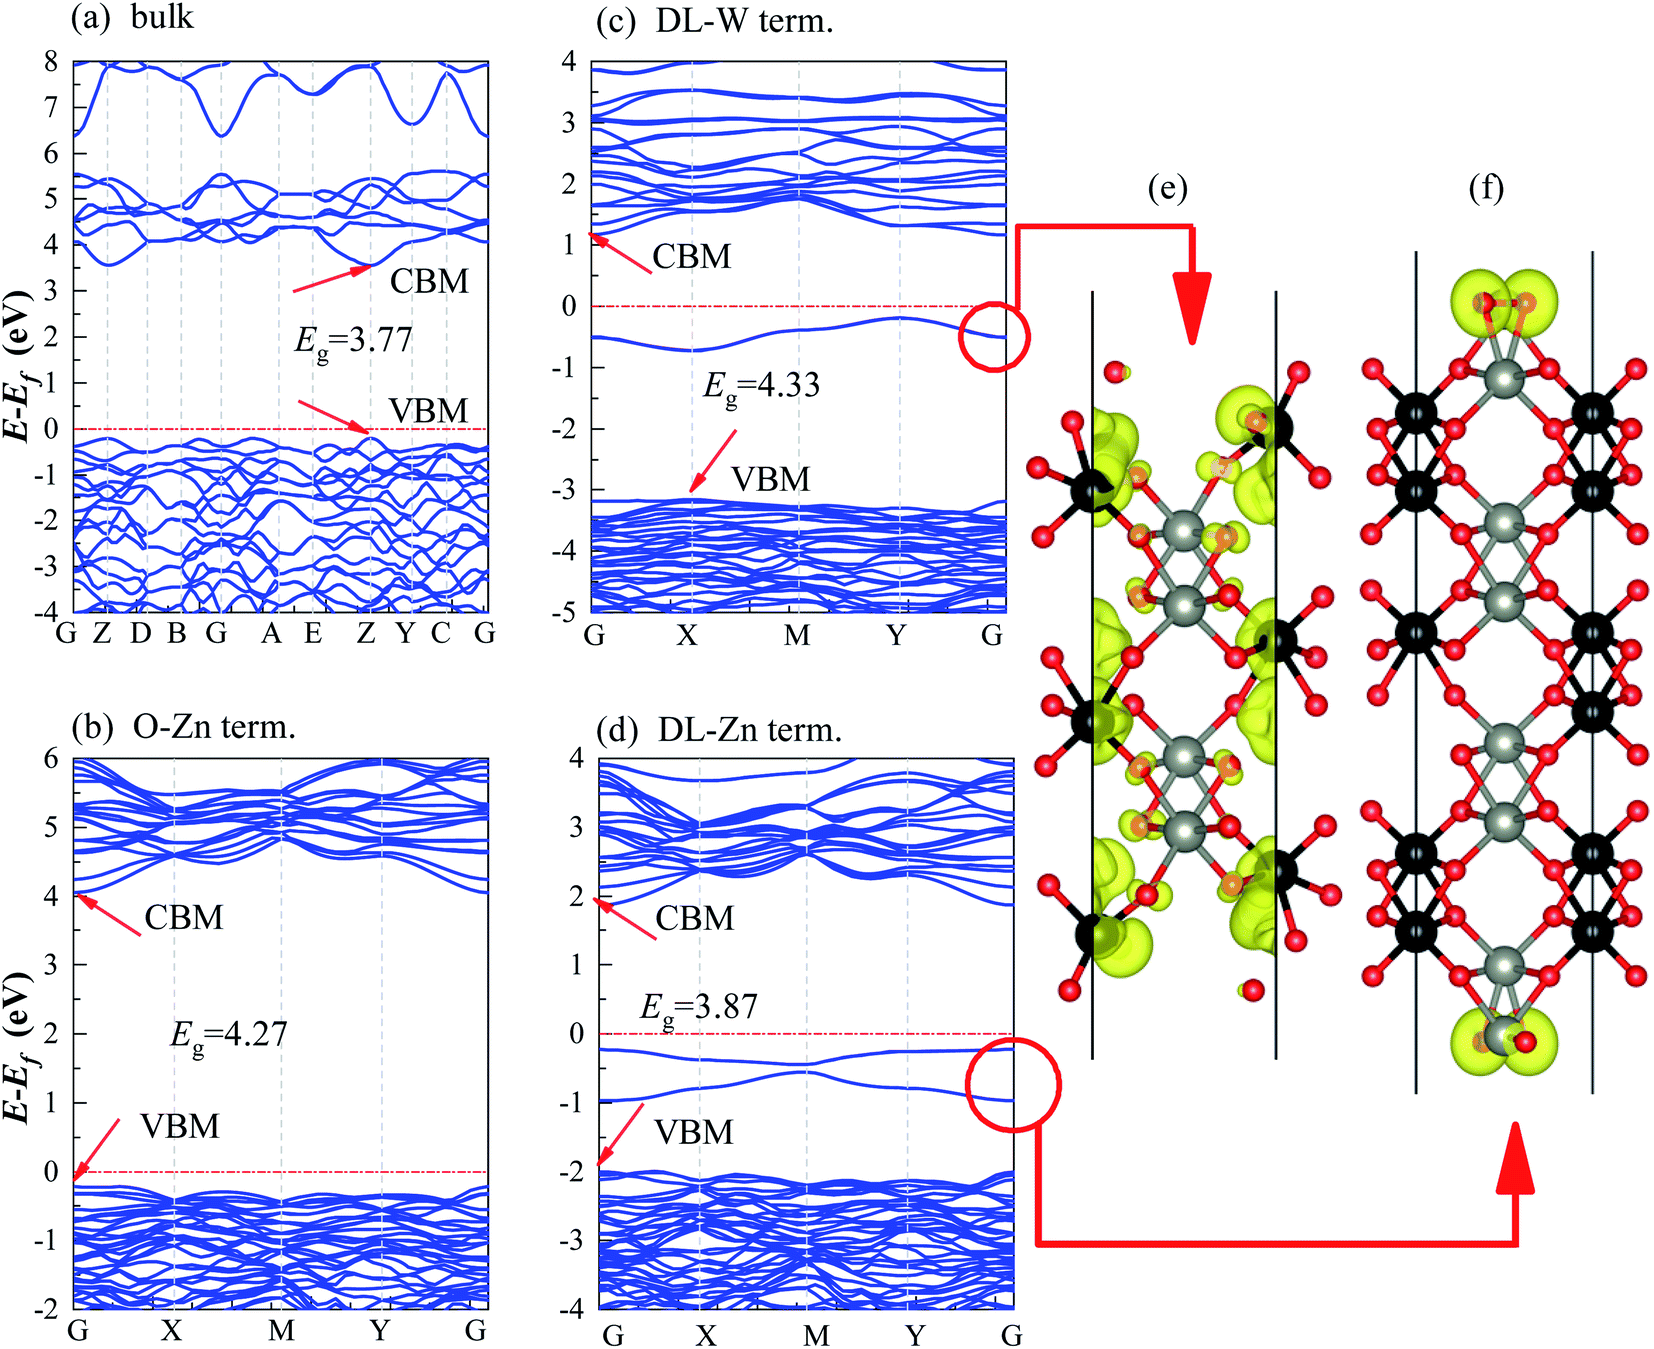 | ||
| Fig. 9 Band structures of (a) bulk ZnWO4 (b) O-Zn term., (c) DL-W term., and (d) DL-Zn term., which were obtained from HSE06 calculations. The Fermi level is set to zero and indicated by a horizontal red dotted-dashed line. (e) and (f) are the partial charge density of the surface states for the DL-W and DL-Zn terminations, respectively. The isosurface values are 0.0018 e Å−3. | ||
 | ||
| Fig. 10 DOS and PDOS of the (a) bulk ZnWO4 (b) O-Zn term., (c) DL-W term., and (d) DL-Zn term., which are obtained from HSE06 calculations. The Fermi level is set to zero and indicated by a perpendicular red dotted-dashed line. | ||
 | ||
| Fig. 11 The layer-resolved density of states of (a) O-Zn term., (b) DL-W term. (c) DL-Zn term., for ZnWO4 (010) surfaces, which are obtained from HSE06 calculations. The Fermi level is set to zero and indicated by a perpendicular red dot-dash line. | ||
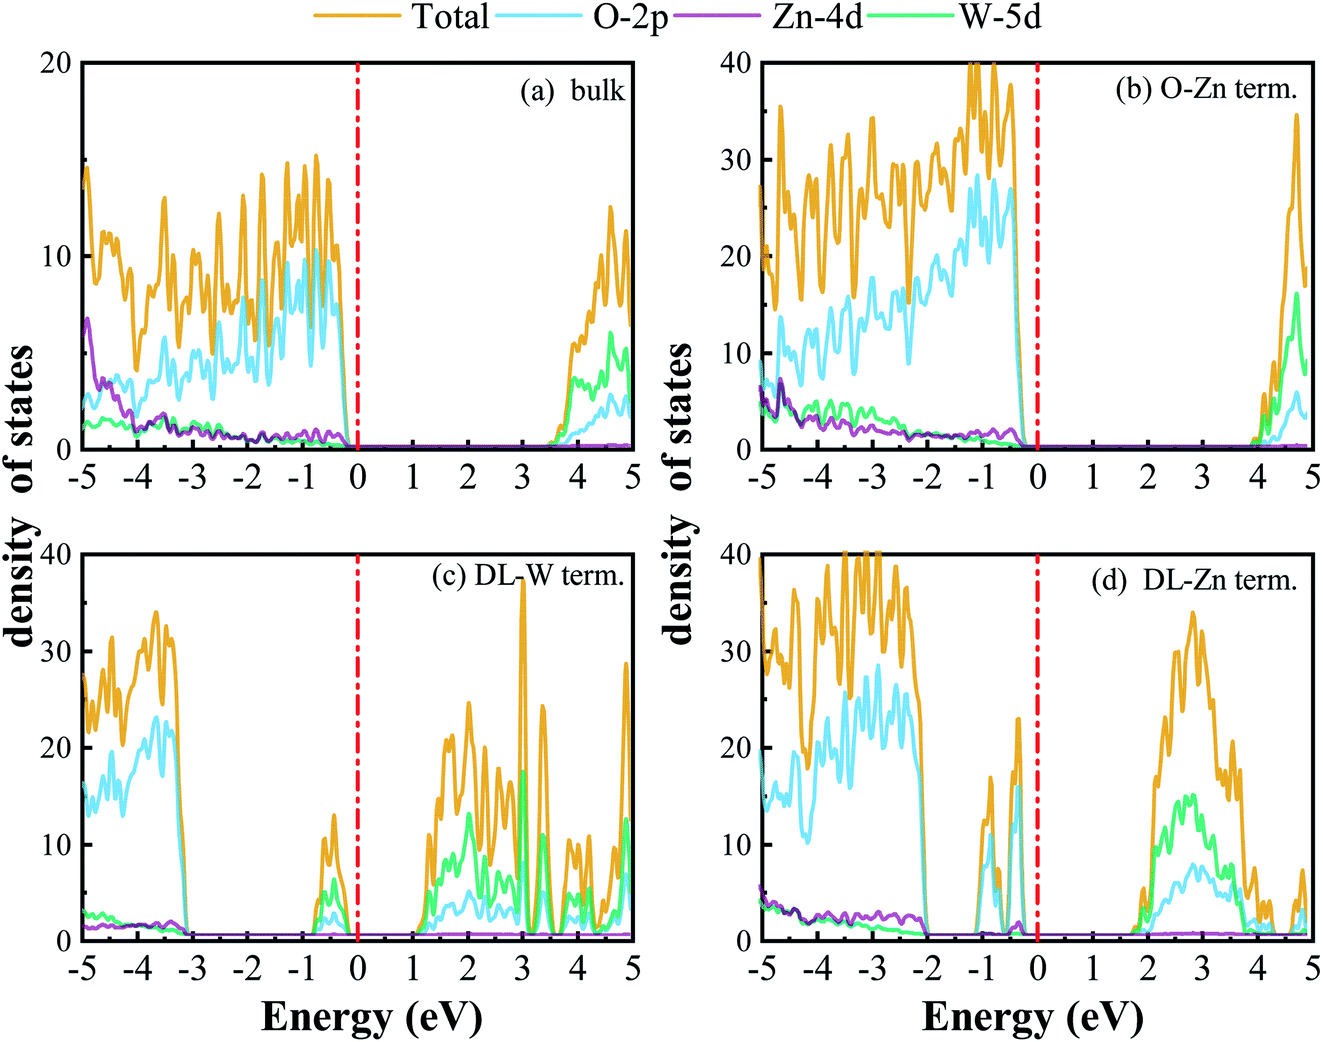
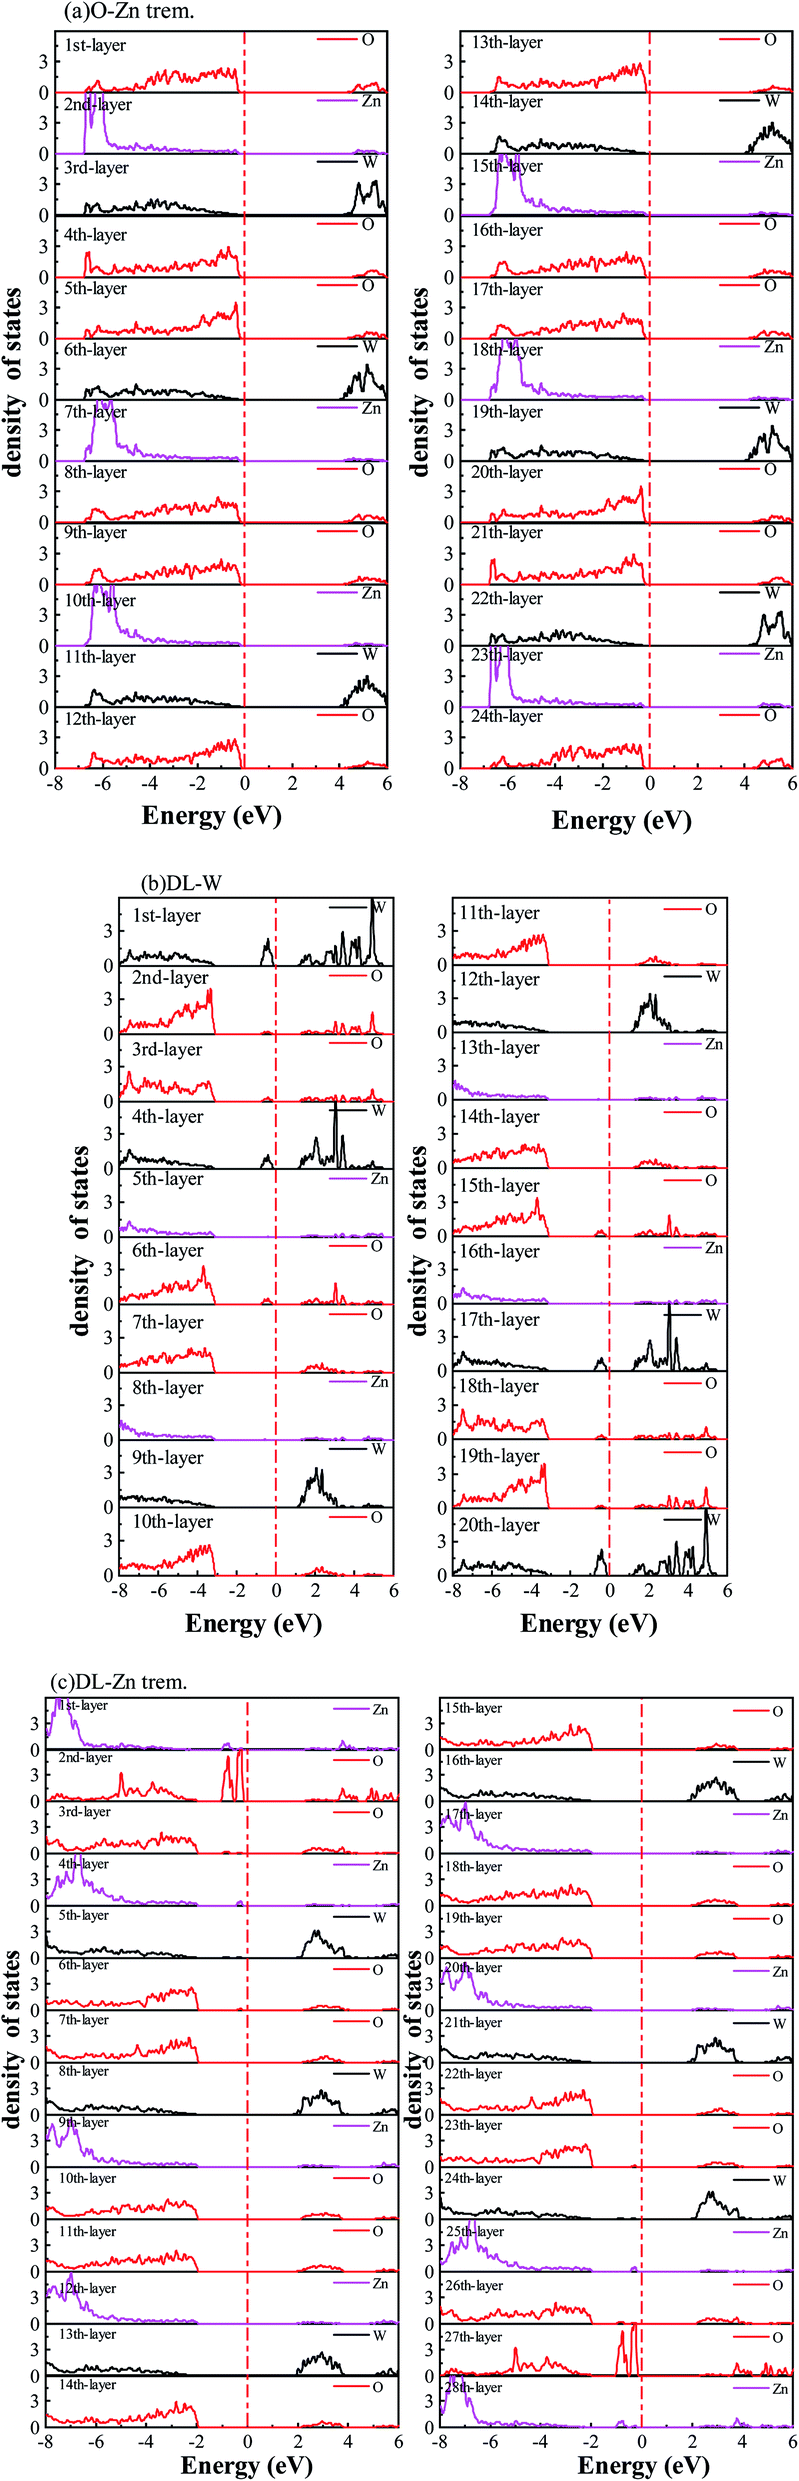
For the stoichiometric O-Zn termination, as shown in Fig. 9(b), it is a direct bandgap semiconductor that agrees with the previous study22 and that of bulk ZnWO4 (Fig. 9(a)). Its bandgap is 4.27 eV, which is larger than that of bulk ZnWO4 (3.77 eV) and the previous GGA + U result (2.91 eV).19 Our result is similar to Sun et al.,22 where the bandgap of ZnWO4 (010) O-Zn termination is calculated using the GGA-PBE functional. The increased bandgap indicated that the onset light absorption edge showed an apparent blue shift. Unfortunately, this large bandgap of the O-Zn termination limits its photo-response to only the ultraviolet (UV) region, which accounts for only 3–5% of the spectrum of solar energy reaching the surface of the earth, thus resulting in very low solar energy conversion efficiencies.56–58 To further prove the absorption edge O-Zn termination is the blue shift, we calculated the frequency-dependent absorption coefficients59,60 of bulk ZnWO4 and O-Zn termination using eqn (A3) given in ESI.† These frequency-dependent absorption coefficients along the [001] direction between 1.25 and 6.0 eV are shown in Fig. S4† using the HSE06 method, with the incident AM1.5G solar spectrum shown for comparison. It could be seen that the absorption edge of the bulk ZnWO4 and O-Zn termination is 3.77 eV and 4.27 eV, respectively. This result further indicates that the absorption edge of O-Zn termination is found to blue shift. Furthermore, from Fig. 10(b), we can see that DOSs of the O-Zn termination are very similar to those of bulk and agree with the previous results.22 As shown in Fig. 11(a), there are no surface states in the LDOS of the O-Zn termination because O-Zn termination did not exhibit any evident reconstruction after geometry optimization.
In Fig. 9(c), the DL-W termination shows the existence of an occupied surface state in the bandgap at −0.15 to −0.75 eV below the Fermi energy. This occupied surface state is primarily dominated by strong hybridization between O 2p and W 5d states (Fig. 10(c)). A more accurate investigation of the electronic properties may be carried out with a study of charge density for this occupied surface state. Thus, we have plotted the partial charge density in the energy range between −0.15 and −0.75 eV below the Fermi level, as shown in Fig. 9(e). Fig. 9(e) shows that the partial charge density distributes around the O atom and W atoms, indicating a delocalized feature, implying that this occupied surface state is a fat band. This is because fat bands have delocalized wave functions, whereas deep levels have localized ones.61 As shown in Fig. 11(b), this fat band is derived from the six top and the six bottom layers of the Zn and O layers, unlike other surface terminations. We predicted that the structural distortions arising from atomic reconstruction at the surface would lead to this fat band (Fig. 2). The most important aspect of the fat bands' existence can be an electron transition bridge between VB and CB. This fat band contributes to visible-light absorption by a two-step optical transition, with the first transition from the VB to the fat band and the second from the fat band to the CB.
There are two occupied surface states in the gap region at −0.15 to −1.0 eV below the Fermi energy (Fig. 9(d)). They are mainly composed of O 2p orbitals (Fig. 10(d)), originating from both the top sublayer and bottom sublayer (Fig. 11(c)). The DL-Zn termination bandgap is 3.87 eV, approximately equal to that of bulk ZnWO4 if we have not considered the surface states. As shown in Fig. 9(f), the partial charge density in the energy range between −0.15 and −1.0 eV below the Fermi level has been plotted to study these occupied surface states further. The result shows that the wave function is localized, only around the O atom. It is suggested that these two occupied surface states be the deep level feature. This occupied deep level can easily trap photogenerated carriers, implying that it might be acting as the recombination center for photo-induced e− and h+ during photocatalysis.62 Similar behaviour is also observed in previous studies.63,64 Accordingly, as discussed previously, the surface-induced localized gap states of the DL-Zn termination are disadvantageous to photocatalytic performance. This is because of the deep defect level as the recombination center.
To verify the above conclusions about the DL-Zn, O-Zn, and DL-W terminations of ZnWO4 (010) surface, side views of the partial charge density of the CBM and VBM for these three structures are shown in Fig. S5(a)–(f).† Comparing Fig. S5(a), (c), (e) with Fig. S5(b), (d), (f),† the CBM of the DL-Zn, O-Zn, and DL-W terminations is combinations of mainly O 2p orbitals and coupled with small amounts of Zn 4d orbitals. However, the VBM is derived from the strong hybridization between the O 2p and W 4d states. These results are in good accordance with the analysis of the band structures, DOS, PDOS, and LDOS in O-Zn, DL-W, and DL-Zn surface terminations.
3.3 The band edge potential
In general, the conduction band (CB) and valence band (VB) edge potentials of a semiconductor play a vital role in the photocatalysis process. The Mulliken electronegativity theory65 can predict the CB and VB potentials of ZnWO4, O-Zn, DL-W, and DL-Zn terminations: ECB = χ − Ec − 0.5Eg, (or EVB = χ − Ec + 0.5Eg), where ECB (EVB) is the conduction (valence) band potential, the χ is the absolute electronegativity of bulk ZnWO4, O-Zn, DL-W, and DL-Zn terminations, Ec is the energy of the free electron in the hydrogen scale (approximately 4.5 eV),66 and Eg is the bandgap energy of the ZnWO4, O-Zn, DL-W, and DL-Zn terminations. The band position and photoelectric thresholds for several compounds have been calculated.55,67–69As regards the Mulliken electronegativity (χ) of compound AaBbCc, it can be calculated according to the following eqn:70,71 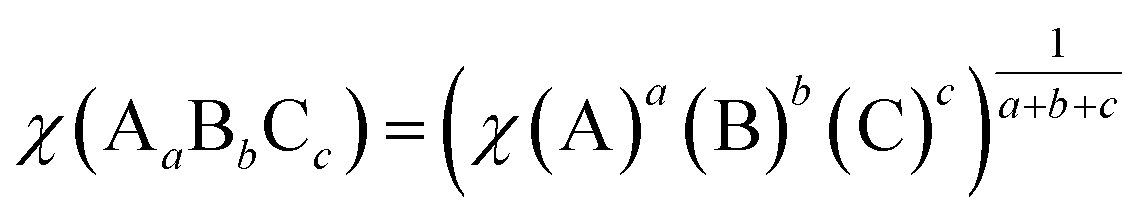 , where χ(A), χ(B), and χ(C) are the absolute electronegativity of the A atoms, B atoms, and C atoms, respectively; the a, b, c are the number of A atoms, B atoms, C atoms in an AaBbCc compound. Based on the Mulliken definition, per atom's absolute electronegativity is equal to the arithmetic mean of the atomic electron affinity (A) and the first ionization energy (I).70 From these data, we obtained the Mulliken electronegativity of Zn, W, and O, which are 4.45, 4.40, and 7.54, respectively.72,73 The χ value for ZnWO4 is 6.31 eV. Therefore, the ECB value of ZnWO4 was calculated to be −0.07 eV, and the EVB value was estimated to be +3.70 eV, which agreed well with the previous calculation.74
The band edge positions for bulk ZnWO4, O-Zn, DL-W, and DL-Zn terminations are presented in Fig. 12. As shown in Fig. 12, the CBM of the DL-Zn termination is raised by 0.05 eV, and the VBM is lowered by 0.05 eV relative to that of the bulk ZnWO4. This result indicated that the oxidizing capacity of VB and the reducing capacity of CB are all increased. Additionally, two occupied surface states are introduced in the bandgap. They are acted as recombination centers for photogenerated electrons–holes, leading to negligible photocatalytic activity. Regarding the O-Zn termination, the CBM is raised by 0.25 eV, and the VBM is lowered by 0.25 eV relative to that of the bulk ZnWO4, suggesting that the oxidizing capacity of VB and the reducing capacity of CB will significantly increase. This is because the bandgap is increased to 3.95 eV. This termination has low photocatalytic efficiency under visible-light irradiation and narrow-light response range because of its large intrinsic bandgap. For DL-W termination, the CBM is raised by 0.28 eV, and the VBM is lowered by 0.27 eV relative to that of the bulk ZnWO4. This result suggested that the oxidizing capacity of VB and the reducing capacity of CB are considerably improved. DL-W termination's CBM band edge position is −0.35 eV, which is favourable for H2 evolution as the CBM edge is located above the water reduction level (H+/H2). Furthermore, DL-W termination's VBM potential is 3.97 eV, which shows a strong potential for O2 generation from water oxidation because of the higher VBM edge concerning the water oxidation level (H2O/O2). More importantly, one occupied surface state is introduced in the bandgap, enhancing the visible-light absorption capacity of ZnWO4(010). This demonstrated that both reduction and oxidation reactions for the evolution of H2 and O2 by water splitting are thermodynamically feasible for the DL-W termination.
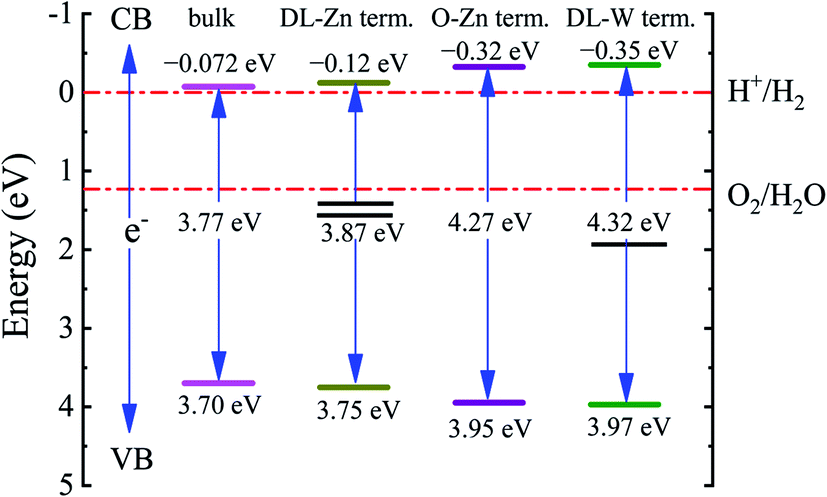 | ||
| Fig. 12 Calculated bandgaps and band edge positions of bulk ZnWO4, DL-Zn term., O-Zn term., and DL-W term. They are obtained from HSE06 calculations. The VBM and CBM values are given concerning the standard redox potentials for water splitting. | ||
3.4 The effective mass
Except for the band edges, the effective masses of the electrons and holes
  are essential factors that affect the separation and diffusion rate of photogenerated carriers.75 In this paper, the effective mass was estimated from the calculated band structures using the HSE06 method. We assume quadratic band dispersion near the CBM and VBM. The effective mass of carriers at the CBM or VBM can be expressed as 1/m* = ∂2E/(ℏ2∂ki∂kj). Where m* is the effective mass of charge carriers in the unit of free-electron mass (m0) and ∂ki∂kj is the coefficient of the second-order term in a quadratic fit of E(k) curves for the band edge corresponding to the wave vector k. Obviously, the smaller the effective mass, the higher the mobility of the charge carrier. According to Drude's model, electron mobility and hole mobility are calculated by μ = eτ/m*, where τ is the scattering time and m* is the effective mass. Here, the scattering time τ is typically in the range of 10−12 to 10−14 s at room temperature in many oxide materials.76,77 Hence, taking τ = 10−14 s, we calculate electron and hole mobility. The calculated results for the effective mass of hole
  and electron
  , and mobility μ are presented in Table 3. Interestingly, we find that the effective mass of hole
  and electron
  near the CBM and VBM for the DL-Zn, O-Zn, and DL-W terminations of ZnWO4 (010) surface are relatively anisotropic. The effective masse of electron
 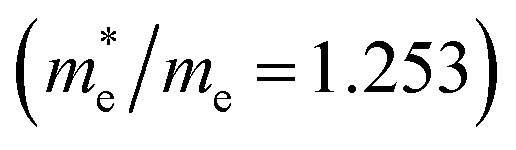 is the smallest in O-Zn termination along the G– > Y direction. Thus its electron mobility μ = 14.04 cm2 V−1 s−1 is the largest. In contrast, the effective masse of the hole
 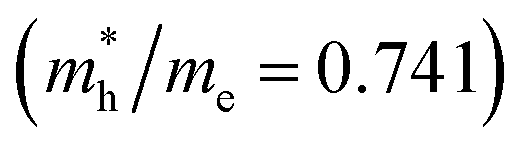 is the smallest in the bulk ZnWO4 along the Z– > E direction, the obtained hole mobility μ = 23.73 cm2 V−1 s−1 is the largest. Note that a high diffusion rate and long lifetime of the carriers are distinctly crucial for high-efficiency photocatalysts.78,79
 and electron
  near the CBM and VBM for the DL-Zn, O-Zn, and DL-W terminations of ZnWO4 (010) surface. The me is the electron rest mass. The μ is electron or hole mobility, in-unit cm2 V−1 s−1
| Compound | Electron | Hole | ||||
|---|---|---|---|---|---|---|
| Path |
|
μ | Path |
|
μ | |
| O-Zn | G– > X | 1.633 | 10.77 | G– > X | 6.843 | 2.57 |
| G– > Y | 1.253 | 14.04 | G– > Y | 0.887 | 19.83 | |
| DL-W | G– > X | 1.521 | 11.56 | X– > G | 5.276 | 3.33 |
| G– > Y | 2.363 | 7.44 | X– > M | 2.902 | 6.06 | |
| DL-Zn | G– > X | 2.071 | 8.49 | G– > X | 2.676 | 6.57 |
| G– > Y | 1.541 | 11.41 | G– > Y | 0.900 | 19.54 | |
| Bulk | Z– > E | 2.207 | 7.97 | Z– > E | 0.741 | 23.73 |
| Z– > Y | 1.328 | 13.24 | Z– > Y | 0.954 | 18.43 | |
4 Conclusions
In this paper, the thermodynamic stabilities of possible termination structures ZnWO4 (010) surface are analyzed by combining the GGA-PBE and HSE06 with the thermodynamics approach. This study is complemented by thermodynamic analysis of the surface stability at different gas pressures and temperatures. Our results suggested that the stable area of the surface terminations of ZnWO4 (010) has little correlation with the functional selected. The stability phase diagram obtained from HSE06 calculations shows that O-Zn, DL-W, and DL-Zn terminations of ZnWO4 (010) surface can be stabilized under certain thermodynamic equilibrium conditions. It is shown that the thermodynamically preferred O-Zn termination is stable at 300 K and 1 atm oxygen partial pressure under the Zn-poor condition. At the same gas pressure and temperature, DL-Zn termination is stable under the Zn-rich condition. However, when the temperature rises to 1000 K and the oxygen partial pressure does not change, DL-W termination is stable under Zn-poor condition, and the O-Zn termination is stable under Zn-rich condition.The HSE06 method gives a much more accurate bandgap compared to the conventional GGA-PBE functional. Based on the HSE06 hybrid functional, electronic structures and the band edge positions are investigated. We find a fat band of the surface states in DL-W termination, which shows a delocalized feature. This fat band acts as an electron transition bridge between VB and CB, and it contributes to visible-light absorption by two-step optical transition with the first transition from VB to the fat band and the second from the fat band to CB. DL-W termination's CBM band edge position is favourable for H2 evolution as the CBM edge is located above the water reduction level (H+/H2). Simultaneously, DL-W termination's VBM potential shows a strong potential for O2 generation from water oxidation due to the higher VBM edge with respect to the water oxidation level (H2O/O2). Based on the analysis mentioned above, our results will help us know which surface terminations are stable under the thermodynamic equilibrium growth conditions and better understand their surfaces' intrinsic properties. They can provide theoretical support for future experimental studies of ZnWO4-based photocatalysts.
Conflicts of interest
There are no conflicts to declare.Acknowledgements
We acknowledge the financial support from the National Key R&D Program of China (Grant No. 2017YFA0303600), the National Natural Science Foundation of China (11974253, 11774248), and the Science and Technology Foundation of Guizhou Province (Grant No. QKHJC[2018]1119).References
- H. Grassmann, H. G. Moser and E. Lorenz, J. Lumin., 1985, 33, 109–113 CrossRef CAS.
- F. Dkhilalli, S. M. Borchani, M. Rasheed, R. Barille, K. Guidara and M. Megdiche, J. Mater. Sci.: Mater. Electron., 2018, 29, 6297–6307 CrossRef CAS.
- Z. Amouzegar, R. Naghizadeh, H. R. Rezaie, M. Ghahari and M. Aminzare, Ceram. Int., 2015, 41, 8352–8359 CrossRef CAS.
- S. C. Sabharwal and Sangeeta, J. Cryst. Growth, 1999, 200, 191–198 CrossRef CAS.
- P. J. Born, D. S. Robertson, P. W. Smith, G. Hames, J. Reed and J. Telfor, J. Lumin., 1981, 24–5, 131–134 CrossRef.
- T. Oi, K. Takagi and T. Fukazawa, Appl. Phys. Lett., 1980, 36, 278–279 CrossRef CAS.
- A. Kalinko, A. Kotlov, A. Kuzmin, V. Pankratov, A. Popov and L. Shirmane, Open Phys., 2011, 9, 432–437 CAS.
- L. V. Uitert and S. Preziosi, J. Appl. Phys., 1962, 33, 2908–2909 CrossRef.
- H. Fu, J. Lin, L. Zhang and Y. Zhu, Appl. Catal., A, 2006, 306, 58–67 CrossRef CAS.
- X. Zhao, W. Yao, Y. Wu, S. Zhang, H. Yang and Y. Zhu, J. Solid State Chem., 2006, 179, 2562–2570 CrossRef CAS.
- Y. C. Zhu, J. G. Lu, Y. Y. Shao, H. S. Sun, J. Li, S. Y. Wang, B. Z. Dong, Z. P. Zheng and Y. D. Zhou, Nucl. Instrum. Methods Phys. Res., Sect. A, 1986, 244, 579–581 CrossRef.
- H. Wang, F. D. Medina, Y. D. Zhou and Q. N. Zhang, Phys. Rev. B: Condens. Matter Mater. Phys., 1992, 45, 10356–10362 CrossRef CAS.
- Y. Wang, L. Liping and G. Li, Appl. Surf. Sci., 2017, 393, 159–167 CrossRef CAS.
- J. Lu, M. Liu, S. Zhou, X. Zhou and Y. Yang, Dyes Pigments, 2017, 136, 1–7 CrossRef CAS.
- X. Zhao and Y. Zhu, Environ. Sci. Technol., 2006, 40, 3367–3372 CrossRef CAS PubMed.
- J. Lin, J. Lin and Y. Zhu, Inorg. Chem., 2007, 46, 8372–8378 CrossRef CAS PubMed.
- A. F. Gouveia, M. Assis, L. S. Cavalcante, E. Longo and J. Andrés, Front. Res. Today, 2018, 1, 1005 CrossRef.
- A. M. Kolpak, D. Li, R. Shao, A. M. Rappe and D. A. Bonnell, Phys. Rev. Lett., 2008, 101, 036102 CrossRef.
- F. Opoku, K. Kuben Govender, C. van Sittert and P. Poomani Govender, Phys. Chem. Chem. Phys., 2017, 19, 28401–28413 RSC.
- V. V. Atuchin, E. N. Galashov, O. Y. Khyzhun, A. S. Kozhukhov, L. D. Pokrovsky and V. N. Shlegel, Cryst. Growth Des., 2011, 11, 2479–2484 CrossRef CAS.
- O. Y. Khyzhun, V. L. Bekenev, V. V. Atuchin, E. N. Galashov and V. N. Shlegel, Mater. Chem. Phys., 2013, 140, 588–595 CrossRef CAS.
- L. Sun, X. Zhao, X. Cheng, H. Sun, Y. Li, P. Li and W. Fan, Chem. Eng. J., 2012, 211–212, 168–178 CrossRef CAS.
- L. Sun, X. Zhao, C.-J. Jia, Y. Zhou, X. Cheng, P. Li, L. Liu and W. Fan, J. Mater. Chem., 2012, 22, 23428 RSC.
- P. Li, X. Zhao, C.-j. Jia, H. Sun, L. Sun, X. Cheng, L. Liu and W. Fan, J. Mater. Chem. A, 2013, 1, 3421–3429 RSC.
- P. F. S. Pereira, A. F. Gouveia, M. Assis, R. C. de Oliveira, I. M. Pinatti, M. Penha, R. F. Goncalves, L. Gracia, J. Andres and E. Longo, Phys. Chem. Chem. Phys., 2018, 20, 1923–1937 RSC.
- Y. Wu, J. Zhang, B. Long and H. Zhang, Appl. Surf. Sci., 2021, 548, 149053 CrossRef CAS.
- P. E. Blochl, Phys. Rev. B: Condens. Matter Mater. Phys., 1994, 50, 17953–17979 CrossRef.
- G. Kresse and J. Hafner, Phys. Rev. B: Condens. Matter Mater. Phys., 1993, 47, 558–561 CrossRef CAS PubMed.
- G. Kresse and J. Furthmuller, Phys. Rev. B: Condens. Matter Mater. Phys., 1996, 54, 11169–11186 CrossRef CAS PubMed.
- J. P. Perdew and Y. Wang, Phys. Rev. B: Condens. Matter Mater. Phys., 1992, 45, 13244–13249 CrossRef PubMed.
- P. Mori-Sanchez, A. J. Cohen and W. Yang, Phys. Rev. Lett., 2008, 100, 146401 CrossRef PubMed.
- J. Heyd, G. E. Scuseria and M. Ernzerhof, J. Chem. Phys., 2003, 118, 8207–8215 CrossRef CAS.
- A. V. Krukau, O. A. Vydrov, A. F. Izmaylov and G. E. Scuseria, J. Chem. Phys., 2006, 125, 224106 CrossRef.
- M. Bonanni, L. Spanhel, M. Lerch, E. Füglein, G. Müller and F. Jermann, Chem. Mater., 1998, 10, 304–310 CrossRef CAS.
- V. Wang, N. Xu, J. C. Liu, G. Tang and W. T. Geng, arXiv:1908.08269v2, 2019.
- K. Momma and F. Izumi, J. Appl. Crystallogr., 2011, 44, 1272–1276 CrossRef CAS.
- D. M. Trots, A. Senyshyn, L. Vasylechko, R. Niewa, T. Vad, V. B. Mikhailik and H. Kraus, J. Phys.: Condens. Matter, 2009, 21, 325402 CrossRef CAS PubMed.
- Y. A. Mantz, J. Phys. Chem. C, 2016, 120, 7522–7531 CrossRef CAS.
- E. Heifets, J. Ho and B. Merinov, Phys. Rev. B: Condens. Matter Mater. Phys., 2007, 75, 155431 CrossRef.
- K. Reuter and M. Scheffler, Phys. Rev. B: Condens. Matter Mater. Phys., 2001, 65, 035406 CrossRef.
- M. Geng and H. Jónsson, J. Phys. Chem. C, 2018, 123, 464–472 CrossRef.
- E. Heifets, E. A. Kotomin, A. A. Bagaturyants and J. Maier, Phys. Chem. Chem. Phys., 2019, 21, 3918–3931 RSC.
- H. Zhang, A. Soon, B. Delley and C. Stampfl, Phys. Rev. B: Condens. Matter Mater. Phys., 2008, 78, 045436 CrossRef.
- J. William E. Acree and J. S. Chickos, NIST Chemistry Webbook, NIST standard reference database No. 69, National Institute of Standards and Technology, Gaithersburg, MD, 2018, accessed 10 May 2021, E-mail: http://webbook.nist.gov/chemistry Search PubMed.
- K. Johnston, M. R. Castell, A. T. Paxton and M. W. Finnis, Phys. Rev. B: Condens. Matter Mater. Phys., 2004, 70, 085415 CrossRef.
- E. Heifets, S. Piskunov, E. A. Kotomin, Y. F. Zhukovskii and D. E. Ellis, Phys. Rev. B: Condens. Matter Mater. Phys., 2007, 75, 115417 CrossRef.
- E. Heifets, E. A. Kotomin, A. A. Bagaturyants and J. Maier, Phys. Chem. Chem. Phys., 2017, 19, 3738–3755 RSC.
- Y. A. Mastrikov, E. Heifets, E. A. Kotomin and J. Maier, Surf. Sci., 2009, 603, 326–335 CrossRef CAS.
- J. Ho, E. Heifets and B. Merinov, Surf. Sci., 2007, 601, 490–497 CrossRef CAS.
- I. Dellien, F. M. Hall and L. G. Hepler, Chem. Rev., 1976, 76, 283–310 CrossRef CAS.
- W. M. Haynes, CRC Handbook of Chemistry and Physics, CRC press, 2014 Search PubMed.
- S. Phapale, D. Das and R. Mishra, J. Chem. Thermodyn., 2013, 63, 74–77 CrossRef CAS.
- S. Nosé, J. Chem. Phys., 1984, 81, 511–519 CrossRef.
- W. Z. Yao, J. H. Zhang, Y. X. Wang and F. Z. Ren, Appl. Surf. Sci., 2018, 435, 1351–1360 CrossRef CAS.
- J. Zhang, F. Ren, M. Deng and Y. Wang, Phys. Chem. Chem. Phys., 2015, 17, 10218–10226 RSC.
- G. W. An, M. A. Mahadik, G. Piao, W. S. Chae, H. Park, M. Cho, H. S. Chung and J. S. Jang, Appl. Surf. Sci., 2019, 480, 1–12 CrossRef CAS.
- A. L. Linsebigler, G. Q. Lu and J. T. Yates, Chem. Rev., 1995, 95, 735–758 CrossRef CAS.
- G. Liu, Y. Zhao, C. Sun, F. Li, G. Q. Lu and H. M. Cheng, Angew. Chem., Int. Ed. Engl., 2008, 47, 4516–4520 CrossRef CAS PubMed.
- J. Zhang, J. X. Cao, X. Chen, J. W. Ding, P. Zhang and W. Ren, Phys. Rev. B: Condens. Matter Mater. Phys., 2015, 91, 045417 CrossRef.
- S. Saha, T. P. Sinha and A. Mookerjee, Phys. Rev. B: Condens. Matter Mater. Phys., 2000, 62, 8828–8834 CrossRef CAS.
- W.-J. Yin, S.-H. Wei, M. M. Al-Jassim, J. Turner and Y. Yan, Phys. Rev. B: Condens. Matter Mater. Phys., 2011, 83, 155102 CrossRef.
- X. Ma, B. Lu, D. Li, R. Shi, C. Pan and Y. Zhu, J. Phys. Chem. C, 2011, 115, 4680–4687 CrossRef CAS.
- H. Zhang, L. Liu and Z. Zhou, RSC Adv., 2012, 2, 9224–9229 RSC.
- W.-W. Dai and Z.-Y. Zhao, Mater. Chem. Phys., 2017, 193, 164–176 CrossRef CAS.
- M. A. Butler and D. S. Ginley, J. Electrochem. Soc., 1978, 125, 228–232 CrossRef CAS.
- S. R. Morrison, Electrochemistry at Semiconductor and Oxidized Metal Electrodes, Springer US, Plenum Press, New York, NY, USA, 1st edn, 1980 Search PubMed.
- Y. K. Lim, E. W. Keong Koh, Y.-W. Zhang and H. Pan, J. Power Sources, 2013, 232, 323–331 CrossRef CAS.
- J. Zhang, M. Deng, F. Ren, Y. Wu and Y. Wang, RSC Adv., 2016, 6, 12290–12297 RSC.
- J. Zhang, P. Deng, M. Deng, H. Shen, Z. Feng and H. Li, ACS Omega, 2020, 5, 29081–29091 CrossRef CAS.
- F. El Halouani and A. Deschanvres, Mater. Res. Bull., 1982, 17, 1045–1052 CrossRef CAS.
- J. Gao, W. Zeng, B. Tang, M. Zhong and Q.-J. Liu, Mater. Sci. Semicond. Process., 2021, 121, 105447 CrossRef CAS.
- T. Andersen, H. K. Haugen and H. Hotop, J. Phys. Chem. Ref. Data, 1999, 28, 1511–1533 CrossRef CAS.
- C. Kittel, Introduction To Solid State Physics, Wiley India Pvt. Limited, 8th edn, 2005 Search PubMed.
- A. Thomas, C. Janaky, G. F. Samu, M. N. Huda, P. Sarker, J. P. Liu, V. van Nguyen, E. H. Wang, K. A. Schug and K. Rajeshwar, ChemSusChem, 2015, 8, 1652–1663 CrossRef CAS PubMed.
- X. Chen, S. Shen, L. Guo and S. S. Mao, Chem. Rev., 2010, 110, 6503–6570 CrossRef CAS PubMed.
- K. E. Kweon and G. S. Hwang, Phys. Rev. B: Condens. Matter Mater. Phys., 2013, 87, 205202 CrossRef.
- C.-W. Chen, Y.-C. Lin, C.-H. Chang, P. Yu, J.-M. Shieh and C.-L. Pan, IEEE J. Quant. Electron., 2010, 46, 1746–1754 CAS.
- Z. Ma, Z. Yi, J. Sun and K. Wu, J. Phys. Chem. C, 2012, 116, 25074–25080 CrossRef CAS.
- X. Zhang, B. Li, J. Wang, Y. Yuan, Q. Zhang, Z. Gao, L.-M. Liu and L. Chen, Phys. Chem. Chem. Phys., 2014, 16, 25854–25861 RSC.
Footnote |
| † Electronic supplementary information (ESI) available. See DOI: 10.1039/d1ra03218f |
| This journal is © The Royal Society of Chemistry 2021 |