 Open Access Article
Effect of heteroatoms on the optical properties and enzymatic activity of N-doped carbon dots†
Ahyun Lee‡
,
Sohee Yun‡,
Eun Soo Kang‡,
Jung Wan Kim,
Jeong Ho Park and
Jin-sil Choi*
Dept. of Chemical and Biological Engineering, Hanbat National University, 125 Dongseodaero Yuseonggu, Daejeon 34158, Republic of Korea. E-mail: jinsil.choi@hanbat.ac.kr
First published on 25th May 2021
Abstract
Carbon dots (CDs) are attractive nanomaterials because of their facile synthesis, biocompatibility, superior physicochemical properties, and low cost of their precursors. Recent advances in CDs have particularly relied on the modulation of their properties by heteroatom doping (e.g., nitrogen). Although nitrogen-doped CDs (N-CDs) have attracted considerable attention owing to their different properties compared to those of the original CDs, the effects of the heteroatom content and types of bonding on the properties of N-doped CDs remain underexplored. In this work, we prepared N-CDs with controlled nitrogen contents, and fully examined their optical properties, enzymatic activity, and toxicity. We demonstrate that (i) the type of carbon–heteroatom bonding (i.e., carbon–oxygen and carbon–nitrogen bonds) can be altered by changing the ratio of carbon to heteroatom sources, and (ii) both the heteroatom content and the heteroatom-bonding character significantly influence the properties of the doped CDs. Notably, N-CDs exhibited higher quantum yields and peroxidase-like activities than the non-doped CDs. Furthermore, the negatively charged N-CDs exhibited negligible cytotoxicity. Such comprehensive investigations on the physicochemical properties of N-CDs are expected to guide the design of N-CDs for targeted applications.
Introduction
Carbon dots (CDs) are an emerging class of nanomaterials that have attracted immense attention owing their easy accessibility through simple and low-cost synthetic processes, excellent optical properties, and biocompatibility.1–4 Such new materials have great potential for a variety of applications, including cell labeling,5–7 medical therapy,8,9 sensing,10 catalysis,11,12 energy,1,13–16 and energy storage.14,15 In particular, one of the most attractive advantages of CDs is that their physicochemical properties can be tuned by controlling their size, surface state, and intrinsic electronic structures.1–4 In this context, much effort has been devoted to the design and fabrication of heteroatom-doped CDs (e.g., N-, B-, and S-doped CDs) and their application.1,17,18 Among the heteroatom-doped CDs, nitrogen-doped CDs (N-CDs) are the most frequently utilized platform, because the nitrogen atoms are known to alter the edge states,19,20 energy levels,21–23 physicochemical properties,6,13,17,19–22,24–31 and even catalytic activities9,11,32–34 of the CDs. However, the effects of the heteroatom content and chemical bonding in CDs on their properties under subtle variation of the synthetic conditions are not fully understood. In this work, we prepared a series of N-CDs by reacting citric acid with ethylenediamine at different ratios, and evaluated the optical properties and chemical composition of the resulting N-CDs. In addition, we also examined the enzyme-like activity of each N-CD in the series, and the influences of the N-doping type and N content on the catalytic activity. Finally, we also evaluated the toxicity of the N-CDs for assessing their potential applicability in biological studies.Experimental section
Reagents
Citric acid (99.9%), ethylenediamine (>98%), quinine sulfate (98.0%), H2O2, 3,3′,5,5′-tetramethylbenzidine (TMB, 97%), and 3-(4,5-dimethylthiazol-2-yl)-2,5-diphenyltetrazolium bromide (MTT) assay kit were purchased from Sigma-Aldrich, and used as received.Synthesis of N-CDs
N-CDs were prepared by a hydrothermal method. In a typical synthesis, citric acid (10 μmol) and ethylenediamine (2.5–15 μmol) were dissolved in deionized water (15 mL), and the mixture was heated hydrothermally in a Teflon-equipped stainless steel autoclave at 200 °C. After 1 h, the mixture was cooled to room temperature, and the residue was purified by column chromatography (CombiFlash NextGen 100, Teledyne ISCO) to obtain a brown N-CD sample. The molar ratios of citric acid and ethylenediamine: N-CD_1 = 1/1.5; N-CD_2 = 1/1; N-CD_3 = 1/0.5; N-CD_4 = 1/0.33; N-CD_5 = 1/0.25.Characterization
The morphology and lattice distance of N-CDs were investigated by transmission electron microscopy (TEM). A Tecnai G2 F30 S-Twin system (FEI, Netherlands) and H-7650 system (Hitachi, Japan) installed in the Center for University-wide Research Facilities (CURF) at the Jeonbuk National University. X-ray diffraction (XRD) was performed on a Miniflex Benchtop X-ray diffractometer (Rigaku). The chemical functional groups and composition of the N-CDs were investigated by Fourier-transform infrared (FTIR) spectrometry (Nicolet 6700, Thermo, USA) and X-ray photoelectron spectrometry (XPS, K-Alpha+, Thermo Fisher Scientific, USA), respectively. Absorption and fluorescence spectra of the N-CDs were recorded on a UV-Vis spectrophotometer (Lambda 1050, PerkinElmer) and fluorescence spectrometer (QM-400, HORIBA), respectively. The fluorescence lifetime was measured using a fluorescence lifetime spectrometer (FL920, Edinburgh Instruments, United Kingdom).Quantum yield (QY) measurements
The relative quantum yield of the N-CDs was calculated as follows:
 | (1) |
Enzyme-mimicking activities of N-CDs
The peroxidase-like activity was measured using TMB as the substrate. Specifically, a 1 M H2O2 solution, 100 μM TMB solution, and 500 μg mL−1 N-CD suspension were added to a phosphate buffer (10 mM, pH 2), and the mixture was shaken thoroughly. The absorption of the sample at 652 nm was measured immediately using a multi-mode plate reader (SpectraMax M2e, Molecular Devices, LLC, USA). The Michaelis–Menten equation provides the relationship between the initial velocity, V, and the substrate concentration, [S].
 | (2) |
 | (3) |
Upon plotting 1/V against 1/[S], the ordinate intercept of the curve represents the inverse of Vmax and the abscissa intercept represents −1/Km. Thus, Km and Vmax were estimated.
MTT assay
The biocompatibility and cytotoxicity of the N-CDs were evaluated using human lung cancer cells (A549) via the MTT assay. A549 cells (2 × 10⁵ cells per well) were cultured overnight in a 96-well microtiter plate in 5% CO2 atmosphere at 37 °C. The wells were charged with a cell medium containing N-CDs or CDs (15.6, 31.3, 62.5, 125.0, 250.0, and 500.0 μg mL−1, respectively), and incubated for 24 h. Then, 10 μL of the MTT solution was added to each well (final concentration: 0.5 mg mL−1). After incubation for 4 h, formazan, which is generated from the reduction of MTT by NAD(P)H-dependent oxidoreductase in living cells, was dissolved in the solubilization solution of the kit. The absorbance at 550 nm was obtained using a microplate reader (SpectraMax M2e, Molecular Devices, LLC, USA).Results and discussion
N-CDs were synthesized by a hydrothermal method (Fig. 1) by varying the ratio of citric acid (carbon source) to ethylenediamine (nitrogen source) from 1![[thin space (1/6-em)]](https://www.rsc.org/images/entities/char_2009.gif) :
:![[thin space (1/6-em)]](https://www.rsc.org/images/entities/char_2009.gif) 1.5 (N-CD_1) to 1
1.5 (N-CD_1) to 1![[thin space (1/6-em)]](https://www.rsc.org/images/entities/char_2009.gif) :
:![[thin space (1/6-em)]](https://www.rsc.org/images/entities/char_2009.gif) 1 (N-CD_2), 1
1 (N-CD_2), 1![[thin space (1/6-em)]](https://www.rsc.org/images/entities/char_2009.gif) :
:![[thin space (1/6-em)]](https://www.rsc.org/images/entities/char_2009.gif) 0.5 (N-CD_3), 1
0.5 (N-CD_3), 1![[thin space (1/6-em)]](https://www.rsc.org/images/entities/char_2009.gif) :
:![[thin space (1/6-em)]](https://www.rsc.org/images/entities/char_2009.gif) 0.3 (N-CD_4), and 1
0.3 (N-CD_4), and 1![[thin space (1/6-em)]](https://www.rsc.org/images/entities/char_2009.gif) :
:![[thin space (1/6-em)]](https://www.rsc.org/images/entities/char_2009.gif) 0.25 (N-CD_5). The so-obtained brown N-CDs dispersed well in water (Fig. 1a). The TEM images in Fig. 1b and c reveal that N-CD_3 has a spherical morphology with a diameter of 5.9 ± 1.3 nm; further, it is found to be partial crystalline with a lattice distance of 0.2 nm, which matches with the (100) plane of graphite.20,21 However, a partial amorphous region is also observed at the edge site. The sizes of N-CD_1, 2, 4, 5, and non-doped CD samples were determined to be 13.7 ± 4.1, 4.9 ± 0.9, 7.8 ± 2.7, 4.5 ± 1.1, and 6.5 ± 1.8 nm, respectively (Fig. S1 and S2†). XRD patterns of the N-CD series display a broad diffraction peak, confirming their amorphous character (Fig. S3†).
0.25 (N-CD_5). The so-obtained brown N-CDs dispersed well in water (Fig. 1a). The TEM images in Fig. 1b and c reveal that N-CD_3 has a spherical morphology with a diameter of 5.9 ± 1.3 nm; further, it is found to be partial crystalline with a lattice distance of 0.2 nm, which matches with the (100) plane of graphite.20,21 However, a partial amorphous region is also observed at the edge site. The sizes of N-CD_1, 2, 4, 5, and non-doped CD samples were determined to be 13.7 ± 4.1, 4.9 ± 0.9, 7.8 ± 2.7, 4.5 ± 1.1, and 6.5 ± 1.8 nm, respectively (Fig. S1 and S2†). XRD patterns of the N-CD series display a broad diffraction peak, confirming their amorphous character (Fig. S3†).
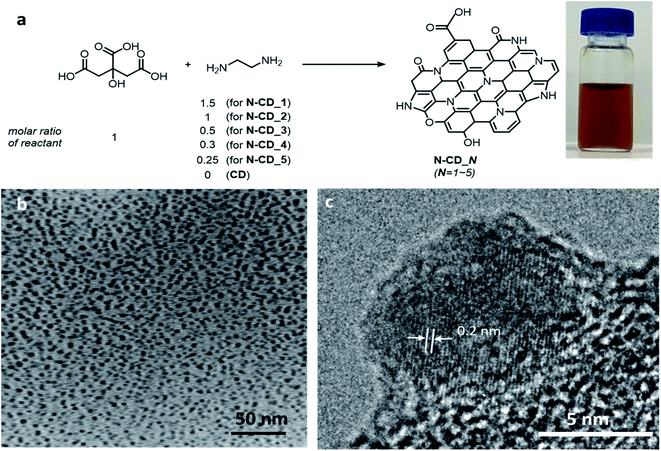 | ||
| Fig. 1 (a) Schematics of the synthesis of N-doped carbon dots (N-CDs) and a photograph of the as-synthesized N-CD sample suspended in water. (b) Low- and (c) high-resolution TEM images of N-CD_2. | ||
Comparison of the FT-IR spectra of N-CDs with those of citric acid and ethylenediamine indicated the appearance of new peaks at 1673 and 1549–1410 cm−1, corresponding to the C![[double bond, length as m-dash]](https://www.rsc.org/images/entities/char_e001.gif) C stretching of conjugated alkenes and C–N stretching of aromatic amines, respectively (Fig. S4†). In addition, new peaks corresponding to N–O and C
C stretching of conjugated alkenes and C–N stretching of aromatic amines, respectively (Fig. S4†). In addition, new peaks corresponding to N–O and C![[double bond, length as m-dash]](https://www.rsc.org/images/entities/char_e001.gif) N appeared at 1546 and 1783 cm−1, respectively, in the spectra of the N-CD series. The obtained N-CDs have a net negative charge owing to the presence of abundant –COOH groups derived from citric acid (Fig. S5†). The chemical composition of the N-CD series was further examined by XPS (Fig. 2). The XPS survey profiles of all the N-CD samples (Fig. 2a and S6†) exhibit C1s, N1s, and O1s signals. However, the peak intensity ratios are significantly different between the samples. Interestingly, N-CD_2 and N-CD_4 show the highest peak intensities of N1s and O1s, respectively, while N-CD_4 shows the lowest peak intensity of C1s. To gain more information about the chemical bonding of the different atoms, high-resolution C1s, N1s, and O1s spectra of the samples were analyzed by spectral peak fitting based on the reported binding energies of the chemical bonds, as demonstrated in Fig. 2b–d, respectively. First, the C1s spectra of all the N-CD samples show a strong peak at 284 eV, corresponding to C–C and C
N appeared at 1546 and 1783 cm−1, respectively, in the spectra of the N-CD series. The obtained N-CDs have a net negative charge owing to the presence of abundant –COOH groups derived from citric acid (Fig. S5†). The chemical composition of the N-CD series was further examined by XPS (Fig. 2). The XPS survey profiles of all the N-CD samples (Fig. 2a and S6†) exhibit C1s, N1s, and O1s signals. However, the peak intensity ratios are significantly different between the samples. Interestingly, N-CD_2 and N-CD_4 show the highest peak intensities of N1s and O1s, respectively, while N-CD_4 shows the lowest peak intensity of C1s. To gain more information about the chemical bonding of the different atoms, high-resolution C1s, N1s, and O1s spectra of the samples were analyzed by spectral peak fitting based on the reported binding energies of the chemical bonds, as demonstrated in Fig. 2b–d, respectively. First, the C1s spectra of all the N-CD samples show a strong peak at 284 eV, corresponding to C–C and C![[double bond, length as m-dash]](https://www.rsc.org/images/entities/char_e001.gif) C bonds, along with a peak at 285.5 eV for the C–N bond, indicating N doping, and a peak at 288.2 eV for C
C bonds, along with a peak at 285.5 eV for the C–N bond, indicating N doping, and a peak at 288.2 eV for C![[double bond, length as m-dash]](https://www.rsc.org/images/entities/char_e001.gif) O. The peaks of CC–C and CC
O. The peaks of CC–C and CC![[double bond, length as m-dash]](https://www.rsc.org/images/entities/char_e001.gif) C represent the C atoms of the carbogenic sp2 core, while the peaks of carbon–heteroatom bonds (i.e., C–N and C
C represent the C atoms of the carbogenic sp2 core, while the peaks of carbon–heteroatom bonds (i.e., C–N and C![[double bond, length as m-dash]](https://www.rsc.org/images/entities/char_e001.gif) O) indicate the functional groups at the edge region of the N-CDs. Among the N-CD samples, N-CD_2, 3, and 4 exhibit a relatively high intensity ratio of carbon–heteroatom bonds over carbon–carbon bonds. Non-doped CDs show strong peaks at 288.8 eV (C
O) indicate the functional groups at the edge region of the N-CDs. Among the N-CD samples, N-CD_2, 3, and 4 exhibit a relatively high intensity ratio of carbon–heteroatom bonds over carbon–carbon bonds. Non-doped CDs show strong peaks at 288.8 eV (C![[double bond, length as m-dash]](https://www.rsc.org/images/entities/char_e001.gif) O and C–O) and 284 eV (C–C and C
O and C–O) and 284 eV (C–C and C![[double bond, length as m-dash]](https://www.rsc.org/images/entities/char_e001.gif) C). Meanwhile, the N1s spectra (Fig. 2c) of all the N-CDs show a strong peak of Npyrrole (399.5 eV), which is located at the edge sites of the carbogenic domain. The peak of Ngraphite (401 eV) located within the sp2-carbon domain appeared in the spectra of N-CD_2, 3, 4, and 5.35–37 Furthermore, the O1s spectra consist of two peaks corresponding to C–O and C
C). Meanwhile, the N1s spectra (Fig. 2c) of all the N-CDs show a strong peak of Npyrrole (399.5 eV), which is located at the edge sites of the carbogenic domain. The peak of Ngraphite (401 eV) located within the sp2-carbon domain appeared in the spectra of N-CD_2, 3, 4, and 5.35–37 Furthermore, the O1s spectra consist of two peaks corresponding to C–O and C![[double bond, length as m-dash]](https://www.rsc.org/images/entities/char_e001.gif) O bonds (532.6 and 531.1 eV, respectively), with the OC
O bonds (532.6 and 531.1 eV, respectively), with the OC![[double bond, length as m-dash]](https://www.rsc.org/images/entities/char_e001.gif) O peak being predominant in all N-CD samples, owing to the polymerization of the material through amide bond formation.38,39 On the other hand, OC–O peak is dominant in the spectrum of the non-doped CD.
O peak being predominant in all N-CD samples, owing to the polymerization of the material through amide bond formation.38,39 On the other hand, OC–O peak is dominant in the spectrum of the non-doped CD.
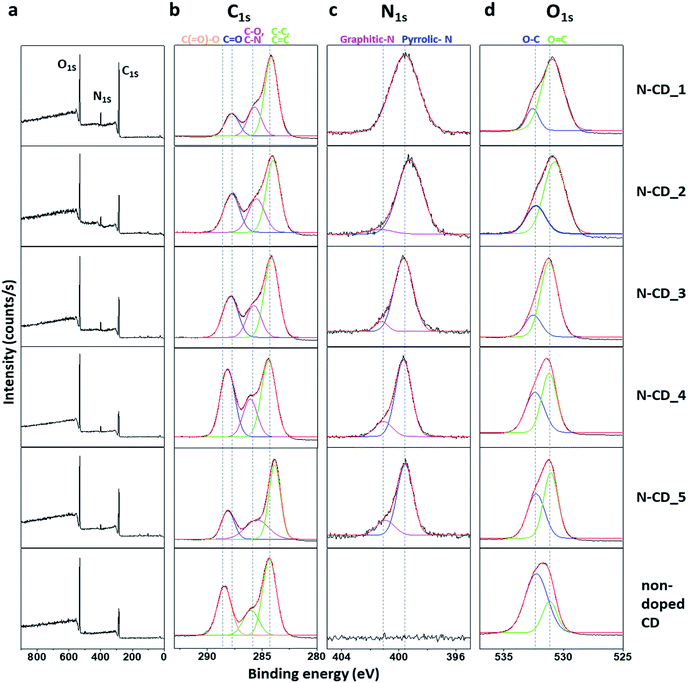 | ||
| Fig. 2 (a) XPS survey scans and high-resolution (b) C 1s, (c) N 1s, and (d) O 1s spectra of N-CDs and non-doped CD. | ||
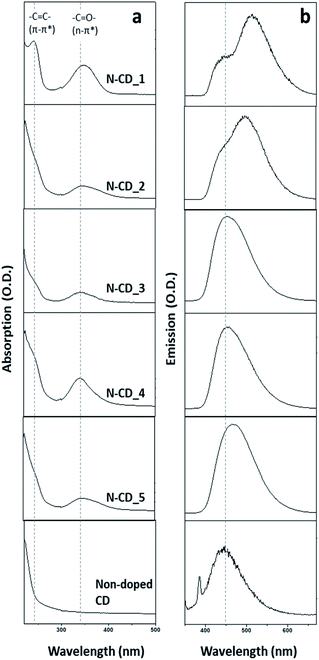
Next, the optical properties of the N-CDs were investigated (Fig. 3). A new absorption band at 340 nm (C![[double bond, length as m-dash]](https://www.rsc.org/images/entities/char_e001.gif) O, n → π*) and a shoulder band at 240 nm (–C
O, n → π*) and a shoulder band at 240 nm (–C![[double bond, length as m-dash]](https://www.rsc.org/images/entities/char_e001.gif) C–, π → π*) appeared in all the UV-Vis spectra of N-CD samples as compared to that of the non-doped CD. The absorption band at 340 nm is assigned to the n–π* transition arising from the edge transition of the N-CD samples, while the shoulder band at 240 nm originates from the π–π* transition at the sp2 carbogenic domain. Non-doped CDs showed negligible absorption band at 340 nm owing to the small quantity of C
C–, π → π*) appeared in all the UV-Vis spectra of N-CD samples as compared to that of the non-doped CD. The absorption band at 340 nm is assigned to the n–π* transition arising from the edge transition of the N-CD samples, while the shoulder band at 240 nm originates from the π–π* transition at the sp2 carbogenic domain. Non-doped CDs showed negligible absorption band at 340 nm owing to the small quantity of C![[double bond, length as m-dash]](https://www.rsc.org/images/entities/char_e001.gif) O bonds in the particle. The photoluminescence (PL) spectrum of each N-CD sample (λex = 350 nm) was found to be distinct. On one hand, N-CD_1 and N-CD_2 showed two emission bands. The PL peaks of N-CD_1 appeared at 450 nm and 517 nm, while those of N-CD_2 appeared at 450 nm and 500 nm. On the other hand, N-CD_3, 4, and 5 exhibited only one emission peak. N-CD_3 and N-CD_4 showed a peak at 450 nm, which is the first emission peak observed for N-CD_1, N-CD_2, and non-doped CD, while N-CD_5 showed a red-shifted emission band at 464 nm. It is known that Ngraphite can induce red-shifted emission, whereas Npyrrole does not affect the bandgap of the π-conjugated carbogenic domains.20,23,26 However, in our study, red-shifted emissions were observed with N-CD_1, 2, and 5, which mostly contain Npyrrole along with a small quantity of other functional groups (Ngraphite). Considering that increasing the number of edge functional groups in N-CDs results in a decrease in the size of the π-conjugated carbogenic domains,18 it can be inferred that N-CD_3 and 4, which have a relatively low C content, emit high-energy light owing to the small size of their carbogenic domain. The red-shifted emissions of N-CD_1, 2, and 5 could be attributed to the expanded size of the π-conjugated carbogenic domains with a relatively less amount of the dopant.18,24
O bonds in the particle. The photoluminescence (PL) spectrum of each N-CD sample (λex = 350 nm) was found to be distinct. On one hand, N-CD_1 and N-CD_2 showed two emission bands. The PL peaks of N-CD_1 appeared at 450 nm and 517 nm, while those of N-CD_2 appeared at 450 nm and 500 nm. On the other hand, N-CD_3, 4, and 5 exhibited only one emission peak. N-CD_3 and N-CD_4 showed a peak at 450 nm, which is the first emission peak observed for N-CD_1, N-CD_2, and non-doped CD, while N-CD_5 showed a red-shifted emission band at 464 nm. It is known that Ngraphite can induce red-shifted emission, whereas Npyrrole does not affect the bandgap of the π-conjugated carbogenic domains.20,23,26 However, in our study, red-shifted emissions were observed with N-CD_1, 2, and 5, which mostly contain Npyrrole along with a small quantity of other functional groups (Ngraphite). Considering that increasing the number of edge functional groups in N-CDs results in a decrease in the size of the π-conjugated carbogenic domains,18 it can be inferred that N-CD_3 and 4, which have a relatively low C content, emit high-energy light owing to the small size of their carbogenic domain. The red-shifted emissions of N-CD_1, 2, and 5 could be attributed to the expanded size of the π-conjugated carbogenic domains with a relatively less amount of the dopant.18,24
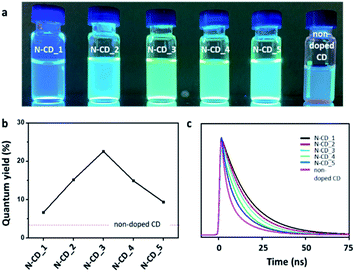
Further, all the N-CDs displayed blue fluorescence under the excitation of 340 nm UV light, as shown in Fig. 4a. However, their emission brightness at the same concentration varied depending on the sample. To investigate the effect of the N dopant on the optical properties of N-CDs, we measured the QY of each N-CD (λex = 350 nm; λem = 450 nm; Fig. 4b). The QYs of the five N-CD samples (N-CD_1 to 5) were estimated to be 6.6, 15.1, 22.6, 14.9, and 9.3%, respectively; they are higher than that of the non-doped CD (QY: ∼3%). To gain further insights into the exciton recombination dynamics, the time-resolved PL decay was recorded (λex = 350 nm; λem = 450 nm; Fig. 4c). All the N-CDs showed a dual exponential PL decay, and the PL lifetimes (τ1/τ2) of N-CD_1 to 5 were determined to be 7.4/29.8, 6.2/24.9, 5.7/23.0, 5.0/20.0, and 4.8/19.5 ns, respectively. Evidently, the PL lifetimes of the N-CD samples are longer than that of the non-doped CD (τ1 = 4.2 ns and τ2 = 17.05 ns) because the surface passivation of the CD by N-doping can decrease the nonradiative recombination and self-trapping of excitons.3,18,40 The QY of the N-CDs decreased with a decrease in the N content (N-CD_3 to 5), and the lifetime was shortened. Interestingly, the QYs of N-CD_1 and 2 were found to be lower than that of N-CD_3, although their PL lifetimes were longer. This phenomenon may be attributed to the large quantity of N dopant, which can generate long-lived defect states at the surface of N-CDs.41–44 Thus, the N-dopant content in the N-CDs is a critical factor that affects their optical properties, and according to our evaluation, N-CD_3 is the most effective candidate as an optical probe.
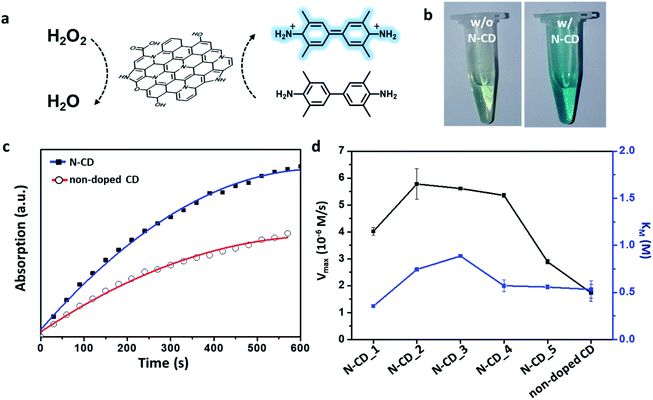
Next, we explored the application of N-CDs as a nanozyme platform. A nanozyme is a material that can catalyze enzymatic reactions; it exhibits similar enzymatic kinetics and mechanism to those of natural enzymes.8 As N-CDs have been reported to mimic the peroxidase enzyme,11 we evaluated the peroxidase-like activities of our N-CDs by monitoring the oxidation of TMB with H2O2 in their presence at pH 2 (Fig. 5a). The addition of N-CDs to a solution of H2O2 and TMB resulted in a color change from pale green to blue, indicating the oxidation of TMB (Fig. 5b). The absorbance of the TMB solution at 652 nm originates from oxidized TMB, whose quantity increases gradually as a result of the enzymatic reaction in the presence of the N-CDs as well as the non-doped CD. The measured absorbance eventually saturated after a sufficient reaction time, as in the case of a natural enzymatic reaction (Fig. 5c). Remarkably, the N-CDs showed a faster rate of TMB oxidation than the non-doped CD. To acquire the kinetic parameters related to the activity of N-CDs, the steady-state kinetics of the reaction was studied by measuring the absorbance at 652 nm at different H2O2 concentrations. The maximum initial velocity (Vmax) and Michaelis constant (Km) of the reaction in the presence of N-CDs were calculated based on the Lineweaver–Burk equation (Fig. 5d). All the N-CDs provided higher Vmax values than the non-doped CD, and the Vmax of the N-CDs increased in the order of N-CD_5, 1, 4, 3, and 2. In particular, N-CD_2, 3, and 4 showed ca. 2.5–3 times higher Vmax values than that of the non-doped CD. Notably, the initial reaction velocities in the presence of N-CD_1 and 5 were relatively lower than those in the presence of other N-CDs. The Km value, which represents the affinity between a substrate and enzyme, was found to be similar, regardless of the N-doping characteristic of the N-CD sample. According to our observations, the bond character of the heteroatom in the N-CDs affects Vmax rather than Km. The C![[double bond, length as m-dash]](https://www.rsc.org/images/entities/char_e001.gif) O groups, which are present in abundance in N-CDs, are reported to act as the catalytic sites.34,45 Thus, most of the N-CDs exhibited higher Vmax than that of non-doped CD, which is rich C–O groups than in C
O groups, which are present in abundance in N-CDs, are reported to act as the catalytic sites.34,45 Thus, most of the N-CDs exhibited higher Vmax than that of non-doped CD, which is rich C–O groups than in C![[double bond, length as m-dash]](https://www.rsc.org/images/entities/char_e001.gif) O groups. In addition, the graphitic N atoms help adsorb molecular oxygen to generate radical oxygen species on nearby carbon atoms.9,11,32,46 Consequently, an N-CD sample with graphitic N and abundant C
O groups. In addition, the graphitic N atoms help adsorb molecular oxygen to generate radical oxygen species on nearby carbon atoms.9,11,32,46 Consequently, an N-CD sample with graphitic N and abundant C![[double bond, length as m-dash]](https://www.rsc.org/images/entities/char_e001.gif) O groups showed a relatively high peroxidase-like activity. On the other hand, because the pyrrole moiety does not have extra electrons that can interact with H2O2, N-CD_1 and N-CD_5, which mostly contain Npyrrole, exhibited low catalytic activities.26 Although N-CD_5 has graphitic N atoms, its Ngraphite content is not sufficient to significantly improve the enzymatic activity, considering the N-doping degree shown in Fig. S6.† Therefore, the chemical composition of heteroatom-containing functional groups in N-CDs is an important factor for optimizing their enzymatic properties.
O groups showed a relatively high peroxidase-like activity. On the other hand, because the pyrrole moiety does not have extra electrons that can interact with H2O2, N-CD_1 and N-CD_5, which mostly contain Npyrrole, exhibited low catalytic activities.26 Although N-CD_5 has graphitic N atoms, its Ngraphite content is not sufficient to significantly improve the enzymatic activity, considering the N-doping degree shown in Fig. S6.† Therefore, the chemical composition of heteroatom-containing functional groups in N-CDs is an important factor for optimizing their enzymatic properties.
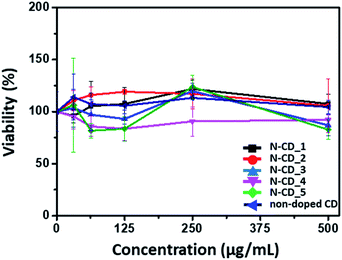
Finally, we investigated the toxicity of the N-CDs to assess if the N-CD platform can be applied in biological studies by evaluating the viability of human lung cancer cells, A549 cells, in the presence of the N-CDs and non-doped CD. As shown in Fig. 6, none of the N-CDs exhibited significant toxicity to the cells up to a concentration of 500 μg mL−1. In fact, while the doping of N in the N-CDs could induce a local positive charge, the negatively charged N-CDs obtained in this study, owing to the usage of citric acid as the carbon source, may not disturb or interact significantly with the cell membrane, thus inducing negligible cellular toxicity.
Conclusions
The characteristics of N-CDs suitable for their optical applications or for use as nanozymes were demonstrated by rationalizing the relationship between the dopant content (e.g., the amount of doped N and types of chemical bonding) and physicochemical properties. The negligible cellular toxicity of the obtained N-CDs was also demonstrated, revealing their suitability for biological applications. As the doping content and bonding character are altered at the synthesis stage, an understanding of the correlation between the synthetic condition and heteroatom doping in N-CDs would be useful for producing N-CDs with desired features. Comprehensive investigations on the physicochemical properties of the N-CDs may provide further guidelines for the rational design of optimally performing N-CDs.Conflicts of interest
There are no conflicts to declare.Acknowledgements
This work was supported by the newly appointed professor research fund of Hanbat National University in 2018 and the National Research Foundation of Korea (NRF) grant funded by the Korea government (MSIT) (2020R1C1C1011863 and 2020R1A5A8017671).References
- Y. Choi, Y. Choi, O.-H. Kwon and B.-S. Kim, Chem.–Asian J., 2018, 13, 586–598 CrossRef CAS.
- B. Yao, H. Huang, Y. Liu and Z. Kang, Trends Chem., 2019, 1, 235–246 CrossRef CAS.
- M. L. Liu, B. B. Chen, C. M. Li and C. Z. Huang, Green Chem., 2019, 21, 449–471 RSC.
- R. Das, R. Bandyopadhyay and P. Pramanik, Mater. Today Chem., 2018, 8, 96–109 CrossRef CAS.
- R. Atchudan, T. N. J. I. Edison, M. G. Sethuraman and Y. R. Lee, Appl. Surf. Sci., 2016, 384, 432–441 CrossRef CAS.
- Y. He, L. Liang, Q. Liu, J. Guo, D. Liang and H. Liu, RSC Adv., 2017, 7, 56087–56092 RSC.
- X. Wang, D. Wang, Y. Guo, C. Yang, A. Iqbal, W. Liu, W. Qin, D. Yan and H. Guo, Dalton Trans., 2015, 44, 5547–5554 RSC.
- K. Fan, J. Xi, L. Fan, P. Wang, C. Zhu, Y. Tang, X. Xu, M. Liang, B. Jiang, X. Yan and L. Gao, Nat. Commun., 2018, 9, 1440 CrossRef PubMed.
- Y. Zhang, Y. Jin, H. Cui, X. Yan and K. Fan, RSC Adv., 2020, 10, 10–20 RSC.
- J.-X. Wu and B. Yan, Dalton Trans., 2017, 4745, 7098–7105 RSC.
- Y. Hu, X. J. Gao, Y. Zhu, F. Muhammad, S. Tan, W. Cao, S. Lin, Z. Jin, X. Gao and H. Wei, Chem. Mater., 2018, 30, 6431–6439 CrossRef CAS.
- M. J. Lázaro, S. Ascaso, S. Pérez-Rodríguez, J. C. Calderón, M. E. Gálvez, M. Jesús Nieto, R. Moliner, A. Boyano, D. Sebastián, C. Alegre, L. Calvillo and V. Celorrio, C. R. Chim., 2015, 18, 1229–1241 CrossRef.
- X. T. Feng, F. Zhang, Y. L. Wang, Y. Zhang, Y. Z. Yang and X. G. Liu, Appl. Phys. Lett., 2015, 107, 213102 CrossRef.
- V. C. Hoang, K. Dave and V. G. Gomes, Nano Energy, 2019, 66, 104093 CrossRef CAS.
- C. Hu, M. Li, J. Qiu and Y.-P. Sun, Chem. Soc. Rev., 2019, 48, 2315–2337 RSC.
- H. Ming, Z. Ma, Y. Liu, K. Pan, H. Yu, F. Wang and Z. Kang, Dalton Trans., 2012, 41, 9526–9531 RSC.
- J. Manioudakis, F. Victoria, C. A. Thompson, L. Brown, M. Movsum, R. Lucifero and R. Naccache, J. Mater. Chem. C, 2019, 7, 853–862 RSC.
- X. Kou, S. Jiang, S.-J. Park and L.-Y. Meng, Dalton Trans., 2020, 49, 6915–6938 RSC.
- L. Li and T. Dong, J. Mater. Chem. C, 2018, 6, 7944–7970 RSC.
- X. Miao, D. Qu, D. Yang, B. Nie, Y. Zhao, H. Fan and Z. Sun, Adv. Mater., 2018, 30, 1704740 CrossRef PubMed.
- D. Mombrú, M. Romero, R. Faccio and Á. W. Mombrú, Phys. E, 2019, 113, 130–136 CrossRef.
- J. Schneider, C. J. Reckmeier, Y. Xiong, M. von Seckendorff, A. S. Susha, P. Kasák and A. L. Rogach, J. Phys. Chem. C, 2017, 121, 2014–2022 CrossRef CAS.
- K. Holá, M. Sudolská, S. Kalytchuk, D. Nachtigallová, A. L. Rogach, M. Otyepka and R. Zbořil, ACS Nano, 2017, 11, 12402–12410 CrossRef PubMed.
- S. Barman and M. Sadhukhan, J. Mater. Chem., 2012, 22, 21832 RSC.
- H. Wang, P. Gao, Y. Wang, J. Guo, K.-Q. Zhang, D. Du, X. Dai and G. Zou, APL Mater., 2015, 3, 086102 CrossRef.
- S. Sarkar, M. Sudolská, M. Dubecký, C. J. Reckmeier, A. L. Rogach, R. Zbořil and M. Otyepka, J. Phys. Chem. C, 2016, 120, 1303–1308 CrossRef CAS.
- Y. R. Park, H. Y. Jeong, Y. S. Seo, W. K. Choi and Y. J. Hong, Sci. Rep., 2017, 7, 46422 CrossRef CAS PubMed.
- R. Shi, Z. Li, H. Yu, L. Shang, C. Zhou, G. I. N. Waterhouse, L.-Z. Wu and T. Zhang, ChemSusChem, 2017, 10, 4650–4656 CrossRef CAS PubMed.
- A. A. Kokorina, A. A. Bakal, D. V. Shpuntova, A. Yu. Kostritskiy, N. V. Beloglazova, S. De Saeger, G. B. Sukhorukov, A. V. Sapelkin and I. Y. Goryacheva, Sci. Rep., 2019, 9, 14665 CrossRef.
- M. Xu, S. Xu, Z. Yang, M. Shu, G. He, D. Huang, L. Zhang, L. Li, D. Cui and Y. Zhang, Nanoscale, 2015, 7, 15915–15923 RSC.
- S. Bhattacharyya, F. Ehrat, P. Urban, R. Teves, R. Wyrwich, M. Döblinger, J. Feldmann, A. S. Urban and J. K. Stolarczyk, Nat. Commun., 2017, 8, 1401 CrossRef PubMed.
- Z. Lou, S. Zhao, Q. Wang and H. Wei, Anal. Chem., 2019, 91, 15267–15274 CrossRef CAS PubMed.
- Q. Chen, S. Li, Y. Liu, X. Zhang, Y. Tang, H. Chai and Y. Huang, Sens. Actuators, B, 2020, 305, 127511 CrossRef CAS.
- H. Sun, A. Zhao, N. Gao, K. Li, J. Ren and X. Qu, Angew. Chem., Int. Ed., 2015, 54, 7176–7180 CrossRef CAS PubMed.
- We believe nitrogen atoms distribute homogenously in our N-CD system based on the ref. 36 and 37 describing the homogeneous distribution of nitrogen atoms in the whole nitrogen-doped carbon-based materials regardless of types of functional groups based on STEM-EDX mapping studies.
- J.-H. Wee, C. H. Kim, H.-S. Lee, G. B. Choi, D.-W. Kim, C.-M. Yang and Y. A. Kim, Sci. Rep., 2019, 9, 20170 CrossRef CAS PubMed.
- E. Haque, M. M. Islam, E. Pourazadi, M. Hassan, S. N. Faisal, A. K. Roy, K. Konstantinov, A. T. Harris, A. I. Minett and V. G. Gomes, RSC Adv., 2015, 5, 30679–30686 RSC.
- P. Duan, B. Zhi, L. Coburn, C. L. Haynes and K. Schmidt-Rohr, Magn. Reson. Chem., 2020, 58, 1130–11389 CrossRef CAS PubMed.
- R. C. So, J. E. Sanggo, L. Jin, J. M. A. Diaz, R. A. Guerrero and J. He, ACS Omega, 2017, 2, 5196–5208 CrossRef CAS PubMed.
- H. Zheng, P. Zheng, L. Zheng, Y. Jiang, Z. Wu, F. Wu, L. Shao, Y. Liu and Y. Zhang, J. Phys. Chem. C, 2018, 122, 29613–29619 CrossRef CAS.
- C.-Q. Wang, J.-X. Xia, M. U. Ali, M. Liu, W. Lu and H. Meng, Mater. Sci. Semicond. Process., 2019, 92, 96–102 CrossRef CAS.
- N. T. Hien, T. T. K. Chi, N. D. Vinh, H. T. Van, L. D. Thanh, P. V. Do, V. P. Tuyen and N. X. Ca, J. Lumin., 2020, 217, 116822 CrossRef CAS.
- B. Xu, T. Zhang, X. Lin, H. Yang, X. Jin, Z. Huang, Z. Zhang, D. Li and Q. Li, Opt. Mater. Express, 2020, 10, 1232–1240 CrossRef CAS.
- M. S. Mehata and T. C. Wang, Dalton Trans., 2019, 4845, 7619–7631 RSC.
- S.-C. Wei, Y.-W. Lin and H.-T. Chang, J. Food Drug Anal., 2020, 28, 559–575 CrossRef.
- H. Zhang, S. Hwang, M. Wang, Z. Feng, S. Karakalos, L. Luo, Z. Qiao, X. Xie, C. Wang, D. Su, Y. Shao and G. Wu, J. Am. Chem. Soc., 2017, 139, 14143–14149 CrossRef CAS PubMed.
Footnotes |
| † Electronic supplementary information (ESI) available: TEM images, size histogram, XRD, IR spectra, zeta-potential, and atomic percentage based on XPS spectra of N-CDs and none-doped CD. See DOI: 10.1039/d1ra03175a |
| ‡ These authors contribute equally. |
| This journal is © The Royal Society of Chemistry 2021 |

