 Open Access Article
Rapid hydrothermal synthesis of hierarchical ZSM-5/beta composite zeolites†
Guang Xiong *a,
Feifei Meng
 a,
Jiaxu Liu
 a,
Liping Liua and
Leping Zhaob
aState Key Laboratory of Fine Chemicals, School of Chemical Engineering, Dalian University of Technology, Dalian, 116024, China. E-mail: gxiong@dlut.edu.cn; Fax: +86-411-84986340
bDalian Research Institute of Petroleum and Petrochemicals, SINOPEC Dalian, 116024, China. E-mail: zhaoleping.fshy@sinopec.com
First published on 16th June 2021
Abstract
An innovative hydrothermal method has been successfully applied to the synthesis of hierarchical ZSM-5/beta composite zeolites with different mass ratios. Firstly, the ZSM-5 zeolites were coated with amorphous silica and aluminum species by a spray drying process. Then, the precursor powder was hydrothermally crystallized for only 1–2 days with the addition of tetraethyl ammonium hydroxide (TEAOH). The obtained products were characterized by XRD, SEM, TEM, N2 physical adsorption–desorption, 27Al MAS NMR, ICP, pyridine-IR and NH3-TPD techniques. The characterization results imply that the ZSM-5/beta composite zeolites exhibit hierarchical-pores, higher external surface areas and larger mesopore volumes as compared to those of the pure ZSM-5 and beta zeolite. Moreover, the pore structure and acid sites of the ZSM-5/beta composite can be adjusted by changing the mass ratio of ZSM-5/beta. Finally, the ZSM-5/beta composite catalysts exhibit good catalytic performances in the cracking of 1,3,5-triisopropylbenzene (1,3,5-TIPB).
Introduction
ZSM-5 zeolite is a porous silicoaluminate with a unique two-dimensional structure of 10-membered ring channels.1 ZSM-5 has been widely used in the fields of catalysis, adsorption and separation in industry because of its excellent features such as strong acidity, superior hydrothermal stability, unique shape selectivity and so on.2,3 Nevertheless, owing to its small pore size (0.55–0.56 nm), ZSM-5 possesses a diffusional limitation towards large bulky molecules.4,5 The restricted mass transfer leads to the formation of carbon deposition, which further blocks the microporous channels of the zeolite.6–8 To reduce the impact of the diffusion limitation, the research has been focused on the large-pore zeolites such as beta.9 Zeolite beta is a BEA type zeolite with a three-dimensional structure of 12-membered ring channels.10,11 Beta is generally regarded as an ideal organic macromolecular cracking catalyst due to its larger pores, but its hydrothermal stability and acidity are weak.12 Therefore, effort should be devoted to develop the composite zeolites with hierarchical pores to combine the advantages of ZSM-5 and beta.13In recent years, the fabrication of the composite zeolites with binary structure has been attracting particular attention owing to their potential applications in catalysis.14 The composite zeolites can not only combine the advantages of two individual zeolites, but also create the innovative catalytic properties.15–18 The pore structures, acidities and compositions of the composite zeolites can be altered in a desired way so that the diffusion can be effectively improved.19,20 Accordingly, compared with the pure zeolite, the composite zeolites could improve the catalytic performance. For example, Fan et al.21 found that the ZSM-5/SAPO-11 composite zeolites fabricated by the in situ growth method have larger mesoporosity and suitable acidity, which accelerates mass diffusion and increases synergistic effect between Brønsted and Lewis acid sites. Liu et al.22 synthesized the SAPO-34/ZSM-5 composite by a microwave-assisted hydrothermal synthesis method. The catalysts exhibited higher catalytic activity, stability and selectivity to light olefins in MTO reaction owing to the synergetic effect of interface phase together with suitable acid sites and pore structure. Wang et al.23 prepared ZSM-11/ZSM-5 composite zeolites by adding cetyltrimethylammonium bromide (CTAB) and seed. The composite zeolites exhibit hierarchical pores, higher specific surface areas, larger mesopore volumes, more acid sites and distinct catalytic performances in the reaction of methanol to hydrocarbons. However, it is still a great challenge to further precisely control the composition, pore structure and acidity of the composite zeolites. To solve the problems, an innovative hydrothermal synthesis of ZSM-5/beta composite zeolites has been explored.
The spray drying route is a kind of effective method for the synthesis of micron-sized spherical particles with hierarchical porosity and uniform distribution of components.24–26 During the spray drying process, the morphology, composition and structure of the products can be regulated by changing the drying temperature, carrier gas pressure and flow rate. Recently, our group has combined the spray drying technology with hydrothermal method for the synthesis of various zeolites such as ZSM-5, beta, TS-1 and so on. Based on the previous results, the new method can not only reduce the discharge of waste water, but also reduce the crystallization time and the amount of template by using the spray dried powder as the precursor for the further crystallization.27–31 The spray drying-assisted hydrothermal method might be suitable to synthesize composite zeolites for the following reasons: the spray drying method can bind the different materials together through self-assembly in a rapid drying process. Moreover, the obtained solid precursor can be further crystallized in a super dense synthesis system, thus avoid the problem of two-phase separation.32 Therefore, the spray drying-assisted hydrothermal method might be an efficient and simple technique to synthesize composite zeolites.
In this study, we report the synthesis of the hierarchical ZSM-5/beta composite zeolites with different mass ratios using a spray drying-assisted hydrothermal method for the first time. The optimal synthesis conditions of the ZSM-5/beta composite were determined. Furthermore, the physicochemical properties such as the pore structure, morphology, acid sites and so on were also investigated by various characterization techniques. Finally, the catalytic performance of the ZSM-5/beta composite zeolites was evaluated by the cracking of 1,3,5-TIPB.
Experimental
Materials
The raw materials for the synthesis of the ZSM-5/beta composite zeolites are: sodium aluminate (NaAlO2, 41.0 wt% Al2O3, Sinopharm Chemical Reagent Co. Ltd), colloidal silica (30.0 wt% SiO2, Qingdao Cheng Yu Chemical Co., Ltd), tetraethylammonium hydroxide (TEAOH, 25 wt% in water, Tianjin Guangfu Fine Chemical Research Institute). All reactants above were used without further purification. In addition, DNZ-H ZSM-5 zeolites (SiO2/Al2O3 = 28, Qiwangda Chemical Technology Co. Ltd, Dalian) were used as a reference.Synthesis of ZSM-5/beta composite zeolites
The ZSM-5/beta composite zeolites were synthesized by a two-step procedure. At the first step, the ZSM-5 zeolites were coated with amorphous silica-aluminum species by a spray drying process. The synthesis was performed as follows: sodium aluminate (NaAlO2, 2 g) and colloidal silica (60 g) were dissolved in deionized water (420 g). The initial solution was stirred at room temperature until sodium aluminate (NaAlO2) and colloidal silica were completely dissolved. The initial molar composition was 1SiO2:0.04Al2O3:0.04Na2O:78H2O. Then the calcined commercial ZSM-5 nanoaggregates (DNZ-H, SiO2/Al2O3 = 28) with the average particle size of 1.8 μm (the single crystal size of 50–200 nm) were added in the solution with various weight percents (30%, 50%, 70%). After that the suspension was left stirring vigorously at room temperature for at least 2–3 h. Finally, the obtained precursor suspension was atomized via a spray drying apparatus (BILON-6000Y, Shanghai BILON Instrument Co., Ltd.). The conditions for the spray drying were as follows: drying temperature of 473 K, fan frequency of 60 Hz, pump volume flow rate of 15 cm3 min−1. Furthermore, the precursor powder was collected and dried at 353 K overnight. All precursor samples were labelled as PZ-x, P represents precursor; Z represents ZSM-5; x indicates the weight percent of ZSM-5 in the precursor.At the second step, ZSM-5/beta composite zeolites were synthesized by a hydrothermal method using the PZ-x precursor. First, 0.5 g of PZ-x precursor powder was mixed with tetraethylammonium hydroxide (TEAOH, 25 wt% in water). Afterwards, the synthesis gel with a molar composition 1SiO2:0.05–0.25TEAOH was transferred into a PTFE-lined stainless-steel autoclave and hydrothermally crystallized for 12–72 h at 383–443 K under autogenous pressure. The product was centrifugally washed with deionized water repeatedly until pH = 7.5. Finally, the solid product was dried overnight at 353 K and calcined in a muffle furnace at 813 K for 10 h. The product yield was about 82.5%–85%. The obtained ZSM-5/beta composite zeolites were denoted as Z-x/B-y, where x, y indicates the weight percent of ZSM-5 and beta zeolite, respectively.
Determination of the weight percents of ZSM-5 and beta zeolites in the final products
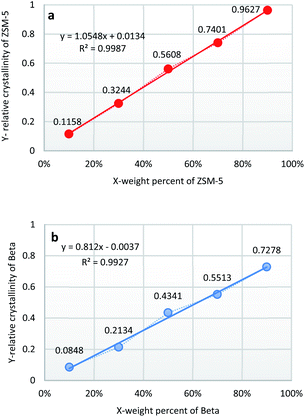
The weight percents of ZSM-5 and beta in the composite zeolites were determined according to the literature33 with some modifications. Pure ZSM-5 and beta zeolites were mechanically mixed with different weight percents of ZSM-5 (10%, 30%, 50%, 70%, 90%). The powder X-ray diffraction (XRD) patterns of the mixtures were measured as Fig. 1. The amplified XRD graphs at 2θ range of 6.0°–9.7° and 21.0°–25.0° were inserted in Fig. 1. Distinct diffraction peaks typical for MFI-type (2θ = 7.9°, 8.8°, 23.1°, 23.9°, 24.4°)34 and BEA-type (2θ = 7.8°, 22.4°)35 topologies can be observed in Fig. 1. It is worth noting that the reflections of ZSM-5 and beta at 2θ = 7.8°–7.9° completely overlap. Therefore, the relative crystallinities of ZSM-5 and beta were calculated by the sum of the areas of the diffraction peaks of ZSM-5 at 2θ = 23.1°, 23.9°, 24.4° and that of beta at 2θ = 22.4°, respectively. The relative crystallinities of pure ZSM-5 and beta are defined as 100%. As shown in Fig. 2a and b, the relative crystallinity of ZSM-5 (or beta) is proportional to the weight percent of zeolite ZSM-5 (or beta). Therefore, the weight percent of zeolite ZSM-5 or beta in the composite samples can be deduced from the two working curves. A mechanical mixture of ZSM-5 and beta zeolite was denoted as [Z-x/B-y].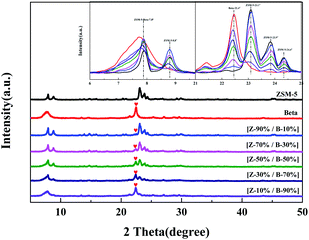 | ||
| Fig. 1 XRD patterns for the mechanical mixtures of ZSM-5 and beta zeolites with different mass ratios. | ||
Characterization
Powder X-ray diffraction (XRD) patterns were measured on a Shimadzu Rigaku D/max-2400 diffraction instrument employing Cu-Kα radiation (40 kV, 10 mA). First, 2 g of the samples were ground into uniform powders. Then the powders were screened with a 320 mesh. After that they were filled into the groove of the sample frame, and the surface of the powder was scraped to be consistent with the frame plane. A test piece with a very flat plane was made. Finally, the test piece was mounted in the diffractometer and scanned at a scanning rate of 8° min−1 in the range of 2θ = 5°–50°.Morphologies of the samples were recorded on a field emission scanning electron microscope (SEM) of FEI NOVA NanoSEM450 with an accelerating voltage of 3–5 kV. Transmission electron microscopy (TEM) images were obtained on a JEM F200 instrument at 200 kV. SiO2/Al2O3 ratios of the composite samples were determined by a Perkin Elmer Optima2000DV inductively coupled plasma (ICP) atomic emission spectroscopy. The particle size distribution of the sample was investigated by the ZETA SIZER (Nano series) analyzer manufactured by Brookhaven, USA. The powder samples were dispersed with ethanol to form suspension with a concentration of 1 g L−1.
Nitrogen physical adsorption–desorption isotherms were measured on a Micromeritics ASAP 3020 automated physisorption instrument (Micromeritics, Atlanta, USA) at liquid N2 temperature (77 K). In addition, all samples of 20–40 mesh were degassed at 623 K for 5 h prior to the analysis. The specific surface area was determined by the Brunauer–Emmett–Teller (BET) equation. The external surface area was derived from the t-plot method, while the microporous surface area was determined by the difference between the two above. The micropore and total volumes were calculated by the t-plot method, and the mesopore volume was the difference between them.
The NH3-TPD (temperature-programmed desorption of ammonia) profiles were obtained on a Quantachrome Chembet 3000 chemisorb instrument. The samples of 20–40 mesh were loaded into a quartz reactor tube and pre-treated in helium at 873 K for 1 h and then cooled down to 373 K, which lasted for 50 min. After that the ammonia was introduced. The carrier gas was switched to helium again after NH3 adsorption. Finally, the sample was heated to 873 K at a rate of 10 K min−1 and lasted for 1 min.
Solid-state nuclear magnetic resonance (NMR) experiment was carried out on an Agilent DD2-500 MHz spectrometer (Agilent Technologies Inc, California, USA). The 27Al MAS NMR spectra were recorded at a resonant frequency of 130.23 MHz using a 4 mm MAS NMR probe at a spinning speed of 12 kHz. After 400 scans with a π/12 flip angle of 0.34 μs, the 27Al MAS NMR spectra were accumulated.
Py-IR spectra in the range from 4000 to 400 cm−1 were obtained on a Nicolet 10 FT-IR spectrometer with a spectral resolution of 4 cm−1. First, the powder samples were pressed into uniform self-supported wafers and evacuated at 673 K under vacuum (10−3 Pa) for 3–4 h in a quartz IR cell equipped with CaF2 windows. Following this, the samples were cooled down to room temperature. The background spectrum was recorded. Pyridine adsorption–desorption experiment was as follows: pyridine vapor was introduced into the IR cell and adsorbed on the samples at ambient temperature for 30 min until saturated adsorption was reached. Then, the desorption of pyridine treatment was performed under vacuum for 30 min of heating at 473 K and 623 K, followed by an FT-IR measurement at room temperature. Finally, the spectra of pyridine were obtained by subtracting the background spectrum from the measured spectra.
Hydrothermal stability test
The hydrothermal stability of the composite zeolite was tested. First, 0.1 g of the sample was loaded into a stainless steel reaction tube, which was heated to 550 °C at a heating rate of 10 °C min−1 with nitrogen as carrier gas. Then, 20% of water vapor was introduced into the reaction tube to treat the sample for 6 h under hydrothermal conditions. Finally, the sample was cooled to the room temperature in a nitrogen flow. The XRD patterns of the sample before and after the hydrothermal treatment were measured.Catalytic test
The catalytic performances of the ZSM-5/beta composite zeolites were evaluated by the 1,3,5-tri-isopropylbenzene (1,3,5-TIPB) cracking reaction. The experiment was performed as follows: first, 0.1 g of catalysts (20–40 mesh) were loaded into a stainless U-tube microreactor with an inner diameter of 4 mm and the length of 28 cm. Then the catalysts with the bed height of about 26 mm were in situ activated at 623 K with nitrogen for 1–3 h. Following the activation, 0.3 μL of 1,3,5-TIPB (95 wt%, Aladdin) was injected into the microreactor by the syringe with the aid of nitrogen carrier gas for the cracking experiment. The temperature of the cracking reaction was 623 K.36 After the reaction was completed, the gas phase products were transported by nitrogen carrier gas directly to a FULI-9790 gas chromatographic instrument equipped with a flame ionization detector (FID) and SE-54 capillary column. Then the composition of the cracking products was analyzed by the gas chromatograph. During the process, the heating belt was used to prevent condensation of the products. Both the injection port and chromatogram detector were heated at 543 K.The carbon balances are between 97.3%–99.6%. The conversion rate of 1,3,5-TIPB (C1,3,5-TIPB) and the selectivity of each product (Si) were calculated as the following equations:
MTIPB,r: moles of TIPB in the reactants; MTIPB,p: moles of TIPB in the products; Mi: moles of the specific product – i; Mt: total moles of the products.
Results and discussion
Optimal synthesis conditions for the ZSM-5/beta composite zeolites
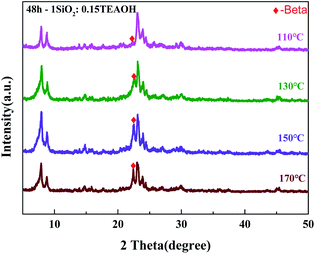
The optimal synthesis conditions were investigated using the PZ-50% precursor crystallized at various crystallization temperatures and template amounts. The crystallization temperature is a key factor affecting the crystallization rate of the zeolite. Fig. 3 exhibits the XRD patterns of the Z-50%/B-50% samples crystallized at 110–170 °C. All samples were crystallized for 48 hours with TEAOH![[thin space (1/6-em)]](https://www.rsc.org/images/entities/char_2009.gif) :
:![[thin space (1/6-em)]](https://www.rsc.org/images/entities/char_2009.gif) SiO2 = 0.15. The diffraction peaks at 2θ = 7.9°, 8.8°, 23.1°, 23.9° and 24.4° are typical for ZSM-5, while the diffraction peaks at 2θ = 7.9° and 22.4° are associated with the beta zeolite. This confirms the co-existence of ZSM-5 and beta zeolites. The reflection intensities of zeolite ZSM-5 are hardly affected by the crystallization temperature since its amount is fixed in the precursor. However, the reflection intensities of beta are affected by the crystallization temperature. By increasing the temperature, the reflection intensities of zeolite beta increased first and then decreased slightly. On the one hand, the rise of the crystallization temperature will accelerate the crystallization rate, which is more conducive to the growth of crystals. On the other hand, due to the disordered arrangement of TEA+ at the excessively high temperature, competitive reactions will exist in the system, which is uneasy to form the framework of the beta zeolite. By calculation, the crystallinity of beta is the highest when the crystallization temperature is 150 °C. As shown in Table 1, the mass ratio of beta/ZSM-5 in the sample crystallized at 150 °C is 0.9, which is close to the feed ratio in the precursor. The feed ratio is denoted as the mass ratio of the amorphous Si–Al species/ZSM-5 in the spray dried powder.
SiO2 = 0.15. The diffraction peaks at 2θ = 7.9°, 8.8°, 23.1°, 23.9° and 24.4° are typical for ZSM-5, while the diffraction peaks at 2θ = 7.9° and 22.4° are associated with the beta zeolite. This confirms the co-existence of ZSM-5 and beta zeolites. The reflection intensities of zeolite ZSM-5 are hardly affected by the crystallization temperature since its amount is fixed in the precursor. However, the reflection intensities of beta are affected by the crystallization temperature. By increasing the temperature, the reflection intensities of zeolite beta increased first and then decreased slightly. On the one hand, the rise of the crystallization temperature will accelerate the crystallization rate, which is more conducive to the growth of crystals. On the other hand, due to the disordered arrangement of TEA+ at the excessively high temperature, competitive reactions will exist in the system, which is uneasy to form the framework of the beta zeolite. By calculation, the crystallinity of beta is the highest when the crystallization temperature is 150 °C. As shown in Table 1, the mass ratio of beta/ZSM-5 in the sample crystallized at 150 °C is 0.9, which is close to the feed ratio in the precursor. The feed ratio is denoted as the mass ratio of the amorphous Si–Al species/ZSM-5 in the spray dried powder.
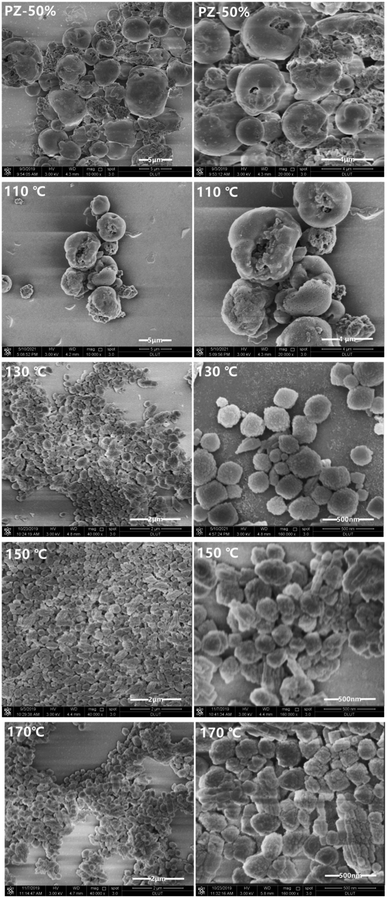
Fig. 4 shows the SEM images of the Z-50%/B-50% samples crystallized at 110–170 °C. The morphology of the Z-50%/B-50% sample crystallized at 110 °C is similar to that of its precursor PZ-50%. This is because that most of the amorphous aluminosilicate coated on the ZSM-5 zeolites has not been crystallized. At 130 °C, the surface of the sample becomes rough. Combined with XRD, it can be confirmed that the amorphous Si–Al species crystallized. All precursors almost transformed into the spherical nanocrystals with the size of 200 nm to 1 μm at 150 °C. Upon increasing the temperature, the morphologies of the nanoaggregates do not change significantly. This indicates that the sample has well-crystallized at 150 °C. This is consistent with XRD results. Therefore, 150 °C is selected as the optimal temperature for the synthesis of the Z-50%/B-50% sample.
Fig. 5 shows the XRD patterns of the Z-50%/B-50% samples crystallized with different amounts of the template (TEAOH![[thin space (1/6-em)]](https://www.rsc.org/images/entities/char_2009.gif) :
:![[thin space (1/6-em)]](https://www.rsc.org/images/entities/char_2009.gif) SiO2 = 0.05–0.25). The corresponding SEM micrographs are given in Fig. 6. All samples were crystallized at 150 °C for 24 hours. As shown in Fig. 5, the crystallinities of beta and ZSM-5 increase first and then decrease with increasing the TEAOH/SiO2 ratio from 0.05 to 0.25. When TEAOH/SiO2 = 0.15, the crystallinities of both beta and ZSM-5 reach the maximum. As a template, TEAOH has a stable tetrahedral structure, which can accelerate the transformation of monomer silicon and aluminum to the polymerized state. Meanwhile, it can also improve the basicity and accelerate the crystallization process.37 As a result, the addition of TEAOH can increase the crystallinity of beta in the sample. However, when TEAOH/SiO2 > 0.15, the amount of water introduced by the template increases, reducing the concentration of each component in the system. This results in a slower polymerization reaction rate and crystallization rate. Hence the crystallinity of beta decreases. As shown in Fig. 6, when TEAOH/SiO2 < 0.15, the samples are irregular nanoaggregates with the size of 3–4 μm. When TEAOH/SiO2 = 0.15 and 0.20, the dispersive particles become smaller and the size is more uniform. When TEAOH/SiO2 > 0.20, the nanocrystals re-aggregate more tightly to form irregular particles with a larger size. Table 2 illustrates that the mass ratio of beta/ZSM-5 in the composite synthesized with TEAOH/SiO2 = 0.15 is close to the feed ratio. From what has been discussed above, the optimal amount of template is TEAOH/SiO2 = 0.15 for the synthesis of the Z-50%/B-50% sample.
SiO2 = 0.05–0.25). The corresponding SEM micrographs are given in Fig. 6. All samples were crystallized at 150 °C for 24 hours. As shown in Fig. 5, the crystallinities of beta and ZSM-5 increase first and then decrease with increasing the TEAOH/SiO2 ratio from 0.05 to 0.25. When TEAOH/SiO2 = 0.15, the crystallinities of both beta and ZSM-5 reach the maximum. As a template, TEAOH has a stable tetrahedral structure, which can accelerate the transformation of monomer silicon and aluminum to the polymerized state. Meanwhile, it can also improve the basicity and accelerate the crystallization process.37 As a result, the addition of TEAOH can increase the crystallinity of beta in the sample. However, when TEAOH/SiO2 > 0.15, the amount of water introduced by the template increases, reducing the concentration of each component in the system. This results in a slower polymerization reaction rate and crystallization rate. Hence the crystallinity of beta decreases. As shown in Fig. 6, when TEAOH/SiO2 < 0.15, the samples are irregular nanoaggregates with the size of 3–4 μm. When TEAOH/SiO2 = 0.15 and 0.20, the dispersive particles become smaller and the size is more uniform. When TEAOH/SiO2 > 0.20, the nanocrystals re-aggregate more tightly to form irregular particles with a larger size. Table 2 illustrates that the mass ratio of beta/ZSM-5 in the composite synthesized with TEAOH/SiO2 = 0.15 is close to the feed ratio. From what has been discussed above, the optimal amount of template is TEAOH/SiO2 = 0.15 for the synthesis of the Z-50%/B-50% sample.
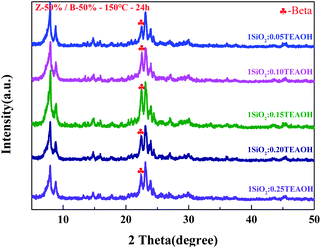 | ||
| Fig. 5 XRD patterns for the Z-50%/B-50% samples crystallized with different addition amount of template (TEAOH). | ||
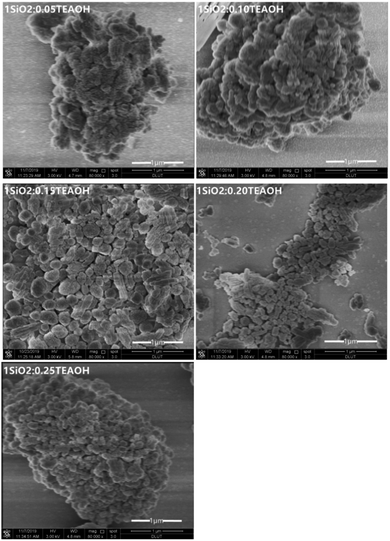 | ||
| Fig. 6 SEM images of the Z-50%/B-50% samples crystallized with different addition amounts of template (TEAOH). | ||
Crystallization process for the ZSM-5/beta composite zeolites
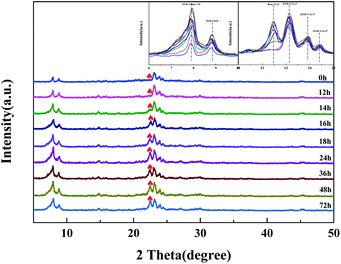
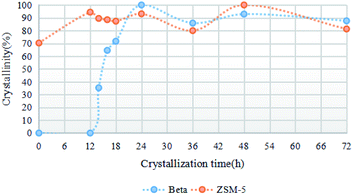
To further reveal the crystallization process of the ZSM-5/beta composite zeolites, the PZ-50% precursor crystallized at various times under the optimal synthesis conditions (150 °C, TEAOH/SiO2 = 0.15). The XRD patterns are shown in Fig. 7. The crystallization curve is presented in Fig. 8. Clearly, only the diffraction peaks attributed to the MFI topology exist in the XRD pattern of the PZ-50% precursor (0 h). As the crystallization time increases, the crystallinity of ZSM-5 varies in the range of 70% to 100%. The crystallization curve of beta shows a typical S-type curve,38 including an induction period (0–12 h), a growth period (12–24 h) and a growth ending period (24–72 h).39 After 12 h of crystallization, two weak diffraction peaks attributed to the BEA topology can be observed. The intensities of these reflections gradually increase with the crystallization time prolonging and reach the maximum at 24 h. Table 3 lists that the mass ratio of beta/ZSM-5 in the Z-50%/B-50% sample crystallized at 24 h is 1.0, which is same to the feed ratio. Further extending the crystallization time, the crystallinity decreases slightly, indicating that the ZSM-5/beta composite zeolite can be fully-crystallized at 24 h.The SEM images in Fig. 9 clearly exhibit the morphology of the Z-50%/B-50% samples crystallized at various times. The PZ-50% sample (0 h) consists of ZSM-5 aggregates coated with the smooth shell (amorphous Si–Al species). The morphology of the sample after crystallization for 12 h is very similar to that of the precursor, indicating that the amorphous Si–Al species on the surface of ZSM-5 aggregates have not crystallized during this period. This is consistent with the XRD results. As the crystallization time increases (12–24 h), the morphology of the sample changes obviously. The particle size of the sample decreases and the surface becomes rough. Combined with XRD, it was found that beta was gradually crystallized from the amorphous Si–Al species. At 24 h, the precursors were fully-crystallized and the composite with the size ranging from 200–1 μm was formed. Further extending the crystallization time (24–72 h), the morphology and crystallinity of the sample do not change significantly, indicating the end of the crystal growth period.
The SEM and XRD results indicate that the Z-50%/B-50% sample synthesized by the spray drying-assisted hydrothermal method can be fully-crystallized for only 24 h. Since no extra water is added in the solid precursor powder, the crystallization of the ZSM-5/beta composite zeolites occurs in a strongly alkaline dense system. This can not only reduce the loss of silicon and aluminum sources, but also avoid the problem of two-phase separation existing in the traditional hydrothermal synthesis owing to charge density matching.
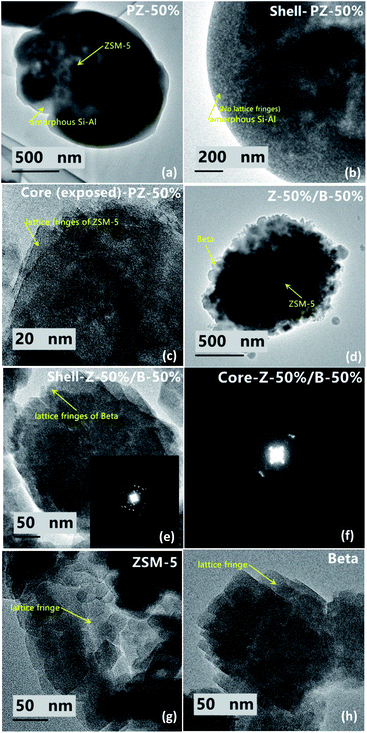
Fig. 10 exhibit the TEM images of the Z-50%/B-50% sample and the corresponding precursor PZ-50% sample. From the SEM images of the precursor (PZ-50%) in Fig. 9, it can be seen that the precursor is a core–shell structure, which is the nanoaggregates coated with the smooth outer shell. In Fig. 10b, the TEM image of PZ-50% sample does not show the lattice fringes at the edge, indicating that the shell consists of amorphous Si–Al species. Distinct lattice fringes of ZSM-5 were observed on the exposed core-phase materials (Fig. 10c), further proved that the core is ZSM-5. Fig. 10d shows that the rough surface of the Z-50%/B-50% sample appears to be the accumulation of nanocrystals. This infers that the amorphous Si–Al species in the shell phase has been crystallized. The HRTEM image in Fig. 10e shows that the nanocrystals accumulated on the surface of the Z-50%/B-50% sample show exactly the same lattice fringes of beta (Fig. 10h). The result investigated by selected area electron diffraction (SAED) displays that the shell layer (Fig. 10e) and the core (Fig. 10f) have the different SAED patterns. Combining the results from the SEM and TEM images, it can be deduced that the core–shell structure with beta as shell and ZSM-5 as core might be formed for the Z-50%/B-50% sample. Of course, it cannot be ruled out that some ZSM-5 particles are exposed.
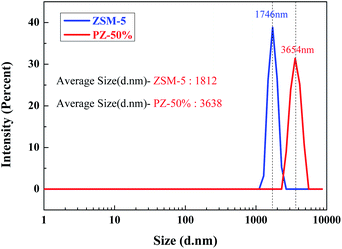
The particle size distributions of ZSM-5 and the PZ-50% sample are shown in Fig. 11. The average size of the PZ-50% sample is 3638 nm, which is approximately twice that of ZSM-5 (1812 nm). The result further proved that there was indeed a layer of amorphous Si–Al species coated on the ZSM-5 crystals by a spray drying process.
The synthesis of ZSM-5/beta composite zeolites with different ZSM-5/beta ratios
Fig. 12a and b show the XRD patterns for the synthesized PZ-x precursor samples and Z-x/B-y samples with different mass ratios, respectively. All samples were crystallized at 150 °C for 48 h with the template amount of TEAOH/SiO2 = 0.15 using the corresponding PZ-x precursors. As the amount of the added silica–aluminum species increases, the optimal crystallization time increases as well. Therefore, the crystallization time of 48 h was chosen to make sure that the composite zeolites with different ZSM-5/beta ratios can be fully crystallized. Except for the reflection attributed to ZSM-5, the reflection typical for BEA-type (2θ = 7.9°, 22.4°) can also be observed in Fig. 12b. The intensities of the reflection attributed to BEA in the synthesized Z-x/B-y samples increase with the rise of the added amorphous silica-aluminum species. At the same time, the intensities of the reflection attributed to ZSM-5 decrease. The mass ratios of beta/ZSM-5 in the composite samples are displayed in Table 4. It can be observed that the mass ratios of beta/ZSM-5 in the Z-x/B-y samples are close to the feed ratios of the precursors. In conclusion, the ZSM-5/beta composite zeolites with different mass ratios can be obtained via a spray drying-assisted hydrothermal method.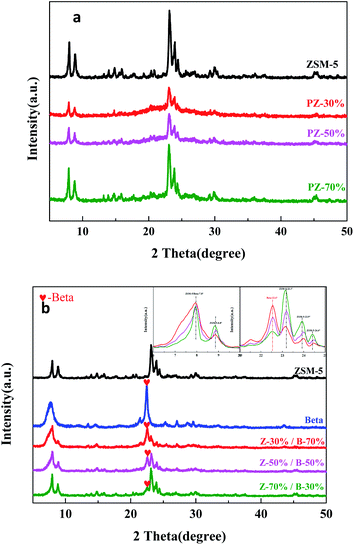 | ||
| Fig. 12 XRD patterns for the PZ-x samples (a), the synthesized Z-x/B-y samples with different mass ratios (b). | ||
Fig. 13 shows the SEM images of ZSM-5, beta, PZ-x precursors and the Z-x/B-y samples with different mass ratios. The commercial ZSM-5 zeolite used to synthesize the PZ-x precursors is rough and irregular aggregates with the size of 1–2 μm. The single crystal size of ZSM-5 is 50–200 nm. The pure beta zeolite synthesized by the same method exhibits spherical and regular nanoparticles with a size of about 100 nm. The morphology of the PZ-x sample is irregular particles with ZSM-5 aggregates coated with the smooth shell. And by increasing the amount of ZSM-5, the particles pile up more loosely and become more irregular. The Z-x/B-y samples show the irregular nanoaggregates with the size ranging from 200–1 μm. Similarly, upon increasing the amount of ZSM-5, the number of particles with the larger size increases.
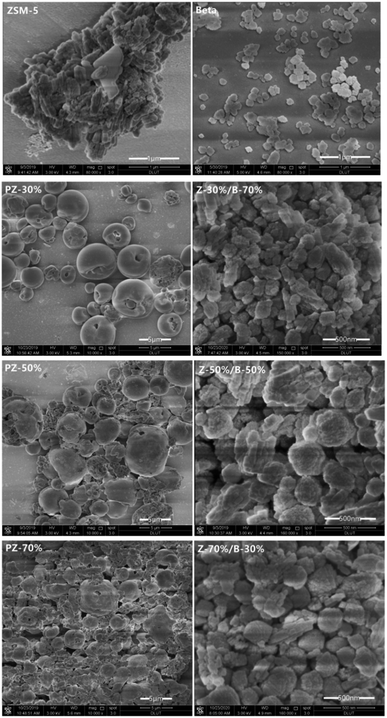 | ||
| Fig. 13 SEM images of: pure ZSM-5 and beta zeolite; the PZ-x samples; the Z-x/B-y samples with different mass ratios. | ||
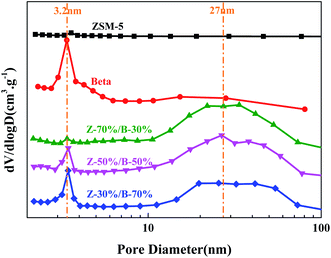
Fig. 14 and 15 show N2 physical adsorption–desorption isotherms and BJH pore size distributions of the Z-x/B-y samples with different mass ratios, respectively. In Fig. 14, the main isotherm type of the pure ZSM-5 zeolite is identified as type I, which is characteristic of microporosity. In addition, the isotherm type of the pure beta zeolite is identified as type I and type IV with a narrow H1 hysteresis loop, which is characteristic of microporosity and limited mesoporosity. Nevertheless, the isotherms of all Z-x/B-y samples are identified as a combination of typical type I and type IV with a hysteresis loop, including a sharp rise in the uptake at lower relative pressure and a large hysteresis loop at higher relative pressure. This indicates the presence of micropores and mesopores, respectively.40,41 It is interesting that there are no mesopores in the pure ZSM-5 zeolite. The mesopore size distribution of the pure beta zeolite is mainly located at 3–4 nm. However, the Z-x/B-y samples form additional mesopores with pore sizes of 15–70 nm. This indicates the large mesopores are generated from the accumulation of ZSM-5 and beta particles. Table 5 lists the textural parameters of the Z-x/B-y samples. By increasing the amount of ZSM-5, the external surface area, mesopore volume and total volume increase greatly. Compared with the pure ZSM-5 and beta zeolite, these parameters of the Z-x/B-y samples also improve. The higher external surface area may supply more active sites and larger mesopore volume may accommodate more deposited carbons. In conclusion, the ZSM-5/beta composite zeolites might exhibit better catalytic performance owing to its great textural parameters and adjustable pore structure compared with the pure zeolite.
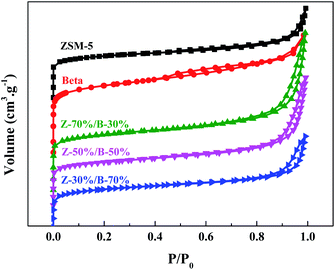 | ||
| Fig. 14 N2 physical adsorption–desorption isotherms of the Z-x/B-y samples with different mass ratios. | ||
| Samples | Surface area (m2 g−1) | Pore volume (cm3 g−1) | SiO2/Al2O3e | ||||
|---|---|---|---|---|---|---|---|
| SBETa | Smicrob | Sextb | VTotalc | Vmicrob | Vmesod | ||
| a BET method applied to the N2 isotherm.b Calculated using the t-plot method.c Determined from the amount of N2 adsorbed at P/P0 = 0.99.d Vmeso = VTotal − Vmicro.e Determined by ICP-AES. | |||||||
| ZSM-5 | 480 | 382 | 98 | 0.28 | 0.17 | 0.11 | 28 |
| Z-30%/B-70% | 563 | 453 | 110 | 0.53 | 0.26 | 0.27 | 25 |
| Z-50%/B-50% | 542 | 416 | 126 | 0.57 | 0.23 | 0.34 | 25 |
| Z-70%/B-30% | 527 | 385 | 142 | 0.63 | 0.18 | 0.45 | 26 |
| Beta | 537 | 435 | 102 | 0.44 | 0.25 | 0.19 | 25 |
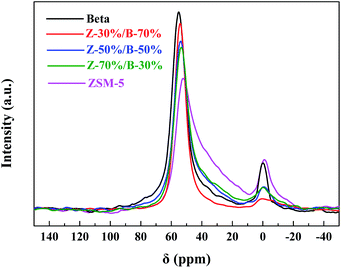
Table 5 lists that the SiO2/Al2O3 ratios of all Z-x/B-y samples are close. The MAS NMR technique was used to investigate the coordination of framework Al in the ZSM-5/beta composite zeolites. Fig. 16 shows the 27Al MAS NMR spectra of the Z-x/B-y samples. The resonance band belonging to the tetrahedrally coordinated framework Al species can be observed at around 54 ppm. The signal at 0 ppm is associated with the extra-framework Al species.42,43 The intensity of the signal at 54 ppm is much higher than that at 0 ppm, indicating that the aluminum species exist mainly in the framework. The amount of the framework Al is the highest in the beta zeolite, while that of ZSM-5 is the lowest. The amounts of the framework Al of the Z-x/B-y samples are between those of ZSM-5 and beta. Upon an increase of the ZSM-5 content, the signal intensity of the Z-x/B-y samples at 54 ppm decreases gradually, indicating a decrease in the amount of the framework Al. Compared to ZSM-5 and beta, the amounts of the extra-framework Al in the Z-x/B-y samples are lower. It can be concluded that most of the aluminum sources in the ZSM-5/beta composite zeolites are transformed into framework Al sites.
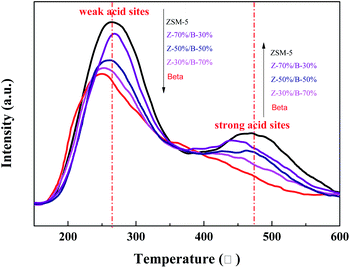
Fig. 17 displays the NH3-TPD results for the Z-x/B-y samples with different mass ratios. All samples exhibit distinct desorption peaks at 250–270 °C and 430–470 °C, which are attributed to the weak acid sites and strong acid sites, respectively.44–46 Moreover, the intensities of the desorption peaks at the low temperature were higher than those at the high temperature, indicating that the weak acid sites are more than the strong acid sites in the Z-x/B-y samples. Meanwhile, the amounts of the weak and strong acid sites increase gradually with the increase of ZSM-5 in the Z-x/B-y samples. This infers that the acid sites of the ZSM-5/beta composite zeolites can be adjusted by changing the mass ratio.
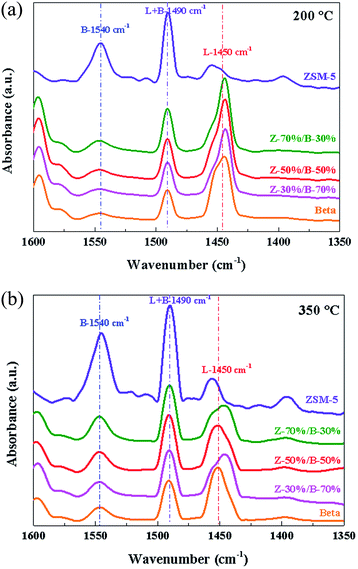
Fig. 18 compares the pyridine adsorption IR spectra of the Z-x/B-y samples. According to the literature,47–49 the bands at around 1450 cm−1 and 1540 cm−1 are attributed to the Lewis acid sites and Brønsted acidic sites, respectively. Moreover, the peaks assigned to Lewis acid sites and Brønsted acidic sites are overlapped at 1490 cm−1. As shown in Fig. 18, the intensities of the bands at 1540 cm−1 are higher than that at 1450 cm−1, indicating that ZSM-5 possesses more Brønsted acidic sites. On the contrary, more Lewis acidic sites exist on the zeolite beta. As the desorption temperature increases from 200 °C to 350 °C, the intensities of the bands at 1540 cm−1 are almost not affected, but the intensities of the bands at 1450 cm−1 reduce greatly, which indicates that the Bronsted acid sites in the Z-x/B-y samples are strong acid sites and the Lewis acid sites are weak acid sites. In addition, by increasing the amount of ZSM-5, the intensities of the bands at 1540 cm−1 enhance and those at 1450 cm−1 weaken slightly. Therefore, the type of acid sites in the ZSM-5/beta composite zeolites can also be affected by changing the mass ratio of ZSM-5/beta.
Performances of the Z-x/B-y samples in the 1,3,5-TIPB catalytic cracking reaction
The catalytic cracking of 1,3,5-triisopropylbenzene (TIPB) was used as a probe reaction to study the acidic properties and pore structures of the Z-x/B-y samples. The catalytic performances of the Z-x/B-y samples were compared with those of the pure ZSM-5, beta zeolite and the mechanical mixtures [Z-70%/B-30%]. Fig. 19 shows the conversion of 1,3,5-TIPB at 623 K over the catalysts at different pulse times. Obviously, the conversion of TIPB at the first pulse is shown as: Z-70%/B-30% > Z-50%/B-50% > Z-30%/B-70% > beta > [Z-70%/B-30%] > ZSM-5. The kinetic diameter of TIPB molecules is 0.94–0.95 nm, which is larger than the average pore diameters of ZSM-5 (0.55–0.56 nm) and the largest pore diameter of beta (0.76 nm). TIPB cannot diffuse through the inner pores of ZSM-5 and beta. The catalytic cracking of TIPB can only occur on the external surface of ZSM-5 or beta. Therefore, the TIPB conversion is strongly affected by the external surface areas. Although ZSM-5 has the most acid sites, the lowest external surface area may restrict the TIPB conversion. Beta exhibits the lowest acid amount and relatively low external surface area. Therefore, the TIPB conversions of ZSM-5 and beta are relatively low. The Z-x/B-y samples possess higher external surface areas, and exhibit the higher TIPB conversions as compared to ZSM-5 and beta. In addition, the external surface areas (Table 5) and the acid amounts (Fig. 17) of the Z-x/B-y samples increase with the content of ZSM-5. The catalytic cracking of TIPB is mainly determined by the external surface areas and the acid sites. Hence the Z-70%/B-30% sample exhibits the highest TIPB conversion. The TIPB conversion of the mechanical mixture M-[Z-70%/B-30%] sample is between those of the pure ZSM-5 and beta zeolites, but is much lower than that of the Z-70%/B-30% composite sample. It can be deduced that the ZSM-5/beta composite synthesized by the spray drying-assisted hydrothermal method is not a simple physical mixture, but creates the new additional larger pores and higher external surface areas, which are the keys to improve the catalytic performances. Moreover, the catalysts with smaller pore size are likely to deactivate due to the carbon deposition.50 ZSM-5 zeolite is the most susceptible to deactivation, followed by beta zeolite. The Z-x/B-y samples with hierarchical porous structures and more mesopores facilitate the diffusion of TIPB and resist to coke.51 However, the pure ZSM-5, beta and the mechanical mixture M-[Z-70%/B-30%] sample not only exhibit lower catalytic activity but also poor stability. To sum up, the activity of the catalyst is related to its external surface area and amount of the acid sites, and the stability is connected with its pore sizes.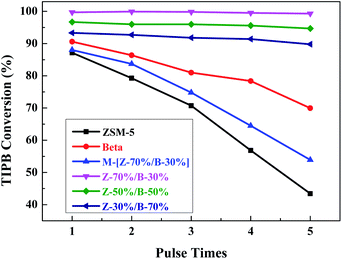 | ||
| Fig. 19 TIPB Conversions over the Z-x/B-y samples with different mass ratios at different pulse times. | ||
The cracking of 1,3,5-TIPB mainly consists of three dealkylation reactions: (1) 1,3,5-TIPB → MIPB + Pro; (2) MIPB → IPB + Pro; (3) IPB → Ben + Pro (MIPB: M-diisopropyl benzene; Pro: propylene; IPB: isopropyl benzene; Ben: benzene). Besides three primary reactions above, there are some side reactions such as dis-proportionation, isomerization and condensation.52 For example, MIPB will be isomerized to form p-diisopropylbenzene (PIPB) as a by-product. The first two dealkylation reactions mainly proceed on the weak acid sites, while the last dealkylation reaction requires the strong acid sites. Fig. S1† shows that the selectivity of the Z-x/B-y sample is quite stable at different pulse times. Table 6 lists the selectivity of each product over the Z-x/B-y samples at the first pulse. It can be observed that the main products are Ben and Pro. This indicates that most of the 1,3,5-TIPB reactants are cracked completely over the Z-x/B-y samples. Beta shows the lowest selectivity to Ben due to lack of the strong acid sites. On the contrary, ZSM-5 exhibits the highest selectivity to Ben since it has the most strong acid sites. Similarly, the selectivity to Ben slightly increases, while the selectivities to IPB, MIPB and PIPB decrease gradually with increasing the amount of ZSM-5 in the Z-x/B-y samples. This corresponds to the results of NH3-TPD. In summary, the selectivity of the ZSM-5/beta composite is closely related to its acidity in the catalytic cracking reaction of 1,3,5-TIPB.
| Samples | SPro (%) | SBen (%) | SIPB (%) | SMIPB (%) | SPIPB (%) |
|---|---|---|---|---|---|
| ZSM-5 | 53.2 | 45.5 | 1.2 | 0.1 | 0 |
| M-[Z-70%/B-30%] | 52.4 | 43.3 | 3.1 | 0.9 | 0.3 |
| Z-70%/B-30% | 52.9 | 44.9 | 1.8 | 0.4 | 0 |
| Z-50%/B-50% | 51.5 | 43.6 | 3.8 | 0.8 | 0.3 |
| Z-30%/B-70% | 49.5 | 43 | 5.3 | 1.8 | 0.4 |
| Beta | 43.7 | 37.8 | 13.3 | 4.4 | 0.8 |
Results of hydrothermal stability test
The XRD patterns of the Z-50%/B-50% sample (150 °C, 24 h, 1SiO2:0.15TEAOH) before and after the hydrothermal treatment were measured in Fig. 20. After hydrothermal treatment at 550 °C for 6 h, the crystallinities of the ZSM-5 and beta phases in the composite decrease by 19.2% and 31.8%, respectively. The crystallinities of ZSM-5 and beta were calculated by the sum of the areas of the diffraction peaks of ZSM-5 at 2θ = 8.8°, 23.1°, 23.9°, 24.4° and that of beta at 2θ = 22.4°, respectively. The above results show that the ZSM-5/beta composite zeolites synthesized by the spray drying-assisted hydrothermal method show good hydrothermal stability.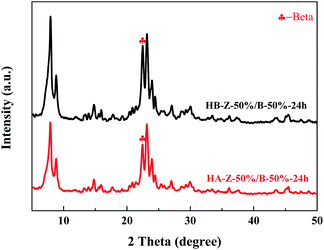 | ||
| Fig. 20 XRD patterns of the Z-50%/B-50% sample before (HB) and after (HA) the hydrothermal treatment. | ||
Conclusions
In summary, the hierarchical ZSM-5/beta composite zeolites with different mass ratios have be been successfully synthesized using a spray drying-assisted hydrothermal method, indicating that the method can control the content of each component in the composite zeolites. For the Z-50%/B-50% sample, the optimal crystallization conditions were crystallization temperature of 150 °C and the template amount of TEAOH/SiO2 = 0.15. And it can be fully-crystallized at 24 h. Compared with the pure ZSM-5 and beta zeolites, the Z-x/B-y samples exhibit additional larger pores with sizes of 15–70 nm, higher external surface area and larger mesopore volume, which is the key to improve the catalytic performance. Moreover, the pore structure, acid sites and acidity of the ZSM-5/beta composite zeolites can be adjusted by changing the mass ratio of ZSM-5/beta. The evaluation of 1,3,5-TIPB catalytic cracking reaction is consistent with the acid sites and pore structure of the ZSM-5/beta composite zeolites. This method is a general method and can be extended to synthesize other composite zeolites.Conflicts of interest
There are no conflicts to declare.Acknowledgements
This work was financially supported by the Dalian Research Institute of Petroleum and Petrochemicals (SINOPEC, Grant 119010-1).References
- L. Zhu, F. Xiao, Z. Zhang, Y. Sun, Y. Han and S. Qiu, Catal. Today, 2001, 68, 209–216 CrossRef CAS.
- Z. Li, X. Jiang, G. Xiong, B. Nie, C. Liu, N. He and J. Liu, Catal. Sci. Technol., 2020, 10, 7829–7841 RSC.
- C. He, P. Li, J. Cheng, H. Wang, J. Li, Q. Li and Z. Hao, Appl. Catal., A, 2010, 382, 167–175 CrossRef CAS.
- S. Zhao, D. Collins, L. Wang and J. Huang, Catal. Today, 2021, 368, 211–216 CrossRef CAS.
- J. Zheng, G. Wang, M. Pan, D. Guo, Q. Zhao, B. Li and R. Li, Microporous Mesoporous Mater., 2015, 206, 114–120 CrossRef CAS.
- Y. Ooi, R. Zakaria, A. R. Mohamed and S. Bhatia, Appl. Catal., A, 2004, 274, 15–23 CrossRef CAS.
- W. Jin, J. Ma, H. Ma, X. Li and Y. Wang, J. Solid State Chem., 2018, 267, 6–12 CrossRef CAS.
- X. Xue, Y. Liu, L. Wu, X. Pan, J. Liang and Y. Sun, Bioresour. Technol., 2019, 289, 121691 CrossRef PubMed.
- A. Krejčí, S. Al-Khattaf, M. A. Ali, M. Bejblová and J. Čejka, Appl. Catal., A, 2010, 377, 99–106 CrossRef.
- G. Xiong, M. Feng, J. Liu, Q. Meng, L. Liu and H. Guo, RSC Adv., 2019, 9, 3653–3660 RSC.
- G. Yang, L. Wang and H. Jiang, Microporous Mesoporous Mater., 2021, 316, 110949 CrossRef CAS.
- I. Wang, T. C. Tsai and S. T. Huang, Ind. Eng. Chem. Res., 1990, 29, 2005–2012 CrossRef CAS.
- Q. H. Zeng, X. Bai, J. J. Zheng, J. Q. Chen and R. F. Li, Chin. Chem. Lett., 2011, 22, 1103–1106 CrossRef CAS.
- X. Wang, F. Meng, H. Chen, F. Gao, Y. Wang, X. Han, C. Fan, C. Sun, S. Wang and L. Wang, C. R. Chim., 2017, 20, 1083–1092 CrossRef CAS.
- X. Li, J. He, M. Meng, Y. Yoneyama and N. Tsubaki, J. Catal., 2009, 265, 26–34 CrossRef CAS.
- S. Cheng, B. Mazonde, G. Zhang, M. Javed, P. Dai, Y. Cao, S. Tu, J. Wu, C. Lu, C. Xing and S. Shan, Fuel, 2018, 223, 354–359 CrossRef CAS.
- X. Zhang, J. Wang, J. Zhong, A. Liu and J. Gao, Microporous Mesoporous Mater., 2008, 108, 13–21 CrossRef CAS.
- Y. Kang, X. Wei, G. Liu, Y. Gao, Y. Li, X. Ma, Z. Zhang and Z. Zong, Fuel, 2020, 269, 117326 CrossRef CAS.
- Y. Xue, S. Li, J. Li, X. Cui, P. Wang, H. Zheng, Y. Niu, Q. Ma and L. Ding, Microporous Mesoporous Mater., 2021, 312, 110803 CrossRef CAS.
- Q. Zhao, B. Qin, J. Zheng, Y. Du, W. Sun, F. Ling, X. Zhang and R. Li, Chem. Eng. J., 2014, 257, 262–272 CrossRef CAS.
- Y. Fan, D. Lei, G. Shi and X. Bao, Catal. Today, 2006, 114, 388–396 CrossRef CAS.
- F. Liu, X. Wang, F. Xu, Q. Lin, H. Pan, H. Wu and J. Cao, Microporous Mesoporous Mater., 2017, 252, 197–206 CrossRef CAS.
- X. Wang, H. Chen, F. Meng, F. Gao, C. Sun, L. Sun, S. Wang, L. Wang and Y. Wang, Microporous Mesoporous Mater., 2017, 243, 271–280 CrossRef CAS.
- Z. Guo, G. Xiong, L. Liu, J. Yin, R. Zhao and S. Yu, RSC Adv., 2015, 5, 71433–71436 RSC.
- D. P. Debecker, S. Le Bras, C. Boissiere, A. Chaumonnot and C. Sanchez, Chem. Soc. Rev., 2018, 47, 4112–4155 RSC.
- Z. Jin, M. Xiao, Z. Bao, P. Wang and J. Wang, Angew. Chem., Int. Ed., 2012, 51, 6406–6410 CrossRef CAS PubMed.
- Q. Meng, J. Liu, G. Xiong, X. Li, L. Liu and H. Guo, Microporous Mesoporous Mater., 2019, 287, 85–92 CrossRef CAS.
- G. Xiong, X. Liu, R. Zhao, J. Liu, J. Yin, Q. Meng, Z. Guo and L. Liu, Microporous Mesoporous Mater., 2017, 249, 97–104 CrossRef CAS.
- Q. Meng, J. Liu, G. Xiong, L. Liu and H. Guo, Microporous Mesoporous Mater., 2020, 294, 109915 CrossRef CAS.
- Q. Meng, J. Liu, G. Xiong, X. Liu, L. Liu and H. Guo, Microporous Mesoporous Mater., 2018, 266, 242–251 CrossRef CAS.
- G. Xiong, J. Yin, J. Liu, X. Liu, Z. Guo and L. Liu, RSC Adv., 2016, 6, 101365–101371 RSC.
- J. Paul, A. Bruinsma, Y. Kim, J. Liu and S. Baskaran, Chem. Mater., 1997, 9(11), 2507–2512 CrossRef.
- P. Wang, B. Shen and J. Gao, Catal. Commun., 2007, 8, 1161–1166 CrossRef CAS.
- C. A. Emeis, J. Catal., 1993, 347–354 CrossRef CAS , 0021-9517..
- A. Karlsson, M. Stöcker and R. Schmidt, Microporous Mesoporous Mater., 1999, 27, 181–192 CrossRef CAS.
- H. Hu, J. Lyu, J. Rui, J. Cen, Q. Zhang, Q. Wang, W. Han and X. Li, Catal. Sci. Technol., 2016, 6, 2647–2652 RSC.
- J. B. Higgins, R. B. Lapierre, J. L. Schlenker, A. C. Rohrman, J. D. Wood, G. T. Kerr and W. J. Rohrbaugh, Zeolites, 1989, 9, 358 CrossRef CAS.
- V. Nikolakis, D. G. Vlacho and M. Tsapatsis, Microporous Mesoporous Mater., 1998, 21, 337–346 CrossRef CAS.
- T. Suzuki and T. Okuhara, Microporous Mesoporous Mater., 2001, 43, 83–89 CrossRef CAS.
- Y. Yue, H. Liu, Y. Zhou, Z. Bai and X. Bao, Appl. Clay Sci., 2016, 126, 1–6 CrossRef CAS.
- X. Li, S. Liu, X. Zhu, Y. Wang, S. Xie, W. Xin, L. Zhang and L. Xu, Catal. Lett., 2011, 141, 1498–1505 CrossRef CAS.
- Y. Cheng, Trans. Nonferrous Met. Soc. China, 2016, 26, 2197–2208 CrossRef CAS.
- J. C. Groen, S. Abelló, L. A. Villaescusa and J. Pérez-Ramírez, Microporous Mesoporous Mater., 2008, 114, 93–102 CrossRef CAS.
- H. Li, S. He, K. Ma, Q. Wu, Q. Jiao and K. Sun, Appl. Catal., A, 2013, 450, 152–159 CrossRef CAS.
- D. M. Sung, Y. H. Kim, E. D. Park and J. E. Yie, Res. Chem. Intermed., 2010, 36, 653–660 CrossRef CAS.
- Z. Zhu, H. Xu, J. Jiang, Y. Guan and P. Wu, Appl. Catal., A, 2018, 52–63 CrossRef CAS , 0926-860X..
- X. Yang, J. Bian, J. Huang, W. Xin, T. Lu, C. chen, Y. Su, Z. Lipeng, F. Wang and J. Xu, Green Chem., 2017, 19, 692–701 RSC.
- M. Casagrande, L. Storaro, M. Lenarda, J. Gersich, L. Stievano, F. E. Wagnerc and T. Montanarid, J. Mater. Chem., 2004, 14, 1010–1016 RSC.
- A. Bazyari, A. A. Khodadadi, N. Hosseinpour and Y. Mortazavi, Fuel Process. Technol., 2009, 90, 1226–1233 CrossRef CAS.
- J. Qi, Q. Jin, K. Zhao and T. Zhao, J. Porous Mater., 2015, 22, 1021–1032 CrossRef CAS.
- N. Hosseinpour, Y. Mortazavi, A. Bazyari and A. A. Khodadadi, Fuel Process. Technol., 2009, 90, 171–179 CrossRef CAS.
- N. A. A. Fatah, A. A. Jalil, M. L. Firmansyah, S. Triwahyono, H. D. Setiabudi and D. V. N. Vo, Int. J. Hydrogen Energy, 2020 DOI:10.1016/j.ijhydene.2019.12.215.
Footnote |
| † Electronic supplementary information (ESI) available. See DOI: 10.1039/d1ra03064g |
| This journal is © The Royal Society of Chemistry 2021 |

