
 Open Access Article
 This Open Access Article is licensed under a Creative Commons Attribution-Non Commercial 3.0 Unported Licence
W2N/WC composite nanofibers as an efficient electrocatalyst for photoelectrochemical hydrogen evolution
Yueyue Cao,
Lanfang Wang ,
Moyan Chen and
Xiaohong Xu*
,
Moyan Chen and
Xiaohong Xu*
Key Laboratory of Magnetic Molecules and Magnetic Information Materials of Ministry of Education, School of Chemical and Material Science, Shanxi Normal University, Linfen, 041004, China. E-mail: xuxh@sxnu.edu.cn
First published on 7th June 2021
Abstract
A tungsten-based electrocatalyst for hydrogen evolution reaction is vital for developing sustainable and clean energy sources. Herein, W2N/WC composite nanofibers were synthesized through electrospinning technology and simultaneous carbonization and N-doping at high temperature. The composite nanofiber has higher catalytic activity than any simple compound. It exhibits remarkable hydrogen evolution performance in acidic media with a low overpotential of −495 mV, at a current density of −50 mA cm−2. The excellent hydrogen evolution performance of the composite nanofiber could be attributed to the abundant active sites, strong light absorption and fast charge transfer. The method used in this work provides a new possibility for the fabrication of high-performance electrocatalysts rationally.
1. Introduction
With the increasing intensity of global warming and the energy crisis, looking for renewable and clean energy has triggered broad attention.1 Among the potential clean energy sources, hydrogen energy is one of the most sustainable and clean ones.2 However, most current hydrogen energy production mainly relies on the steam reforming reaction of fossil fuels, which not only consumes fossil fuel energy, but also inevitably produces CO2 and even sulfur oxide gas emissions.3 Fortunately, electrocatalytic hydrogen evolution is considered to be a clean and efficient method of producing high-purity hydrogen.4,5 Thus, choosing a suitable electrocatalyst to drive the hydrogen evolution reaction (HER) has become the top priority of research. Up to now, the Pt-based metal catalyst has been the most effective HER electrocatalyst.6,7 Unfortunately, due to the relatively low reserves and relatively high cost, Pt-based metal catalysts cannot be widely used. Therefore, non-precious metal catalysts, such as transition-metal sulfides, nitrides, carbides, oxides, and phosphides and their complexes, have been widely studied to replace noble metal catalysts.8–13Among the earth-abundant and inexpensive catalysts, tungsten-based catalysts, such as carbides and nitrides, have gained considerable interest for HER because of their unique properties, such as Pt-like electronic structure, good electrical conductivity and chemical inertness in acidic and basic solutions.14–16 Especially, due to the narrow band gap of 2.2 eV, W2N was usually used as a potential photocatalyst for photoelectrochemical hydrogen production.17 Moreover, it has been theoretically and experimentally displayed that tungsten nitride/tungsten carbide (W2N/WC) heterostructure catalyst exhibits outstanding synergistic enhancement in HER activity, which is much better than their individual material.18–20 On account of this, a great deal of fabrication methods has been used to prepare the heterostructure, including solvothermal, solid-state synthesis and colloidal chemistry.21–23 Unfortunately, as a notably general technique to prepare nanofibers with more active sites, electrospinning is rarely used to prepare W2N/WC heterostructure nanofibers.
In this work, W2N/WC heterostructure nanofibers have been successfully synthesized by using electrospinning technology and simultaneously carbonization and N-doping at high temperature. This synthesized W2N/WC heterostructure nanofiber is displayed remarkable photoelectrochemical hydrogen production performance. The nanofiber architecture exposes more active sites for electrochemical HER. The light harvesting as well as the interface between W2N and WC facilitates charge transport and thus promotes HER kinetics. We believe that it is a versatile way to develop heterostructure materials with better conductivity and HER activity.
2. Experimentals
Materials
The polyvinylpyrrolidone (PVP), tungsten hexachloride (WCl6), melamine and Dubang D520 Nafion with a content of 5% are from Aladdin. N,N-Dimethylformamide (DMF) and isopropanol were purchased from Tianjin Komiou Chemical Reagent Co., Ltd. Ethanol absolute was purchased from Tianjin Guangfu Technology Development Co., Ltd. Sulfuric acid was purchased from Luoyang Chemical Reagent Factory. Commercial Pt/C catalyst was from Macklin, the content was 20%. The carbon paper is provided by Toray, the model is TGP-H-060 hydrophilic carbon paper.Synthesis of WO3 nanofibers
First, a mixed solution of absolute ethanol and DMF with a volume ratio of 1![[thin space (1/6-em)]](https://www.rsc.org/images/entities/char_2009.gif) :4 is used as a solvent. Subsequently, 4 g of PVP was added to 50 ml of the mixed solution and stirred at room temperature until completely dissolved. Afterward, 4 g WCl6 was slowly added to the stirring 20 ml PVP solution and stirred at room temperature for 12 h to obtain a royal blue spinning solution. The spinning solution is transferred to a 10 ml syringe. The distance between the needle and the collector is 11 cm. Electrospinning is carried out at a flow rate of 0.4 ml h−1 under a high voltage electric field of 11 kV. During the spinning process, the equipment has vents that can be exchanged with outside air. The sample obtained on the collector is retains royal blue. After the sample is dried in a vacuum drying oven at 80 °C for 12 h, the color of the sample will change to light yellow. Then, the precursor nanofibers were calcined at different temperatures (T = 470 °C, 480 °C, 490 °C, 500 °C, 510 °C) for 0.5 h (rising rate 1 °C min−1) in air atmosphere. Finally, WO3 nanofibers was obtained.
:4 is used as a solvent. Subsequently, 4 g of PVP was added to 50 ml of the mixed solution and stirred at room temperature until completely dissolved. Afterward, 4 g WCl6 was slowly added to the stirring 20 ml PVP solution and stirred at room temperature for 12 h to obtain a royal blue spinning solution. The spinning solution is transferred to a 10 ml syringe. The distance between the needle and the collector is 11 cm. Electrospinning is carried out at a flow rate of 0.4 ml h−1 under a high voltage electric field of 11 kV. During the spinning process, the equipment has vents that can be exchanged with outside air. The sample obtained on the collector is retains royal blue. After the sample is dried in a vacuum drying oven at 80 °C for 12 h, the color of the sample will change to light yellow. Then, the precursor nanofibers were calcined at different temperatures (T = 470 °C, 480 °C, 490 °C, 500 °C, 510 °C) for 0.5 h (rising rate 1 °C min−1) in air atmosphere. Finally, WO3 nanofibers was obtained.
Synthesis of W2N/WC nanoarray
WO3 nanofibers and melamine are heated to different temperatures (600 °C, 700 °C, 750 °C, 800 °C, 900 °C, 1000 °C) at a heating rate of 5 °C min−1, maintained in Ar/H2 atmosphere (VH2/VAr = 1:19, 40 ml min−1) for 3 h, and finally cooled to room temperature.
Characterization methods
The samples were characterized and analyzed by X-ray diffraction (XRD, Ultima IV-185, Rigaku) with filtered Cu kα radiation and X-ray photoelectron spectroscopy (XPS, Thermo Fisher Scientific K-AlPHAþ, US) with Al kα radiation. The morphology and structure of the samples were characterized using scanning electron microscopy (SEM, JEOL JSM-7500F, Japan) and transmission electron microscopy (TEM). The light absorption of the sample was measured using an ultraviolet-visible spectrophotometer (UV-vis, TU-1901).Electrochemical measurements
The electrochemical test was carried out in 0.5 M H2SO4 solution using a standard three-electrode system. We used Ag/AgCl electrodes as reference electrodes, platinum wire electrodes as counter electrodes, and platinum sheet electrodes sandwiched with sample-loaded carbon fiber paper as working electrodes. Typically, the sample electrode is ultrasonically processed at room temperature with a mixture of 4 mg of sample, 2.5 μl of Nafion dispersion, and 0.25 ml of isopropanol to obtain a uniformly dispersed catalyst ink. Then, 20 μl of catalyst ink was dropped evenly on the 1 × 1 cm carbon fiber paper. Finally, the carbon fiber paper was placed in a vacuum drying oven at 60 °C for 2 h. The hydrogen evolution performance of CFP and commercial Pt/C catalyst was tested as a reference. The Pt/C electrode was made by the same procedure as the sample electrode. The loading capacity of our prepared catalyst and commercial Pt/C catalyst are both 0.32 mg cm−2. The photocurrent response were carried out under 300 W Xenon lamp.3. Results and discussion
W2N/WC composite nanofibers were prepared by electrospinning technology and simultaneously carbonization and N-doping (see the “Experimentals” for details). As shown in Fig. 1, WO3 nanofibers were fabricated by electrospinning and post-annealing treatment, and then an in situ reaction with melamine was employed under high temperature for the controllable N-doping.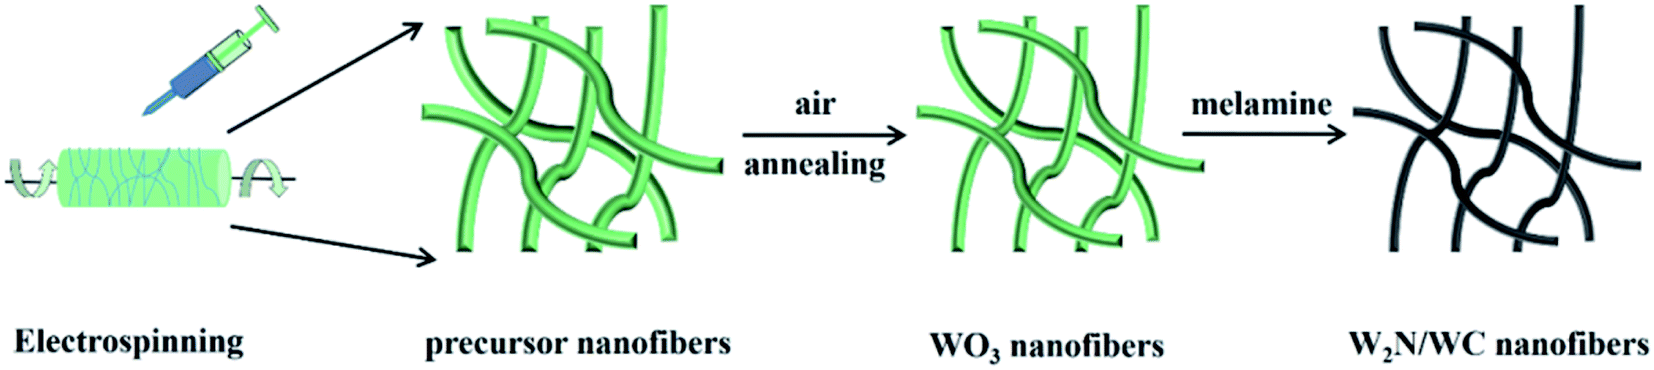 | ||
| Fig. 1 Schematic diagram of preparation of W2N/WC composite nanofibers. | ||
Fig. 2a–f shows SEM images of the as-spun precursor nanofibers and WO3 nanofibers annealed at different temperature (470–510 °C). It can be clearly observed that the precursor nanofibers have good continuity with a diameter of about 500 nm, and the surface of nanofiber is smooth. After annealed at high temperature, the surface of nanofiber begins to show some bumps and unevenness. With the increase of annealing temperature, there are more and more non-smooth scaly protrusions on the surface of the sample, which is consistent with the results of existing reports.24,25 Fig. 2g shows the XRD patterns of the as-spun precursor nanofibers and WO3 nanofibers treated with different annealing temperatures (470–510 °C). After high temperature treatment, the sample begins to show the characteristic peaks of WO3. The diffraction peak appearing at 20–25° corresponds to the composite peaks of WO3 (001), (020) and (200), the peak at 30–35° corresponds to the composite peak of WO3 (021), (201) and (220). The appearance of recombination peak may be due to the poor crystallinity of WO3 annealed at lower temperature. As the annealing temperature increases, the peaks at 20–25° and 30–35° begin to appear split peaks, and some new, weaker characteristic peaks appear. The peak at 28.7° corresponds to WO3 (111), the peak at 41.5° corresponds to WO3 (221). The positions of various peaks correspond to the standard XRD pattern of WO3 (PDF#20-1324).26 It can be seen that with the annealing temperature increases, the diffraction peaks become more and more obvious, which means the increased crystallinity of sample. In the subsequent high-temperature conversion treatment, the sample should not only have the typical diffraction peak of WO3, that is, good crystallinity, but also have good fiber continuity and cannot be broken. So we choose the nanofiber annealed at 490 °C undergoes subsequent high temperature carbonization and N-doping.
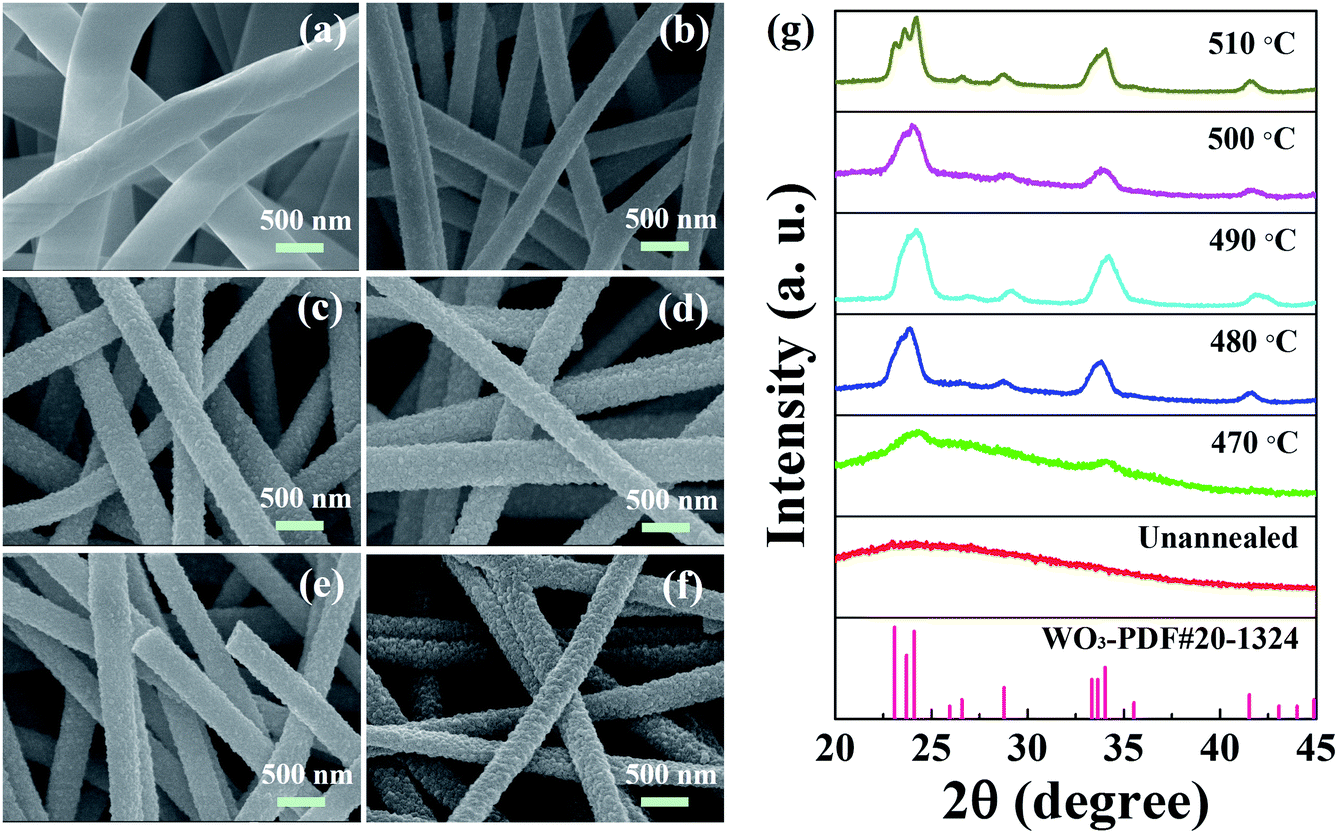 | ||
| Fig. 2 SEM images of the as-spun precursor nanofibers (a) and WO3 nanofibers annealed at 470 °C (b), 480 °C (c), 490 °C (d), 500 °C (e) and 510 °C (f). The corresponding XRD images (g). | ||
After carbonization and N-doping, the SEM images of nanofibers prepared at different conversion temperatures (600–1000 °C) are shown in Fig. 3a–f. It can be observed that the nanofibers still maintain a linear morphology without adhesion during the high-temperature conversion process. As the annealing temperature increases, the diameter of nanofibers tends to decrease. This may be because the crystallinity of nanofibers becomes better at high temperatures and nanofibers become denser.17,27 Fig. 3g shows the XRD patterns of nanofibers treated with different conversion temperatures. When the conversion temperature is 600 °C, the characteristic peak of W2N first appears. The characteristic peak at 37.7° can be well in line with the (111) plane of W2N. The characteristic peak at 43.8° can be attributed to (200) of W2N, which corresponds to W2N (PDF#25-1257).20 There is no WC characteristic peak at all, indicating that all nanofibers are nitrided to W2N. When the conversion temperature reaches 750 °C, the characteristic peak of WC begins to appear. The peak at 48.3° can match with WC (101), corresponding to WC (PDF#51-0939).18 This indicates that the W2N/WC heterostructure nanofiber was constructed. As the temperature increases, the content of WC gradually increases, and the content of W2N gradually decreases. When the conversion temperature reaches 1000 °C, the characteristic peaks of WC appear, corresponding to WC (001), WC (100), WC (101). There are almost no characteristic peaks of W2N, which means that the nanofibers annealed at 1000 °C are mainly WC. Therefore, by controlling the annealing temperature, we can adjust the degree of carbonization of WO3 nanofibers, and adjust the content of WC in the W2N/WC composite nanofibers to transform pure W2N into W2N/WC composites, eventually transformed into WC.
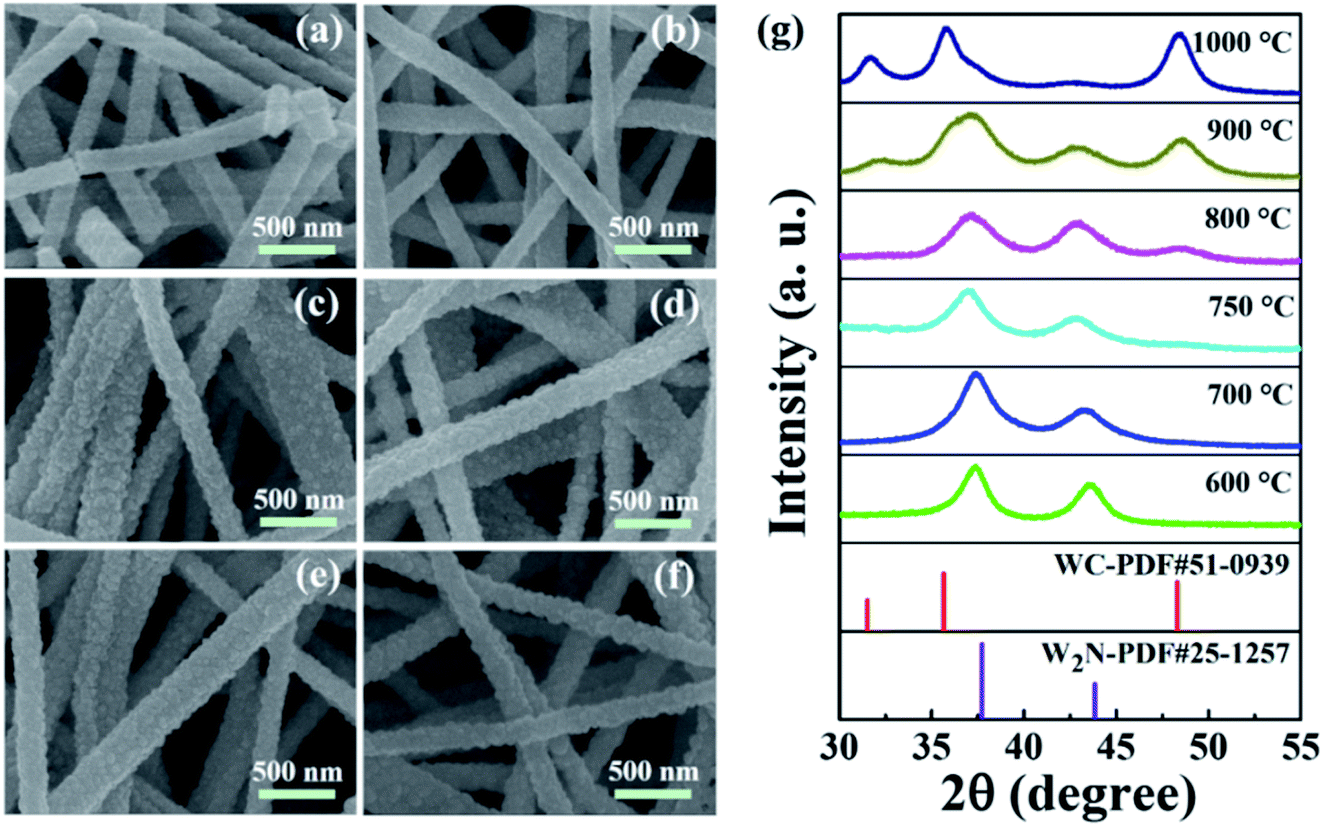 | ||
| Fig. 3 SEM images of the nanofibers after carbonization and N-doping at 600 °C (a), 700 °C (b), 750 °C (c), 800 °C (d), 900 °C (e) and 1000 °C (f). The corresponding XRD images (g). | ||
To investigate the effect of conversion temperatures on the catalytic performance, the catalytic properties of nanofibers toward HER were measured in 0.5 M H2SO4 solution. Fig. 4a displays the LSV curve of CFP, WO3, as well as carbonization and N-doping W2N/WC composite nanofibers. They are tested under dark conditions. The tested voltage range is 0 V to −0.9 V (V vs. Ag/AgCl). The speed is 10 mV s−1. It can be seen that as the conversion temperature increases, the onset overpotential decreases and then increases. The W2N/WC composite nanofibers treated at 750 °C have the smallest onset potential, the required overpotential is approximately −516 mV at −50 mA cm−2. This indicates that the W2N/WC composite nanofibers treated at 750 °C have the largest hydrogen evolution catalytic activity. Fig. 4b is the EIS diagram of each sample tested at −0.8 V. It can be seen that the W2N/WC composite nanofibers treated at 750 °C have the smallest arc radius, which means smaller resistance and fast interface charge transfer.1,28 Therefore, the W2N/WC composite nanofibers treated at 750 °C have a relatively small overpotential, which can correspond well to Fig. 4a.
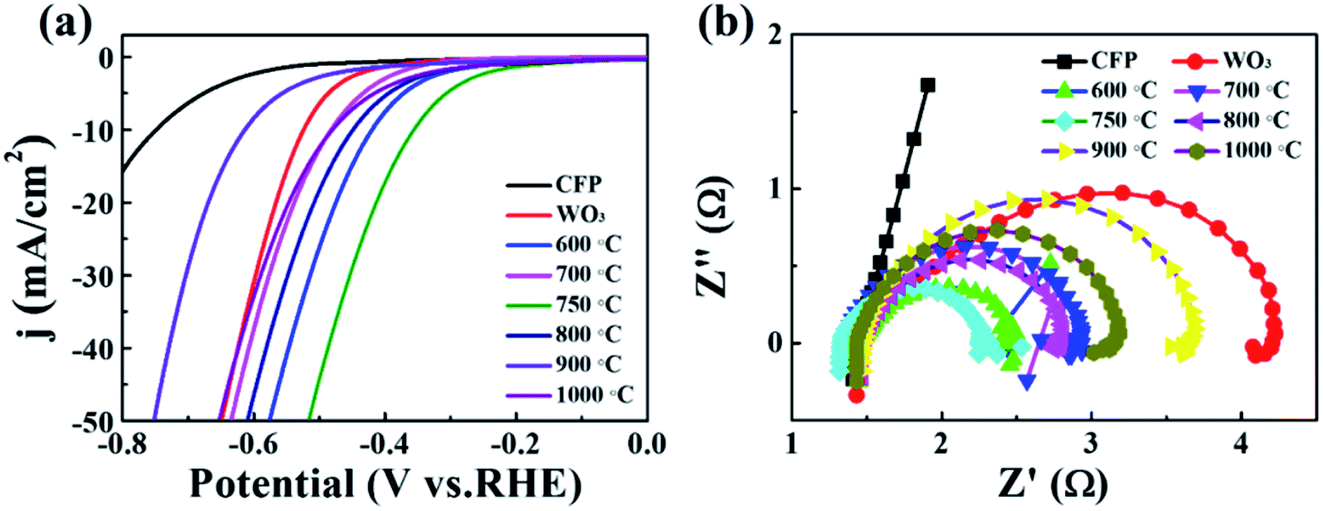 | ||
| Fig. 4 (a) LSV curve and (b) EIS diagram of CFP, WO3, carbonization and N-doping W2N/WC composite nanofibers at different temperatures (600–1000 °C). | ||
In order to clearly elucidate the increasing catalytic activity of W2N/WC composite nanofibers treated at 750 °C, we tested the electrochemically active specific surface area (ECSA) of each sample. The CV curve with different scan rates (5, 10, 15, 20, 25, 30 mV s−1) was used to characterize the electrochemical capacitance behavior of the sample with the same apparent area in the faradaic zone. Fig. 5a–h shows the CV curves of different samples in 0.5 M H2SO4 solution. According to the following formula, the double-layer capacitance Cdl (mF) of different samples can be obtained:29
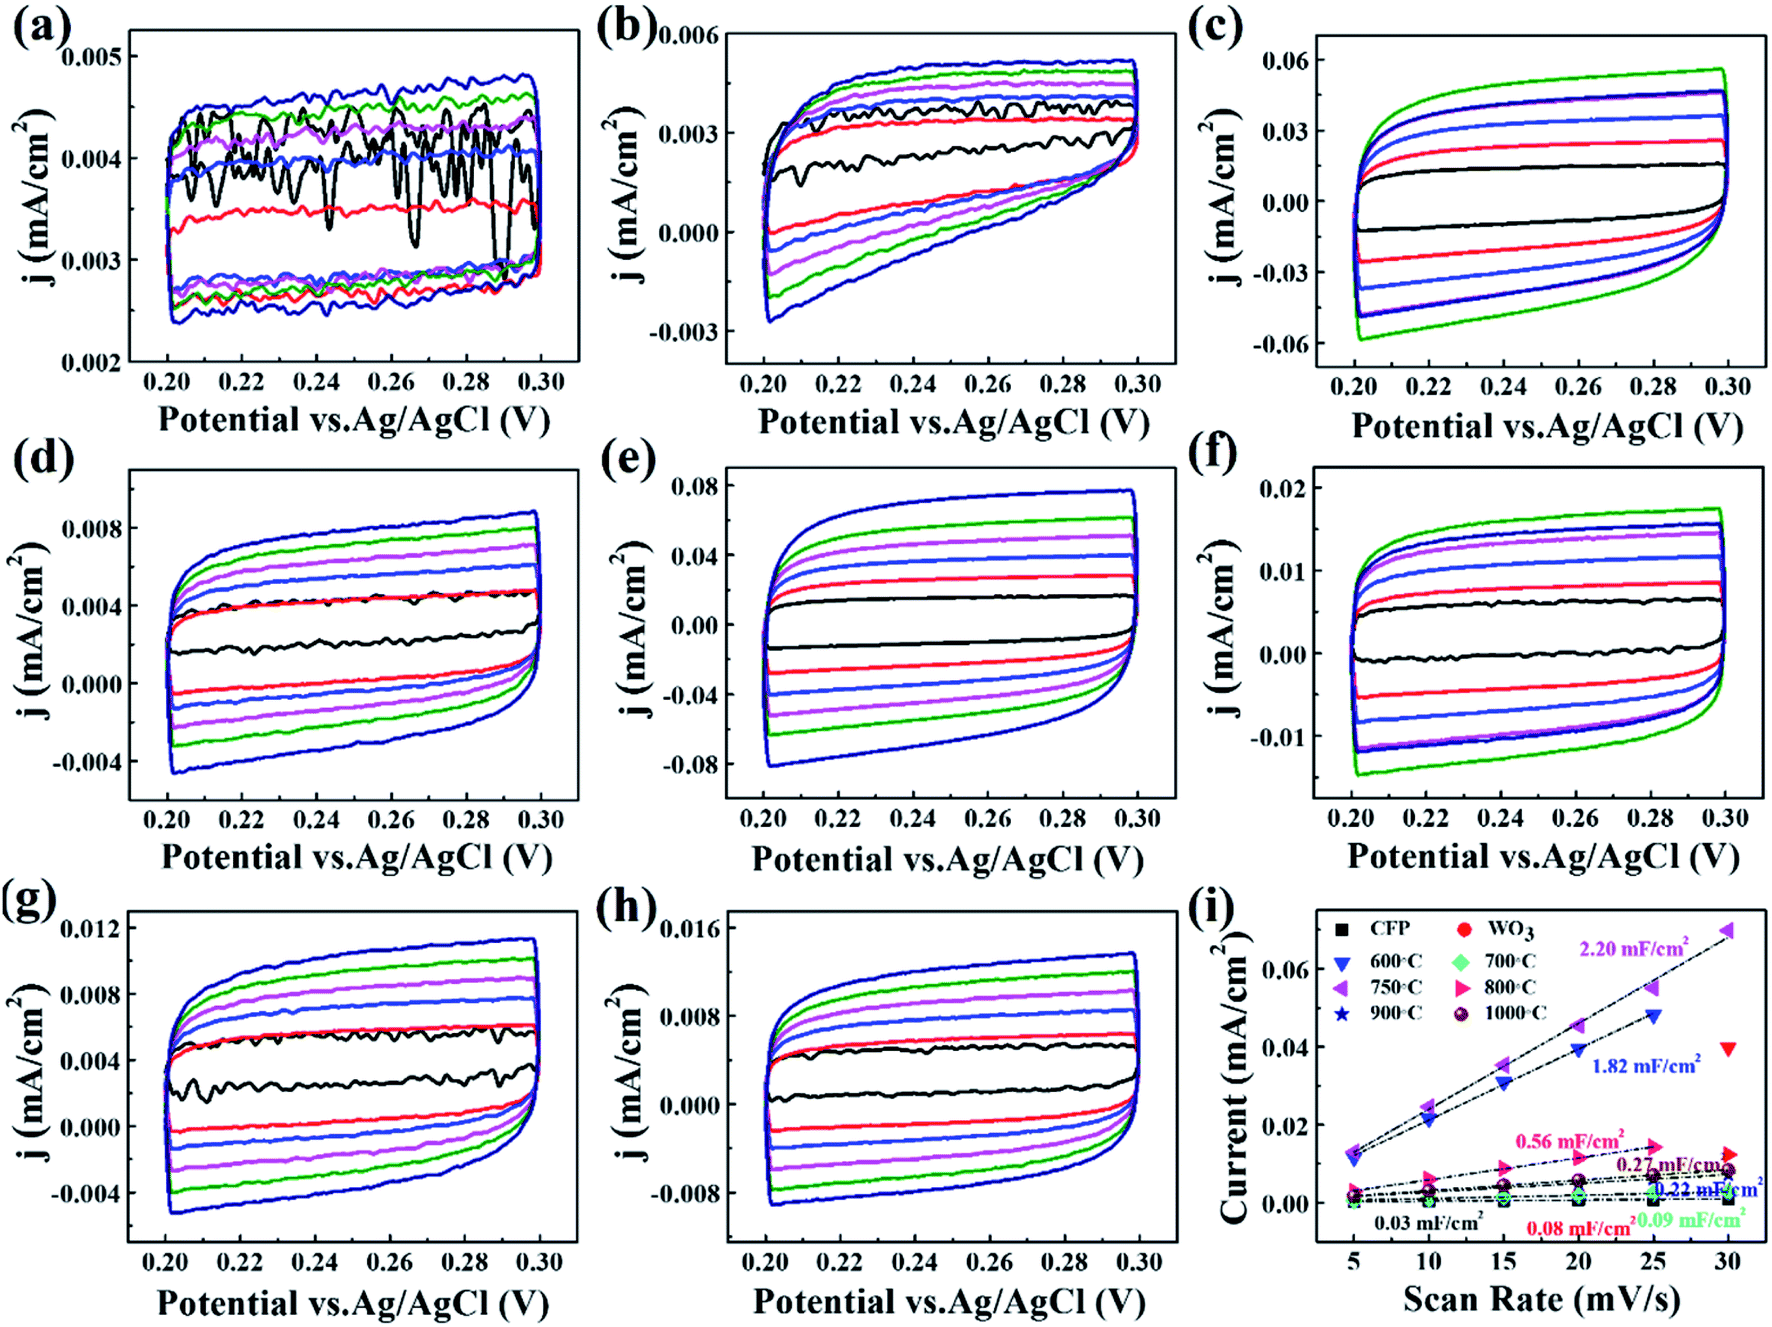 | ||
| Fig. 5 The CV curve of CFP (a), WO3 (b), carbonization and N-doping W2N/WC composite nanofibers with different scanning speeds (5–30 mV s−1) treated at 600 °C (c), 700 °C (d), 750 °C (e), 800 °C (f), 900 °C (g), 1000 °C (h). (i) The average charge current as a function of scan rate from CV curves in (a–h). | ||
| Cdl = I/n |
In order to further analyze the morphology and composition of W2N/WC composite nanofibers treated at 750 °C, we conducted transmission electron microscopy (TEM) and selected area electron diffraction. Fig. 6a is the TEM image of W2N/WC nanofiber. It can be seen that the nanofibers have uniform diameters and rough surfaces, showing good nanofibers morphology. Fig. 6b is a high-resolution transmission electron microscope image. It can be seen that the lattice spacing of 0.23 nm correspond to the (111) plane of W2N, and the lattice spacing of 0.18 nm corresponds to the (101) plane of WC. The diffraction rings in the selected area electron diffraction pattern are shown in Fig. 6c, which can corresponds to the (111), (200), (222) crystal planes of W2N and the (101), (110) crystal planes of WC, respectively.20 Fig. 6d–g is the element mapping diagram of W, C, and N. Obviously, the elements of W, C, and N are evenly distributed on the nanofibers. These results confirm that the nanofibers treated at 750 °C are W2N/WC composite nanofibers.
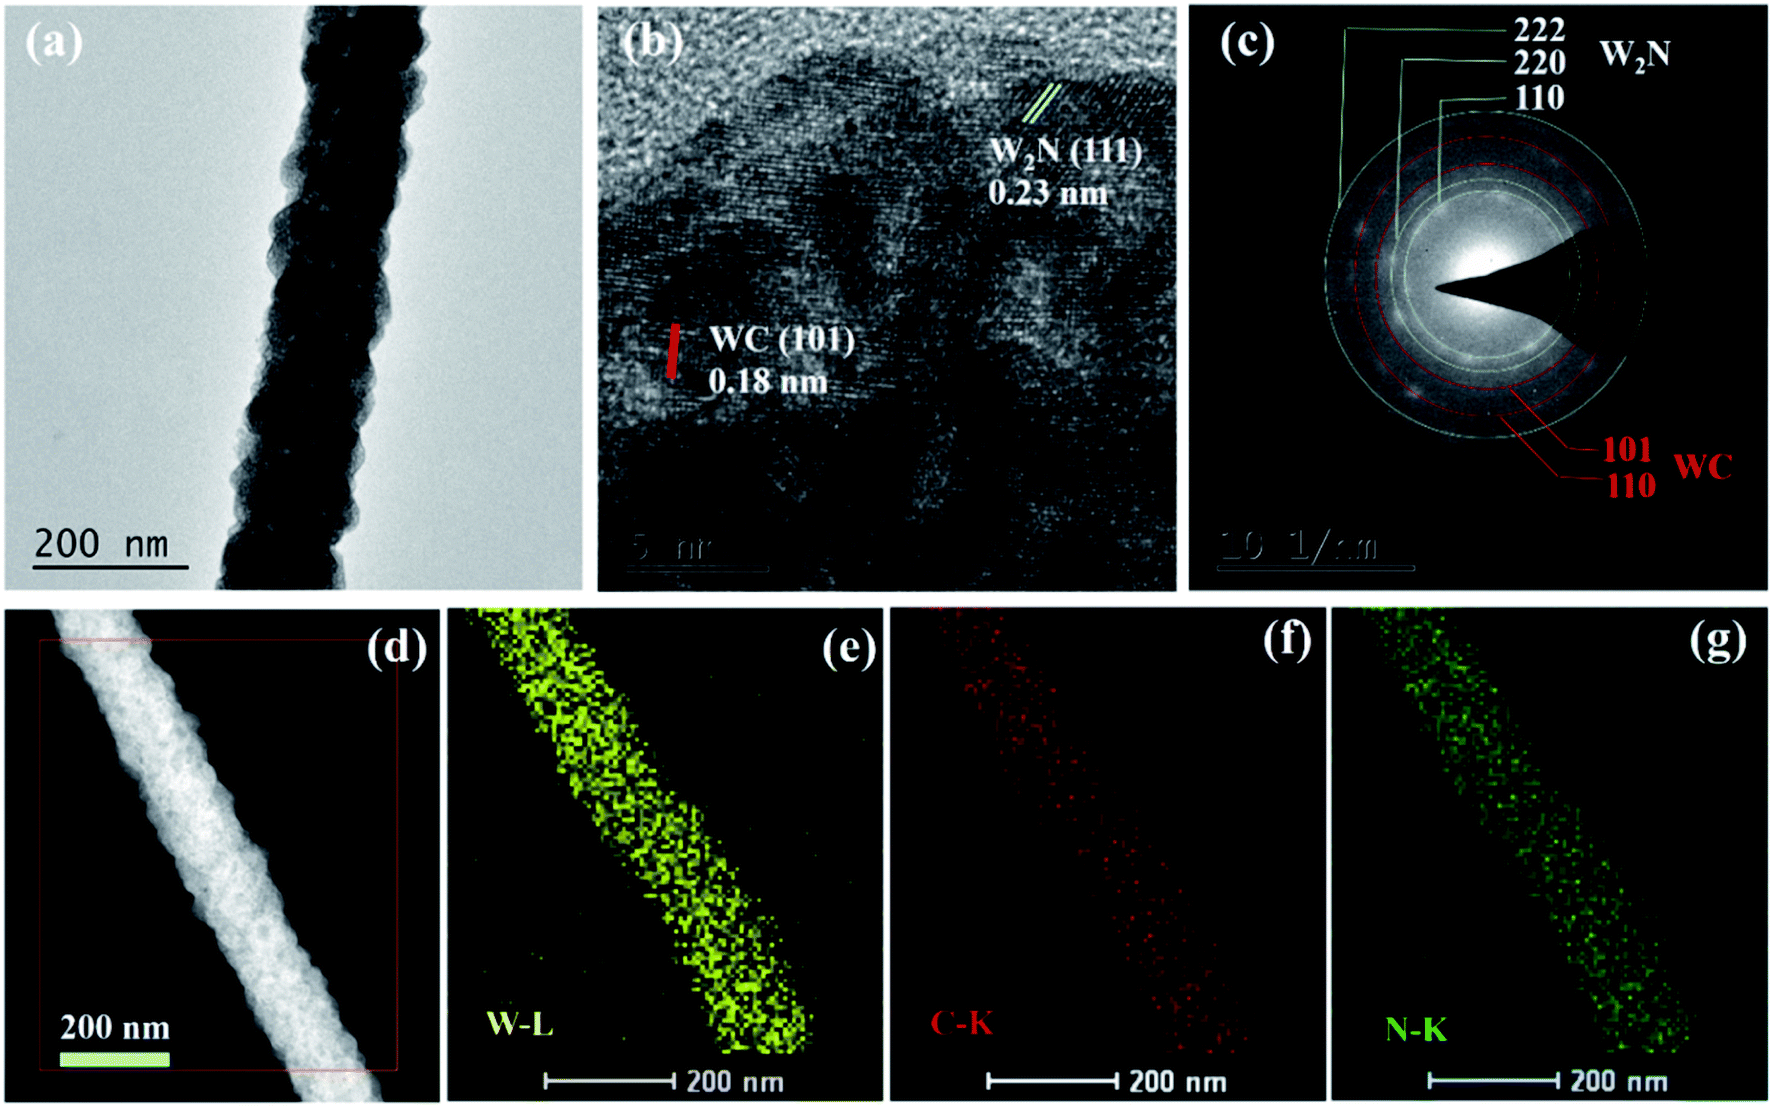 | ||
| Fig. 6 (a and b) TEM image, (c) SAED image and (d–g) element mapping image of W2N/WC nanofiber. | ||
In order to identify the surface elements and valence state information of the W2N/WC composite nanofibers treated at 750 °C, X-ray photoelectron spectroscopy (XPS) are shown in Fig. 7. Fig. 7a is the XPS total spectrum. We can observe the presence of W, C, N, and O elements. Fig. 7b is a high-resolution W 4f spectrum. The two peaks at the lower binding energy of 32.2 and 34.4 eV are typical characteristic peaks of W–C.31,32 The peaks at 35.6 and 37.9 eV are attributed to the W–N bond.33 Fig. 7c is the spectrum of C 1s. The peak at 284.5 eV can be attributed to the existence of the W–C bond. The N 1s spectrum in Fig. 7d also proves the existence of the N–W bond. The fitting peaks at 398.8 and 401.6 eV can be attributed to the characteristics of the N–C bond, while the peak at 397.6 eV is attributed to the N–W bond.34 This further confirms the formation of W2N/WC composite nanofibers.
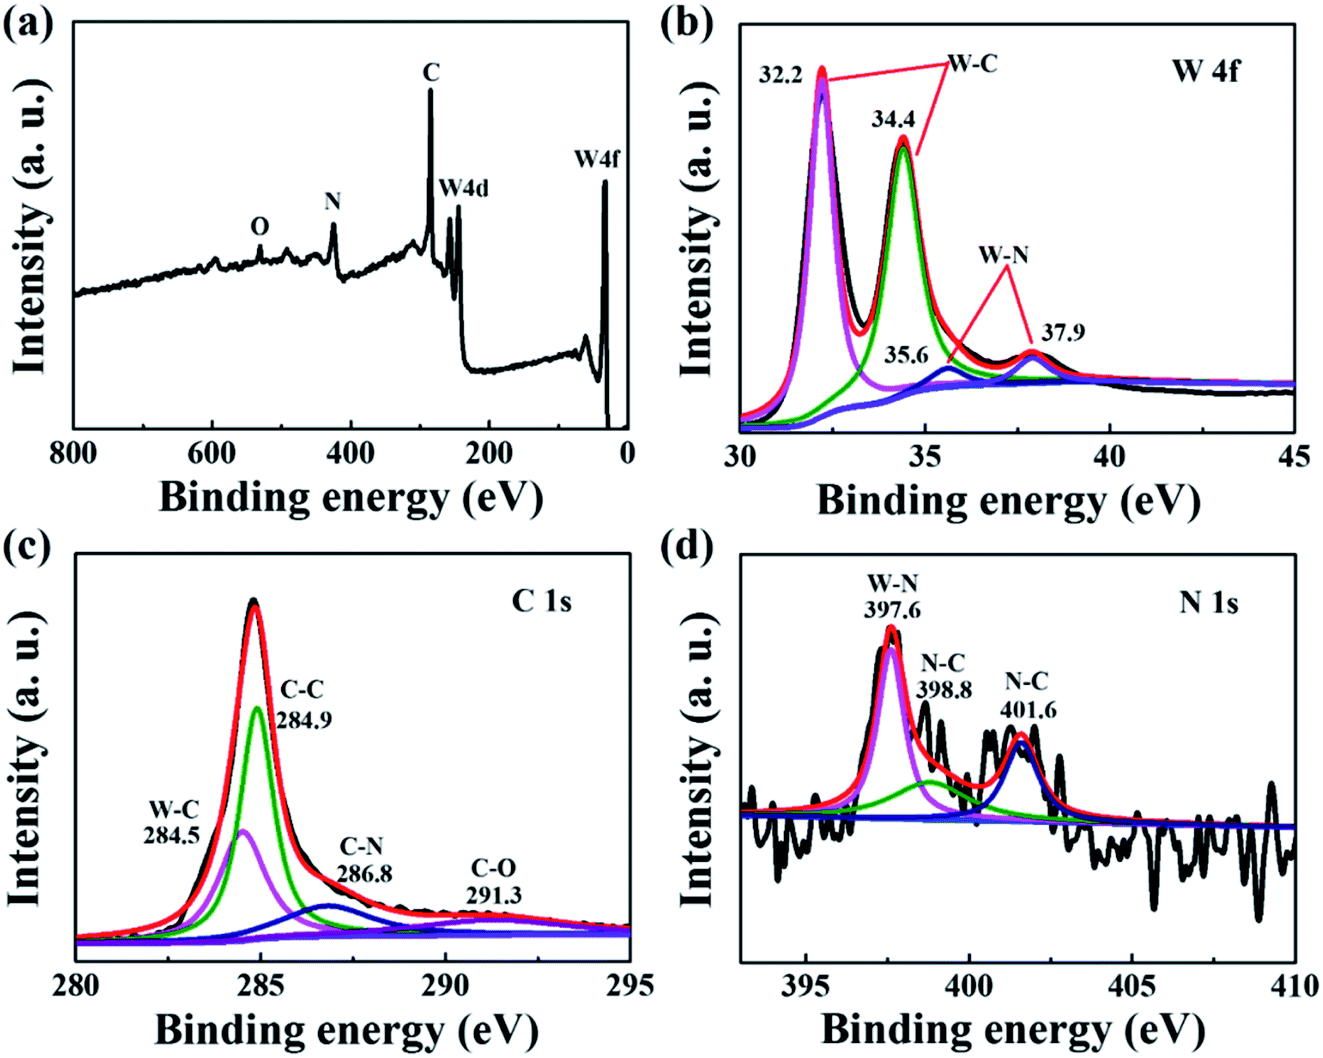 | ||
| Fig. 7 (a) W2N/WC nanofiber XPS total spectrum; (b) W 4f; (c) C 1s; (d) N 1s high-resolution XPS image. | ||
The photoelectrocatalytic HER performance of WO3, W2N (treated at 600 °C), W2N/WC (treated at 750 °C) and WC (treated at 1000 °C) was also investigated. Fig. 8a is the LSV curve of different samples under simulated sunlight. Compared with W2N and WC catalyst, the onset overpotential of W2N/WC composite catalyst is smaller. When a current density of −50 mA cm−2 is obtained, the W2N/WC composite catalyst only needs an overpotential of −495 mV, which is much lower than that for W2N catalyst (−549 mV), WC catalyst (−619 mV) and WO3 catalyst (−641 mV). This means that W2N/WC composite catalyst has the highest hydrogen evolution performance. Noteworthily, these values are lower than that for the corresponding catalysts under dark condition (as shown in Fig. 4a). Fig. 8b shows the photocurrent response (I–t) results of various catalysts. Compared with WO3, W2N and WC catalysts, W2N/WC composite catalysts have greater photocurrent response. The corresponding ultraviolet-visible absorption spectrum is shown in Fig. 8c. W2N/WC composite catalyst has a stronger light absorption than W2N and WC, and has a wider absorption spectrum than WO3, which means the maximize use of sunlight. Fig. 8d is an EIS image under simulated sunlight. W2N/WC catalyst also shows the smallest interface resistance, which means that the interface charge transfer rate is faster. Nevertheless, the larger ECSA, stronger light absorption and faster charge transfer in the W2N/WC composite nanofiber are largely responsible for such excellent hydrogen evolution performance.
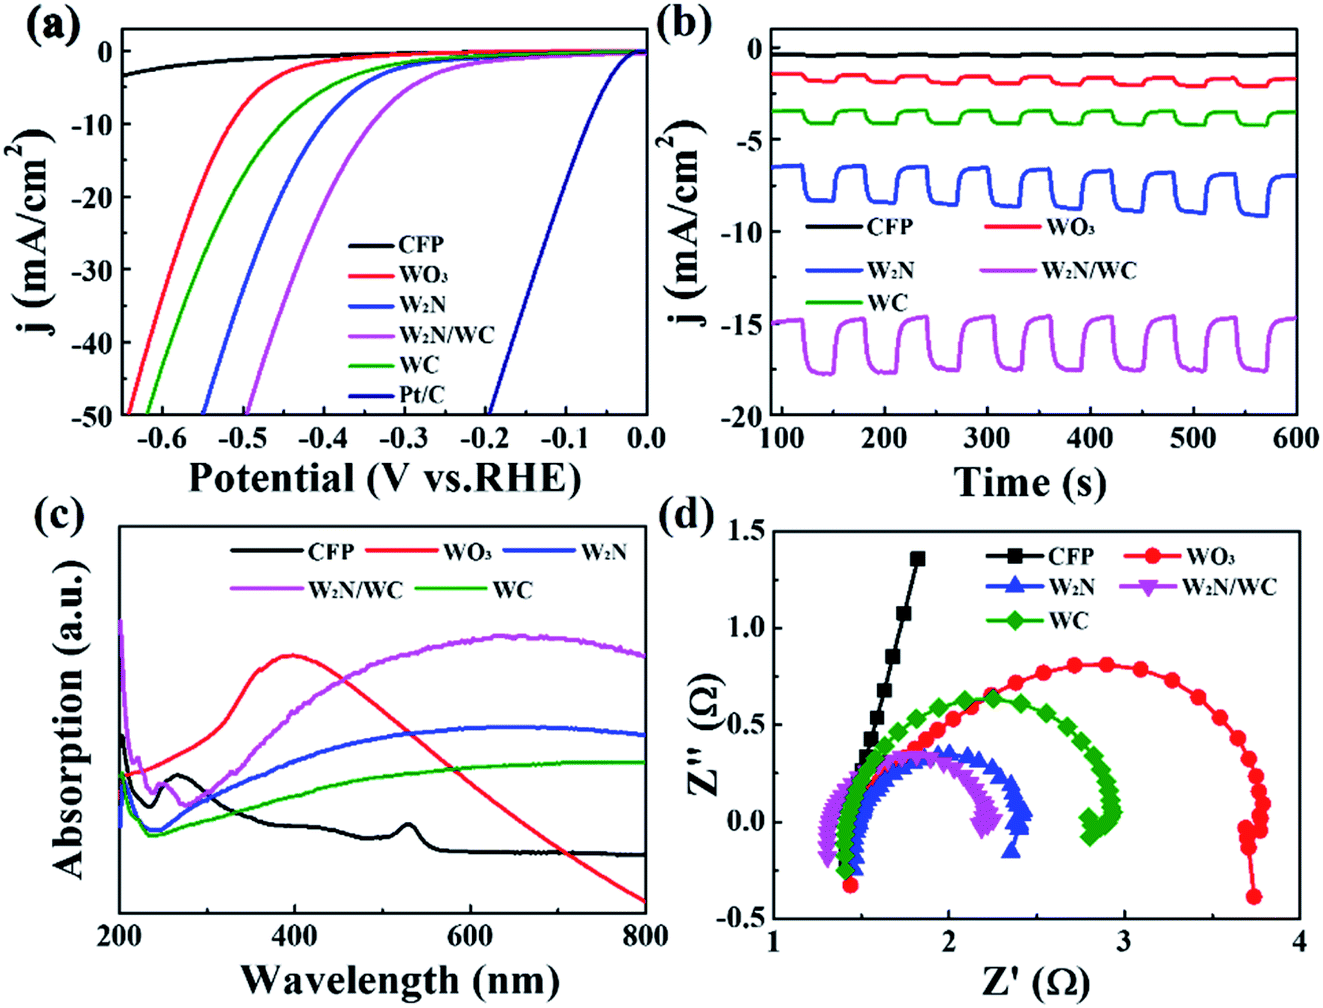 | ||
| Fig. 8 (a) LSV curve of CFP, WO3, W2N, W2N/WC, WC and commercially available Pt/C catalysts tested in 0.5 M H2SO4 solution under light conditions. (b) The photocurrent response curve under −0.6 V. (c) Ultraviolet-visible absorption spectrum. (d) EIS spectrum under −0.8 V. | ||
4. Conclusion
In summary, we have successfully constructed a WO3 nanofiber as precursor and performed subsequent carbonization and N-doping for the formation of the W2N/WC composite nanofibers. The optimized W2N/WC composite nanofibers with abundant active sites exhibits outstanding photoelectrocatalytic activity for HER in acid media, including low onset overpotential and large photocurrent response. The fast transfer of interfacial charge, the larger ECSA and stronger light absorption, eventually improves the HER performance of W2N/WC composite nanofiber. This preparative strategy opens a new avenue to prepare tungsten-based HER catalyst, and thus provides a new possibility for the fabrication of high-performance electrocatalysts rationally.Conflicts of interest
There are no conflicts to declare.Acknowledgements
This work was supported by National Key R&D Program of China (No. 2017YFB0405703), the Applied Basic Research Project of Shanxi Province (No. 201801D221392), and the Graduate Science and Technology Innovation Project Foundation of Shanxi Normal University (Grant no. 2019XSY024).References
- J. Zhu, L. Hu, P. Zhao, L. Y. S. Lee and K. Y. Wong, Chem. Rev., 2019, 120, 851–918 CrossRef PubMed.
- J. Xie, J. Qi, F. Lei and Y. Xie, Chem. Commun., 2020, 56, 11910–11930 RSC.
- T. Li, T. Hu, L. Dai and C. Li, J. Mater. Chem. A, 2020, 8, 23674–23698 RSC.
- X. Zhang, A. Wang, L. Zhang, J. Yuan, Z. Li and J. Feng, ACS Appl. Energy Mater., 2018, 1, 5054–5061 CrossRef CAS.
- X. Huang, A. Wang, L. Zhang, K. Fang, L. Wu and J. Feng, J. Colloid Interface Sci., 2018, 531, 578–584 CrossRef CAS PubMed.
- W. Luo, J. Gan, Z. Huang, W. Chen, G. Qian, X. Zhou and X. Duan, Frontiers in Materials, 2019, 6, 251 CrossRef.
- C. Li and J. B. Baek, ACS Omega, 2020, 5, 31–40 CrossRef CAS PubMed.
- S. Chandrasekaran, L. Yao, L. Deng, C. Bowen, Y. Zhang, S. Chen, Z. Lin, F. Peng and P. Zhang, Chem. Soc. Rev., 2019, 48, 4178–4280 RSC.
- J. Theerthagiri, S. J. Lee, A. P. Murthy, J. Madhavan and M. Y. Choi, Curr. Opin. Solid State Mater. Sci., 2020, 24, 100805 CrossRef CAS.
- H. Zhang, X. Yang, H. Zhang, J. Ma, Z. Huang, J. Li and Y. Wang, Chem.–Eur. J., 2021, 27, 5074–5090 CrossRef CAS PubMed.
- Y. Zhu, Q. Lin, Y. Zhong, H. A. Tahini, Z. Shao and H. Wang, Energy Environ. Sci., 2020, 13, 3361–3392 RSC.
- C. Weng, J. Ren and Z. Yuan, ChemSusChem, 2020, 13, 3357–3375 CrossRef CAS PubMed.
- Y. Li, X. Wu, H. Zhang and J. Zhang, ACS Appl. Energy Mater., 2018, 1, 3377–3384 CrossRef CAS.
- Y. Ling, F. Luo, Q. Zhang, K. Qu, L. Guo, H. Hu, Z. Yang, W. Cai and H. Cheng, ACS Omega, 2019, 4, 4185–4191 CrossRef CAS PubMed.
- W. P. Mounfield, A. Harale and Y. Román-Leshkov, Energy Fuels, 2019, 33, 5544–5550 CrossRef CAS.
- H. Jin, H. Zhang, J. Chen, S. Mao, Z. Jiang and Y. Wang, J. Mater. Chem. A, 2018, 6, 10967–10975 RSC.
- V. Chakrapani, J. Thangala and M. K. Sunkara, Int. J. Hydrogen Energy, 2009, 34, 9050–9059 CrossRef CAS.
- N. Han, K. R. Yang, Z. Lu, Y. Li, W. Xu, T. Gao, Z. Cai, Y. Zhang, V. S. Batista, W. Liu and X. Sun, Nat. Commun., 2018, 9, 924 CrossRef PubMed.
- Z. Kou, T. Wang, H. Wu, L. Zheng, S. Mu, Z. Pan, Z. Lyu, W. Zang, S. J. Pennycook and J. Wang, Small, 2019, 15, 1900248 CrossRef PubMed.
- J. Diao, Y. Qiu, S. Liu, W. Wang, K. Chen, H. Li, W. Yuan, Y. Qu and X. Guo, Adv. Mater., 2019, 32, 1905679 CrossRef PubMed.
- F. Liu, R. Xu, H. Liu, Z. Yang, Y. Li, C. Wang, H. Jia and C. Yang, ChemistrySelect, 2020, 5, 360–368 CrossRef CAS.
- A. Samal, D. P. Das and G. Madras, Sci. Rep., 2018, 8, 2881 CrossRef PubMed.
- L. Carbone and P. D. Cozzoli, Nano Today, 2010, 5, 449–493 CrossRef CAS.
- Z. He, Q. Liu, H. Hou, F. Gao, B. Tang and W. Yang, ACS Appl. Mater. Interfaces, 2015, 7, 10878–10885 CrossRef CAS PubMed.
- J. Leng, X. Xu, N. Lv, H. Fan and T. Zhang, J. Colloid Interface Sci., 2011, 356, 54–57 CrossRef CAS PubMed.
- X. Zhou, Y. Qiu, J. Yu, J. Yin and X. Bai, J. Mater. Sci., 2012, 47, 6607–6613 CrossRef CAS.
- H. Lee, M. Kim, D. Sohn, S. H. Kim, S. Oh, S. S. Im and I. S. Kim, RSC Adv., 2017, 7, 6108–6113 RSC.
- J. Wang, F. Xu, H. Jin, Y. Chen and Y. Wang, Adv. Mater., 2017, 29, 1605838 CrossRef PubMed.
- C. Mo, J. Jian, J. Li, Z. Fang, Z. Zhao, Z. Yuan, M. Yang, Y. Zhang, L. Dai and D. Yu, Energy Environ. Sci., 2018, 11, 3334–3341 RSC.
- M. Sevilla and R. Mokaya, Energy Environ. Sci., 2014, 7, 1250 RSC.
- X. Fan, H. Zhou and X. Guo, ACS Nano, 2015, 9, 5125–5134 CrossRef CAS PubMed.
- M. B. Zellner and J. G. Chen, Surf. Sci., 2004, 569, 89–98 CrossRef CAS.
- H. Yan, C. Tian, L. Wang, A. Wu, M. Meng, L. Zhao and H. Fu, Angew. Chem., 2015, 127, 6423–6427 CrossRef.
- H. Yan, C. Tian, L. Sun, B. Wang, L. Wang, J. Yin, A. Wu and H. Fu, Energy Environ. Sci., 2014, 7, 1939–1949 RSC.
| This journal is © The Royal Society of Chemistry 2021 |