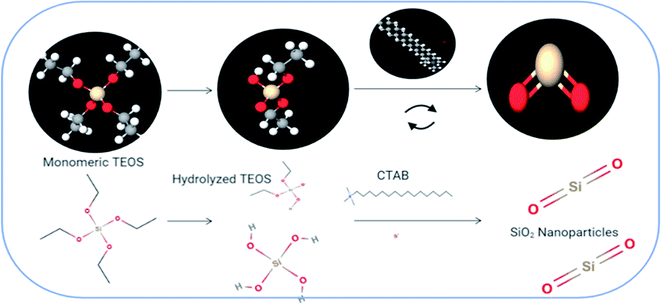
 Open Access Article
Creative Commons Attribution 3.0 Unported Licence
The controlled synthesis and DFT investigation of novel (0D)–(3D) ZnS/SiO2 heterostructures for photocatalytic applications†
Mohamed F. Sanad‡
*ab,
Ahmed Esmail Shalan‡ *cd,
M. A. Ahmeda and
M. F. Abdel Messiha
aChemistry Department, Faculty of Science, Ain Shams University, Egypt. E-mail: mfsanad@miners.utep.edu
bDepartment of Chemistry and Department of Environmental Sciences and Engineering, University of Texas at El Paso, 500 West University Avenue, El Paso, Texas 79968, USA
cCentral Metallurgical Research and Development Institute (CMRDI), P.O. Box 87, Helwan, Cairo, 11422, Egypt. E-mail: a.shalan133@gmail.com; ahmed.shalan@bcmaterials.net
dBCMaterials, Basque Center for Materials, Applications and Nanostructures, Martina Casiano, UPV/EHU Science Park, Barrio Sarriena s/n, Leioa 48940, Spain
First published on 24th June 2021
Abstract
A ZnS/SiO2 photocatalyst was synthesized using a low-cost sol–gel wet chemical procedure. The as-synthesized ZnS/SiO2 nanocomposites with different molar ratios exhibited superior performance in the photodegradation of two organic dyes under UV irradiation, with complete degradation of both dyes after 2 hours of exposure to UV irradiation. The photocatalyst structure, microstructure, and surface area were studied using X-ray diffraction (XRD), high-resolution transmission electron microscopy (HRTEM), field emission scanning electron microscopy (FESEM), and nitrogen adsorption (SBET) studies. The results demonstrate that the ZnS/SiO2 photocatalyst with 15% ZnS content has a bandgap energy similar to that of ZnS alone with a higher surface area of approximately 150 m2 g−1, which effectively increases the number of active sites and improves the photocatalytic activity of the prepared material. The measured bandgap energies were compared with the theoretical values obtained using the density functional theory (DFT) method, and the values were found to be very similar, with a low error percentage. In the case of a high ZnS content (greater than 15%), active site blocking occurred, and the removal rate dropped below 50%. The obtained results indicate that the photocatalytic data are in good agreement with the experimental characterization results for the prepared materials, including the BET and XRD results, confirming a close association between the photocatalytic activity and the surface area of the fabricated photocatalyst.
1. Introduction
The need for clean water is growing in all regions of the world, while renewable water resources have become limited due to the effects of climate change and human usage.1–6 This environmental scarcity has pushed the research community to adopt new methods for the systematic management of clean water, as traditional techniques are not sufficient to remove pollutants such as fragments of organic dye waste in rivers.7–11 Photo-removal can represent the best, simplest, and most sustainable route for achieving the oxidation process using sunlight.12–14 Semiconductor-assisted photocatalysis is based on the fact that radicals and superoxides can be produced by photo-irradiation of the semiconducting materials, which in turn can oxidize and remove organic pollutants. The interaction of the radicals and superoxides with the organic materials is the key parameter of the degradation of hazardous materials into environmentally acceptable species.15,16 Metal oxides such as ZnO, SnO2, and TiO2, among others, have been studied intensively as promising photocatalysts, as they have many merits such as availability, photo- and thermal-stability, eco-friendly properties, excellent photocatalytic performance, and cost-effectiveness. Unfortunately, metal oxides suffer from two significant drawbacks that limit their use in photocatalytic applications; namely, they have a considerable bandgap energy (>3 eV) and rapid rates of electron–hole recombination, which reduce their photocatalytic performance. These drawbacks result in their exhibiting photo-activity only under UV irradiation, which represents a small percentage of the solar spectrum. Several strategies have been adopted to overcome these liabilities, such as metal doping, non-metal doping, co-doping using narrow-bandgap semiconductors or other metal oxides, dye sensitization, and formation of composites using 2D materials such as graphene and hexagonal boron nitride.17–20 The main challenge in this context is selecting a material with high semiconducting performance, high stability, recyclability, and biocompatibility. ZnS is an essential II–V group semiconductor that has intrigued scholars around the world owing to its numerous morphologies at the nanoscale, superior mechanical and physical properties, non-toxicity, and excellent photocatalytic properties. These properties have made ZnS a platform for a plethora of applications, for instance, light-emitting diodes (LEDs), wastewater treatment, hydrogen production, sensors, and biodevices.21–23 In addition to this, ZnS is an n-type semiconductor, water-insoluble, inexpensive, and has intrinsic transport properties (reduction of recombination and the resulting scattering of the carriers). There are two crystalline structures for ZnS, cubic and hexagonal (wurtzite), which have corresponding bandgap energies of 3.72 and 3.77 eV, respectively. Thus, the activity of ZnS has been limited to UV irradiation. The availability of ZnS has been a prime property of its utilization; ZnS can be prepared by several methods, such as supercritical-condition-based, sol–gel, electrochemical deposition, chemical vapor deposition, and co-precipitation methods.24–26 However, the template-assisted method has been found to be a facile, efficient, and economic strategy for the synthesis of nanomaterials, as it enables customization and tailoring of nanoparticles to preferred sizes, shapes, and dimensions.27–29 Seeding a photocatalyst over a chemical support is a promising way to optimize its photocatalytic activity by improving the dispersion of the nanoparticles over the support. This leads to the stabilization of the active sites and limits electron–hole recombination.30,31 The geometry of the photocatalyst depends principally on the type of support and the mode of preparation. Thus, the photocatalytic activity of ZnS nanoparticles can be enhanced and optimized in the UV region by the incorporation of ZnS nanoparticles on a high-surface-area support such as silica (SiO2). Therefore, microporous silica (SiO2) is considered to be an eco-friendly and economic support for the dispersion of ZnS photocatalysts, as it supplies the 3D spaces required to incorporate the nanoparticles and increase the specific surface area.3,19,32–34 Herein, ZnS was prepared using a wet precipitation method in the presence of CTAB, which was used as a pore-directing agent, together with in situ impregnation on silica nanoparticles.35–38 The photocatalytic activity of the fabricated ZnS/SiO2 nanocomposite was investigated through the photodegradation of the dyes methylene blue and eosin as pollutant models under UV irradiation, and complete degradation of both dyes was observed within 2 h. This can be ascribed to the change in the bandgap energy of ZnS resulting from its incorporation on the silica matrix. Chemical oxygen demand (COD) measurements confirmed the complete degradation of the organic pollutants into eco-friendly species, and the mechanism of pollutant degradation in the current setup has been investigated using a scavenger study. Density functional theory (DFT) calculations were employed to examine the optical features of the proposed photocatalyst (ZnS/SiO2), and their results were in agreement with the experimentally measured data for the prepared nanocomposite. Different proportions of ZnS were loaded onto the silica surface to determine the optimum percentage of ZnS required to enhance the photoactivity. Several characterization techniques were used to characterize and confirm the prepared nanocomposite materials.2. Experimental section
2.1. Materials and methods
3. Results and discussion
3.1. Structural characterization of the materials
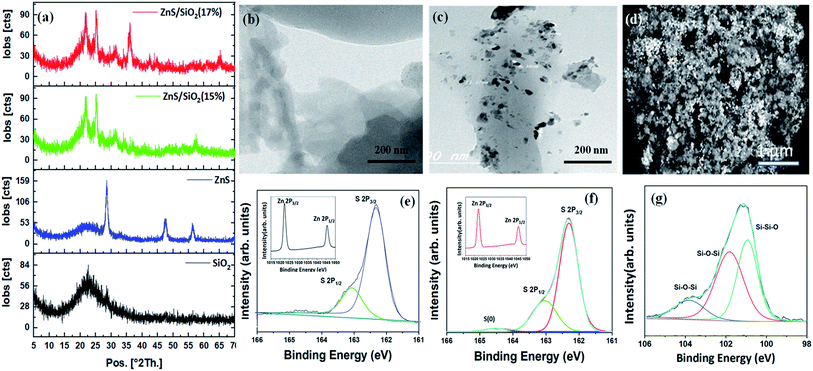
The structures of the prepared materials were explored using XRD analysis. As can clearly be seen in Fig. 2(a), the XRD pattern of the prepared silica shows a broad XRD peak with an equivalent Bragg angle of 2θ = 22°, revealing the amorphous structure of this material. The smoothness and absence of other elements affirm that the repeated washings with DI water were very efficient in eliminating impurities that settled inside the pores of the gel network. It can also be seen that the XRD pattern of ZnS has three well-fitted diffraction peaks appearing at three different Bragg angles of 2θ = 28.51°, 47.62° and 56.4°, which were attributed to the (111), (220), and (311) planes of the cubic zinc sulfide blende structure (Fig. 2(a)). The crystalline planes matched very well with the face-centered cubic structure of the ZnS blende crystal structure described in ICDD PDF 65-1691, with a lattice parameter of 5.1 Å. In addition, as shown in Fig. 2(a), a ZnS/SiO2 photocatalyst XRD pattern was observed for different ratios of ZnS (15 and 17%); a broad silica peak at 2θ = 22° and the three other peaks of ZnS with varying intensities depending on the ZnS content of the sample (1–15%) were clearly observed in all the samples, which was highly consistent with the performance results and other features. A new peak corresponding to orthorhombic zinc silicate can also be seen at 2θ = 36° for samples containing more than 15% ZnS, as shown in Fig. 2(a). It is essential to mention that the formation of Zn2SiO4 requires reaction between at least two moles of ZnS and one mole of silica, which explains why the zinc silicate structures are created when the amount of ZnS is increased. The formation of zinc silicates was the key factor for the lower dye degradation rate associated with samples with more than 15% ZnS. High resolution-TEM (HRTEM) images show the nanoscale structure of ZnS/SiO2. Careful study of Fig. 2(b) shows the presence of highly porous silica, consistent with the XRD data. Fig. 2(c) illustrates that the spherical ZnS particles with a size of less than 30 nm are dispersed with a satisfactory degree of homogeneity throughout the silica network matrix. The degree of homogeneity can be confirmed from the FESEM image, in which we can see clearly the spherical ZnS particles arranged well throughout the silica gel clouds, as shown in Fig. 2(d). The variation in the chemical binding status of the ZnS nanoparticles was examined through XPS analyses. Fig. 2(e and f) present the XPS surface narrow scan Zn and S spectra of the prepared ZnS and ZnS/SiO2 (15%) samples. The narrow-scan XPS shows peaks at binding energies (BE) of 1044 and 1021 eV with a doublet separation of almost 23.1 eV, which are attributed to the Zn 2p1/2 and Zn 2p3/2 peaks, respectively, for Zn2+. Furthermore, the asymmetric S 2p peak in Fig. 2(e) was deconvoluted into two subpeaks consistent with S 2p3/2 and S 2p1/2 at 162.1 and 163.1 eV, respectively. An extra S peak corresponding to an S oxidation state of zero appeared in the ZnS/SiO2 (15%) heterostructure. Additionally, the peak with a binding energy of 161.1 eV arose from S2− in the ZnS structure, and the subpeak at approximately 163.1 eV was attributed to the S–S species surface defects in the ZnS sample. In Fig. 2(g), we can clearly see the XPS spectrum of the silica gel in the composite; the peaks at 102.5 eV and 103.7 eV are associated with Si–O–Si. The peak at 100.6 eV could correspond to Si–Si–O, which can be clearly observed.3.2. Surface area (SBET) characterization
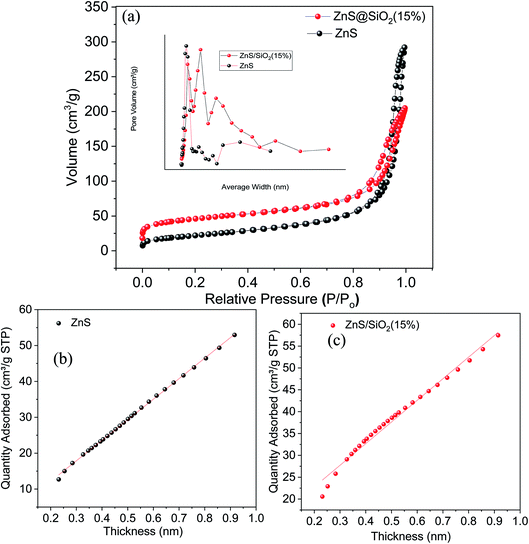
As mentioned above the N2 isotherms and pore size distribution were measured at a low temperature close to 77 K, and the isotherms for the silica, ZnS, and ZnS/SiO2 (15%) samples can be seen in Fig. 3(a). The adsorption isotherm of silica was of type IV according to the IUPAC classification system, exhibiting an H1 hysteresis direction that closes at P/Po = 0.452. This category of hysteresis is considered to involve two different branches that appear vertically very close to one another over an appreciable range of gas uptake, and arises from the presence of cylindrical pores that are open at both ends as shown in Fig. S1 in the ESI.† Furthermore, the adsorption isotherms of the ZnS and ZnS/SiO2 (15%) materials are classified as type II with a very narrow hysteresis loop (Fig. 3(a)). Additionally, the specific surface areas (SBET) of the silica, ZnS, and ZnS/SiO2 (15%) materials are 805.9, 153.2, and 92 m2 g−1, respectively, as measured by using the BET equation for these materials. From there, the pore volume was determined at the saturation pressure and was expressed as a liquid volume of 0.817 and 0.438 cm3 g−1 for ZnS and ZnS/SiO2 (15%), respectively. The incorporation of the ZnS semiconducting materials inside the silica matrix was found to affect the nitrogen sorption features of silica, changing the isotherm from a type IV isotherm associated with mesoporous solids to type II, as mentioned above. This change in texture translates into a reduction in the surface area and the total pore volume. The noteworthy reduction in the texture characteristics of silica indicates the high potential connection between the ZnS and SiO2 materials, as the primary target for ZnS particles is the hydroxide groups that diffuse over the surface of silica and inside the pore network, decreasing the available surface area and narrowing the pore structure. In addition, the variance in the constant C affirms these results, as its value varies from 59.3 to 33.5 for SiO2 and ZnS/SiO2 (15%), respectively. This reveals that the decrease in surface polarity is related to the integration of ZnS nanoparticles into the matrix. Based on this isotherm, the surface area per gram of these photocatalysts follows the order ZnS (92 m2 g−1) < ZnS/SiO2 (154 m2 g−1) < SiO2 (800 m2 g−1). Moreover, the BJH average pore sizes were calculated based on the average adsorption and desorption pore size values, with the average pore diameter following the order ZnS (9.39 nm) < ZnS/SiO2 (14 nm) < SiO2 (20 nm).Furthermore, the porosity study results of the volume absorbed versus the thickness for the ZnS photocatalyst and ZnS/SiO2 (15%) photocatalyst are illustrated in Fig. 3(b and c). The V–t curves for pure silica and ZnS show a downward deviation for pure silica, indicating the predominant existence of micropores. The insertion of ZnS into the silica matrix is accompanied by the disappearance of these micropores due to deposition of ZnS photocatalyst over the silica and a change in sample texture from microporous to mesoporous. The surface factors show a reduction in the surface area and pore volume values and an increase in the pore thickness values, which reflect the deposition of the ZnS material over the walls of the silica micropores with a high potential affinity to fill the microporous texture. In addition, the pore sizes of the silica and silica-based composites were evaluated using the Barret, Joyner, and Halenda (BJH) method, as illustrated in the inset of Fig. 3(a). The existence of a narrow peak for pure silica indicates that all the pores in the solid sample have almost the same size. However, the insertion of ZnS nanoparticles into the silica matrix leads to the development of many peaks, the first of which is centered at 20 Å and corresponds to supermicropores, while the broad peak centered at 28 Å indicates a wide spectrum of porosity.
3.3. Optical characteristics and DFT calculations
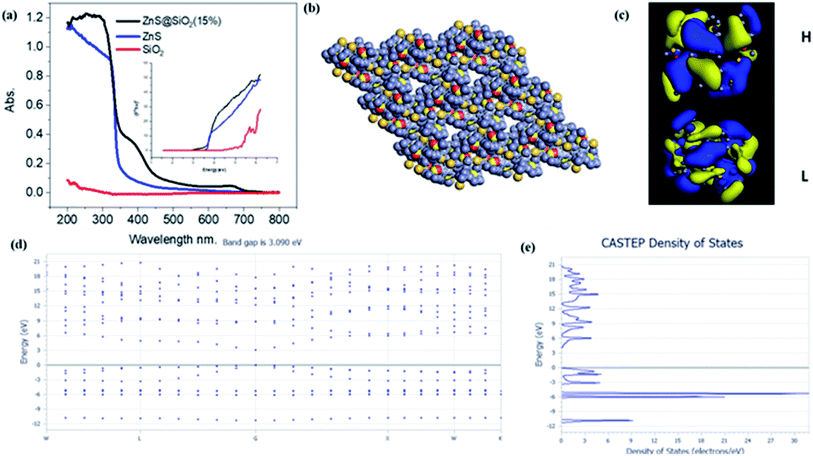
The diffuse reflectance spectra (DRS) of silica, ZnS and the ZnS/SiO2 (15%) nanocomposite photocatalyst are illustrated in Fig. 4(a). The obtained results reflect the presence of a sharp band step in the UV-Vis portion at 200–300 nm for silica and at 350–400 nm for both ZnS and ZnS/SiO2 (15%), corresponding to photoexcitation from the lower valence band to the higher conduction one. By scrutinizing the results, one can perceive that the ZnS/SiO2 (15%) sample exhibits the same shift toward the visible-light regions as the ZnS semiconducting material, which confirms that the semiconductive property of the ZnS remains the same even after distribution over the silica network. According to the bandgap structure measurements from the Tauc diagram and the equation (αhv)2 = A(hv − Eg)n, where α is the absorption factor, A is a constant, and n = 2 for direct transition and n = 1/2 for indirect change, the bandgap values (Eg) are 5.6, 3.6 and 3.2 eV for the pure silica, ZnS, and ZnS/SiO2 (15%), respectively, as shown in the inset of Fig. 4(a). This result removes any idea about the effect of silica on the bandgap energy of ZnS. The rationale behind the approach was to increase the surface area without affecting the bandgap energy. In addition, Fig. 4(b–e) presents the theoretical insights into the band sites. DFT calculations were carried out using the Cambridge sequential total energy package (CASTEP) in Materials Studio. The generalized gradient approximation (GGA) of the Perdew–Burke–Ernzerhof (PBE) functional was used to describe the exchange–correlation interactions. The DFT-D3 method was adopted to consider the van der Waals (vdW) interactions. For geometric optimization, the convergence thresholds for energy and force were set to 10−5 eV per atom and 0.02 eV Å−1, respectively. A cutoff energy of 550 eV was chosen for a plane wave basis. A Monkhorst mesh of 3 × 3 × 1 k-points sampled the Brillouin zone. The ZnS/SiO2 was modeled as a ZnS cluster supported on single-layered SiO2 (S, 4 × 4 × 1 supercell) with monovacancy. Representations of the DFT calculations of the prepared composite can be found in the material unit cell structure in Fig. 4(b), the HOMO and LUMO structures Fig. 4(c), band structure in Fig. 4(d) and density of states in Fig. 4(e) for the ZnS/SiO2 nanocomposite material. The ZnS/SiO2 (15%) system was found to have a bandgap energy of approximately 3.02 eV, which is close to the experimentally calculated value. This confirms that silica has no effect on the band structure of the prepared composite. According to these theoretical DFT calculations, the band gap energy of ZnS after adding silica is 3.09 eV, which is very close to the experimental value. In most cases, the separation and recombination of electron–hole pairs are in continuous competition. In addition, the photodegradation process for the oxidation of organic pollutant materials is generally improved through greater separation between electrons and holes to increase their lifetime. According to the photoluminescence (PL) spectra of ZnS and ZnS/SiO2 (15%), an intense prevailing peak can be observed at 440 nm, which originates from the various defects in the ZnS crystalline structure (Fig. S2, ESI†). After the incorporation of ZnS in the silica gel matrix, remarkable quenching of the ZnS peak is observed, reflecting the strong interaction between the silica and zinc sulfide material. Fig. S3† shows the experimental determination of the HOMO and LUMO values of the as-prepared ZnS/SiO2 using electrochemistry, in which the valence band was found to be located at 2.1 eV and the conduction band at −1.2 eV.3.4. Photocatalytic degradation of organic pollutants (using MB and ES as models)
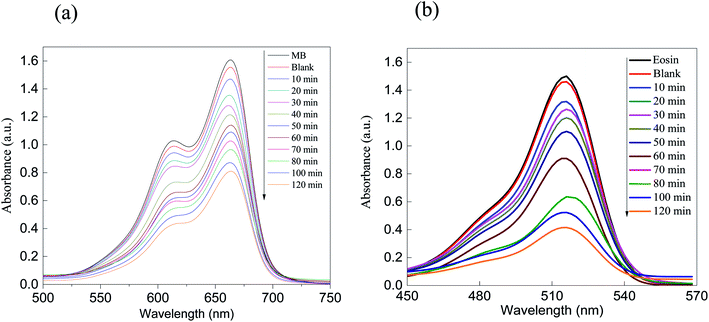 | ||
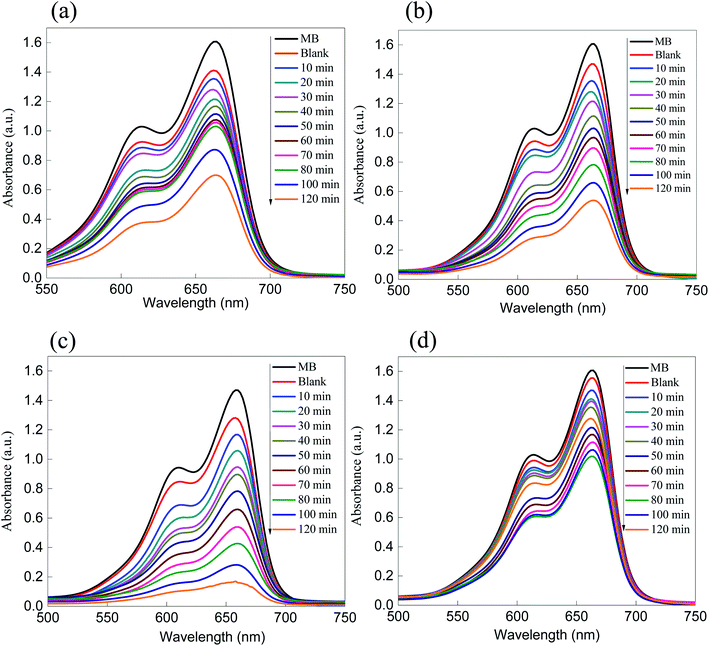
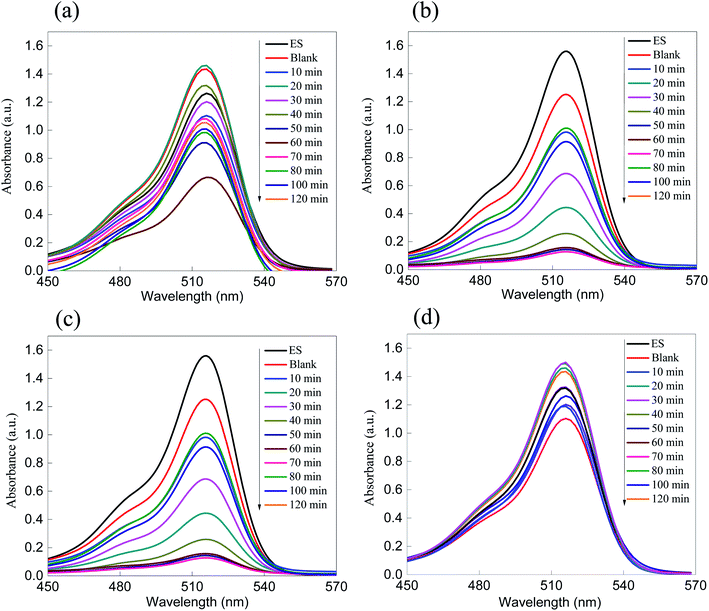
| Fig. 5 Absorption spectra of the removal of the dyes (a) MB and (b) eosin over ZnS. As shown, the removal performance rate is greater than 50% after 120 minutes of irradiation. | ||
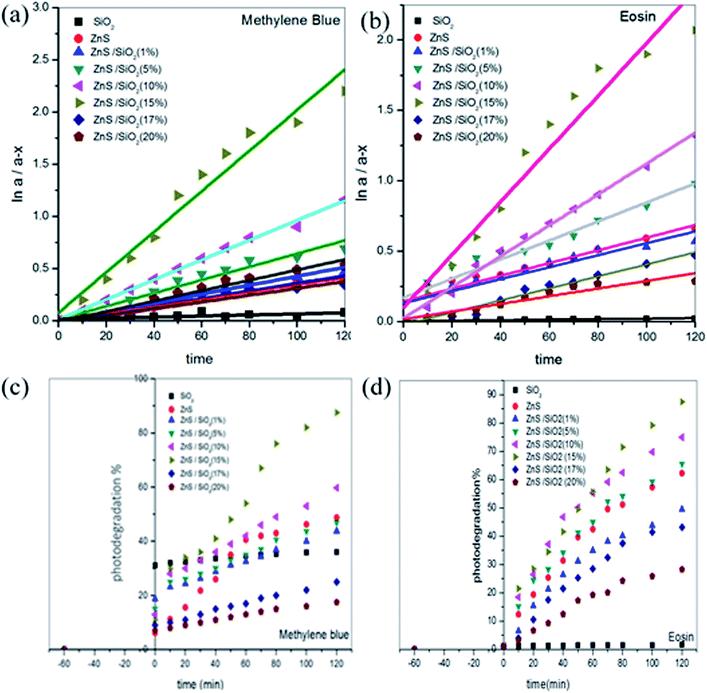
The chemical kinetics of the photodegradation rates obey first-order reaction kinetics, as illustrated in Fig. 8(a and b), where the rate constant is expressed using the following formula:
C = Co![[thin space (1/6-em)]](https://www.rsc.org/images/entities/char_2009.gif) exp(−kt) or ln exp(−kt) or ln![[thin space (1/6-em)]](https://www.rsc.org/images/entities/char_2009.gif) C/C0 = −kt, C/C0 = −kt, |
![[thin space (1/6-em)]](https://www.rsc.org/images/entities/char_2009.gif) Co/C versus contact time provides the rate constant, as shown in Fig. 8(a and b). In addition, the rate constants in the case of MB were calculated to be 5.04 × 10⁻⁴, 0.00335, 0.00362, 0.00598, 0.01282, 0.01941, 0.00291 and 0.00158 min−1 and in the case of ES, 1.79 × 10⁻⁴, 0.00452, 0.00425, 0.00677, 0.011, 0.0188, 0.00428 and 0.00274 min−1, for pure SiO2, ZnS, ZnS/SiO2 (1%), ZnS/SiO2 (5%), ZnS/SiO2 (10%), ZnS/SiO2 (15%), ZnS/SiO2 (17%) and ZnS/SiO2 (20%), respectively, as shown in Fig. 8(c and d).
Co/C versus contact time provides the rate constant, as shown in Fig. 8(a and b). In addition, the rate constants in the case of MB were calculated to be 5.04 × 10⁻⁴, 0.00335, 0.00362, 0.00598, 0.01282, 0.01941, 0.00291 and 0.00158 min−1 and in the case of ES, 1.79 × 10⁻⁴, 0.00452, 0.00425, 0.00677, 0.011, 0.0188, 0.00428 and 0.00274 min−1, for pure SiO2, ZnS, ZnS/SiO2 (1%), ZnS/SiO2 (5%), ZnS/SiO2 (10%), ZnS/SiO2 (15%), ZnS/SiO2 (17%) and ZnS/SiO2 (20%), respectively, as shown in Fig. 8(c and d).
Subsequently, from the photocatalytic performance, it can be observed that more than 90% of the organic dye was completely removed after approximately 2 hours, which is very efficient compared to reports in the literature, as shown in Table 1.
| Photocatalyst | Pollutant model | Degradation% | Contact time | Reference | |
|---|---|---|---|---|---|
| 1 | ZnO/CuO | Textile dye | 100% | 120 min | 42 |
| 2 | Carbon nanotubes and fullerene | Wastewater | — | — | 43 |
| 3 | V2O5/ZnO | Organic pollutants | 90% | 120 min | 44 |
| 4 | ZnO | Organic pollutants | 95% | 180 min | 45 |
| 5 | ZnO/γ-Mn2O3 | Textile effluent | 100% | 8 hours | 46 |
| 6 | ZnS:Cu | Basic dye Auramine-O | 100% | — | 47 |
| 7 | Fe3O4 | Methylene blue and Safranin-O | — | — | 48 |
| 8 | Synergetic effect of adsorption | Wastewater | — | — | 49 |
| 9 | PMMA composites | Phenols | — | — | 50 |
| 12 | ZnO | Organic dyes | 100% | 120 min | 51 |
| 13 | C3N4@nickel–aluminum | Organic dyes | 100% | — | 52 |
| 14 | ZnO microcrystals | Organic dyes | 85% | — | 53 |
| 15 | Nitride/metal–organic frameworks (MOFs) | Organic dyes | 100% | — | 54 |
| 16 | Ag-doped TiO2 | Azo dyes | 95% | 120 min | 55 |
| 17 | Ni-doped ZnS | Organic dyes | — | 56 | |
| 18 | ZnS | — | — | 57 | |
| 19 | CdS–ZnS/TiO2 combined | Organic dyes | 90% | 120 min | 58 |
| 20 | ZnS:Ni2+ | Organic dyes | 95% | 120 min | 59 |
| 21 | ZnS/SiO2 | Organic dyes | 97% | 120 min | The current work |
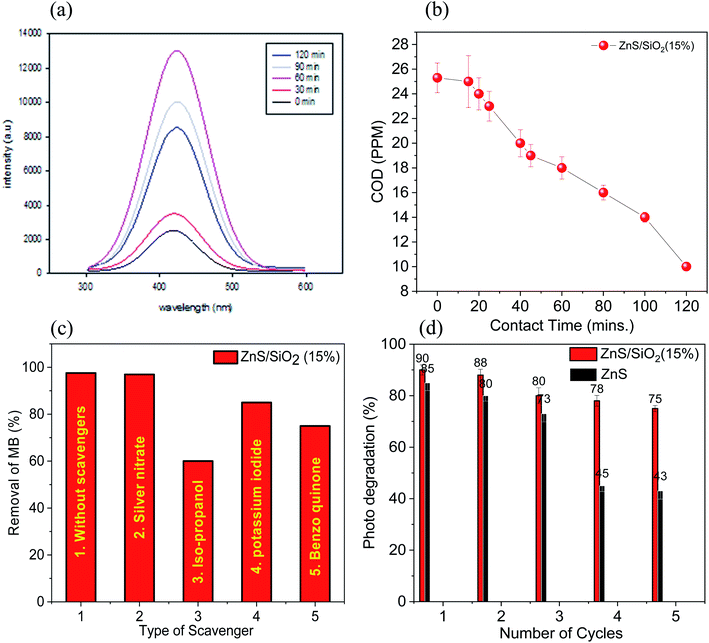
Fig. 9(a) demonstrates the prevailing peak at 423 nm, which increased in intensity with increasing irradiation time over the ZnS/SiO2 (15%) sample, demonstrating the high level of OH radical production. The chemical oxygen demand (COD) test allows us to check the organic content in water as a function of the irradiation time. It is also considered to be an excellent indicator to calculate the organic pollution via the total quantity of oxygen required for its oxidation to CO2 and H2O. The chemical oxygen demand test was performed on the dye solution before, during and after the photocatalytic removal process. The COD of the solution of the organic dye pollutant MB was found to decrease from 25.6 ppm to 14.3 ppm after 90 min and 8.2 ppm after 120 min of irradiation with UV light over ZnS/SiO2 (15%). The COD results are consistent and fit very well with the removal rate results, indicating the complete photo-based degradation of MB into inorganic species, as shown in Fig. 9(b). Total organic carbon (TOC) is a measure of the total amount of carbon in organic compounds in pure water and aqueous systems. The TOC was measured for the MB mixture over ZnS/SiO2 (15%), and we found that the TOC at 0 contact time was 24.6 ppm, and decreased to 16.5 ppm after 30 minutes and to 7.8 ppm after 1 hour. This confirms the organic content removal with increasing contact time.
Useful species responsible for the removal rate, such as h+, OH species, e−, and superoxide, were measured using KI, isopropanol, Ag nitrate, and benzoquinone in the presence of the ZnS@SiO2 (15%) nanocomposite photocatalyst. The reaction conditions were adjusted as follows: 0.1 g of the photocatalyst was added to 100 mL of the dye stock solution (2 × 10⁻⁵ mol L−1), and irradiated for 2 hours in the presence of the radical scavengers with a concentration of 10−3 mol L−1. The results established that the removal rate of the MB organic dye model was reduced from 97.6% to 85, 75, 60, and 95% after the addition of KI, benzoquinone, isopropanol, and silver nitrate scavengers, as shown in Fig. 9(c). The results indicate that hydroxide radicals are more predominantly responsible for the photocatalytic degradation of the organic dye pollutant MB over the ZnS/SiO2 (15%) nanocomposite photocatalyst. We measured the point of zero charge (PZC) to supplement the discussion; from zeta potential measurements, it was noted that the point of zero charge has an essential effect on the photocatalytic performance. The PZC values were 4.2 and 5.6 for ZnS and ZnS/SiO2 (15%), respectively. The mechanism of the photocatalytic reaction showed the effect of the reaction medium on the photo-removal reactivity for both MB and eosin over ZnS/SiO2. However, at low pH values (below 5.9), the surface is positively charged, which leads to repulsion with cationic dyes such as MB and intense interaction with anionic dyes such as ES. Thus, we can see more degradation for ES at lower pH. By increasing the pH to above 5.9, more OH groups accumulated on the surface, which becomes more negatively charged after some time. This will increase the degradation percentage of MB dye relative to that of ES.
4. Conclusions
ZnS loaded on SiO2 is considered to be a promising heterostructure for the removal of MB and ES dyes, which act as organic pollutant models. The photocatalytic procedure is typically conducted by exposing the photocatalyst surface to UV irradiation, which generates reactive radicals. However, electron–hole recombination and a wide bandgap energy are the main challenges that reduce the photo-reactivity during the removal of organic pollutants. Herein, a promising route to augment the photocatalytic reactivity of ZnS via its homogenous distribution over a supporting material to increase the photo-reactivity and reusability is reported. This kind of support plays a decisive role in the photocatalytic degradation of the organic dye. The photocatalytic removal kinetics show that the MB and ES dyes are almost completely removed after approximately 120 minutes of irradiation treatment over the ZnS/SiO2 (15%) photocatalyst. Furthermore, COD measurements also confirm the organic content removal via calculating the oxygen uptake. To better understand the mechanism of action, radical scavenger studies were carried out to determine the active species in the process. It was found that OH radicals and superoxide were the predominant species in the removal process. Additionally, a reusability study of the catalyst affirmed that it can be reused with an efficiency of more than 50% after five cycles. Overall, ZnS/SiO2 (15%) proved to be a promising catalyst for water pollutant photo-treatment.Conflicts of interest
There are no conflicts to declare.Acknowledgements
The authors appreciate Ain Shams University in addition to CMRDI in Egypt for their assistance with following up this study. Furthermore, AES is currently on leave from CMRDI.References
- N. A. Ab Aziz and P. Palaniandy, Photocatalysis (TiO2/Solar) in Water and Wastewater Treatment, in Adv. Oxid. Process. Water Wastewater Treat, I.G.I. Global, 2019, pp. 171–199 Search PubMed.
- M. A. Ahsan, V. Jabbari, M. A. Imam, E. Castro, H. Kim, M. L. Curry, D. J. Valles-Rosales and J. C. Noveron, Nanoscale nickel metal organic framework decorated over graphene oxide and carbon nanotubes for water remediation, Sci. Total Environ., 2020, 698, 134214 CrossRef CAS.
- M. F. A. Messih, A. E. Shalan, M. F. Sanad and M. A. Ahmed, Facile approach to prepare ZnO-SiO2 nanomaterials for photocatalytic degradation of some organic pollutant models, J. Mater. Sci.: Mater. Electron., 2019, 30, 14291–14299 CrossRef.
- M. H. A. Elella, E. S. Goda, H. M. Abdallah, A. E. Shalan, H. Gamal and K. R. Yoon, Innovative bactericidal adsorbents containing modified xanthan gum/montmorillonite nanocomposites for wastewater treatment, Int. J. Biol. Macromol., 2021, 167, 1113–1125 CrossRef.
- B. Reddy, R. Dadigala, R. Bandi, K. Seku, D. Koteswararao and A. E. Shalan, Microwave-assisted preparation of a silver nanoparticles/N-doped carbon dots nanocomposite and its application for catalytic reduction of rhodamine B, methyl red and 4-nitrophenol dyes, RSC Adv., 2021, 11(9), 5139–5148 RSC.
- M. A. Ahsan, E. Deemer, O. Fernandez-Delgado, H. Wang, M. L. Curry, A. A. El-Gendy and J. C. Noveron, Fe nanoparticles encapsulated in MOF-derived carbon for the reduction of 4-nitrophenol and methyl orange in water, Catal. Commun., 2019, 130, 105753 CrossRef CAS.
- J. C. Espíndola, R. O. Cristóvão, D. A. Mayer, R. A. R. Boaventura, M. M. Dias, J. C. B. Lopes and V. J. P. Vilar, Overcoming limitations in photochemical UVC/H2O2 systems using a mili-photoreactor (NETmix): oxytetracycline oxidation, Sci. Total Environ., 2019, 660, 982–992 CrossRef.
- S. M. A. Soliman, M. F. Sanad and A. E. Shalan, Synthesis, characterization and antimicrobial activity applications of grafted copolymer alginate-g-poly (N-vinyl imidazole), RSC Adv., 2021, 11, 11541–11548 RSC.
- M. F. Sanad, E. S. A. Serea, S. M. Bazid, S. Nabih, M. A. Ahsan and A. E. Shalan, High cytotoxic activity of ZnO@ leucovorin nanocomposite based materials against an MCF-7 cell model, Anal. Methods, 2020, 12(16), 2176–2184 RSC.
- A. H. Zaki, A. E. Shalan, A. El-Shafeay, Y. M. Gadelhak, E. Ahmed, M. O. Abdel-Salam, M. Sobhi and S. I. El-dek, Acceleration of ammonium phosphate hydrolysis using TiO2 microspheres as a catalyst for hydrogen production, Nanoscale Adv., 2020, 2, 2080–2086 RSC.
- A. E. Shalan, M. Afifi, M. M. El-Desoky and M. K. Ahmed, Electrospun nanofibrous membranes of cellulose acetate containing hydroxyapatite co-doped with Ag/Fe: morphological features, antibacterial activity and degradation of methylene blue in aqueous solution, New J. Chem., 2021, 45, 9212–9220 RSC.
- J. C. Colmenares and Y.-J. Xu, Heterogeneous photocatalysis, Green Chemistry and Sustainable Technology, 2016 Search PubMed.
- D. D. Dionysiou, G. L. Puma, J. Ye, J. Schneider and D. Bahnemann, Photocatalysis: applications, Royal Society of Chemistry, 2016 Search PubMed.
- R. Li, Latest progress in hydrogen production from solar water splitting via photocatalysis, photoelectrochemical, and photovoltaic-photoelectrochemical solutions, Chin. J. Catal., 2017, 38, 5–12 CrossRef CAS.
- M. F. Sanad, A. E. Shalan, S. M. Bazid and S. M. Abdelbasir, Pollutant degradation of different organic dyes using the photocatalytic activity of ZnO-ZnS nanocomposite materials, J. Environ. Chem. Eng., 2018, 6, 3981–3990 CrossRef CAS.
- M. A. Ahsan, O. Fernandez-Delgado, E. Deemer, H. Wang, A. A. El-Gendy, M. L. Curry and J. C. Noveron, Carbonization of Co-BDC M.O.F. results in magnetic C–Co nanoparticles that catalyze the reduction of methyl orange and 4-nitrophenol in water, J. Mol. Liq., 2019, 111059 CrossRef CAS.
- X. Chen, Z. Wu, D. Liu and Z. Gao, Preparation of ZnO photocatalyst for the efficient and rapid photocatalytic degradation of azo dyes, Nanoscale Res. Lett., 2017, 12, 143 CrossRef.
- A. Samad, M. Furukawa, H. Katsumata, T. Suzuki and S. Kaneco, Photocatalytic oxidation and simultaneous removal of arsenite with CuO/ZnO photocatalyst, J. Photochem. Photobiol., A, 2016, 325, 97–103 CrossRef CAS.
- S. Nabih, A. E. Shalan, E. S. A. Serea, M. A. Goda and M. F. Sanad, Photocatalytic performance of TiO2–SiO2 nanocomposites for the treatment of different organic dyes, J. Mater. Sci.: Mater. Electron., 2019, 30, 9623–9633 CrossRef CAS.
- M. F. Sanad, S. O. Abdellatif and H. A. Ghali, Enhancing the performance of photovoltaic operating under harsh conditions using carbon-nanotube thermoelectric harvesters, J. Mater. Sci.: Mater. Electron., 2019, 1–8 Search PubMed.
- A. Iwase, K. Ii and A. Kudo, Decomposition of an aqueous ammonia solution as a photon energy conversion reaction using a Ru-loaded ZnS photocatalyst, Chem. Commun., 2018, 54, 6117–6119 RSC.
- Z. Ye, L. Kong, F. Chen, Z. Chen, Y. Lin and C. Liu, A comparative study of photocatalytic activity of ZnS photocatalyst for degradation of various dyes, Optik, 2018, 164, 345–354 CrossRef CAS.
- G.-J. Lee, S. Anandan, S. J. Masten and J. J. Wu, Photocatalytic hydrogen evolution from water splitting using Cu doped ZnS microspheres under visible light irradiation, Renewable Energy, 2016, 89, 18–26 CrossRef CAS.
- K. Qiu, D. Qiu, L. Cai, S. Li, W. Wu, Z. Liang and H. Shen, Preparation of ZnS thin films and ZnS/p-Si heterojunction solar cells, Mater. Lett., 2017, 198, 23–26 CrossRef CAS.
- Z. Wang, H. Zhang, H. Cao, L. Wang, Z. Wan, Y. Hao and X. Wang, Facile preparation of ZnS/CdS core/shell nanotubes and their enhanced photocatalytic performance, Int. J. Hydrogen Energy, 2017, 42, 17394–17402 CrossRef CAS.
- W. Du, J. Yang, Y. Zhao and C. Xiong, Preparation of ZnS by magnetron sputtering and its buffer effect on the preferential orientation growth of I.T.O. thin film, Micro Nano Lett., 2018, 13, 506–508 CrossRef CAS.
- S. M. Hosseinpour-Mashkani, M. Maddahfar and A. Sobhani-Nasab, Novel silver-doped NiTiO3: auto-combustion synthesis, characterization and photovoltaic measurements, S. Afr. J. Chem., 2017, 70, 44–48 CAS.
- M. Karyaoui, A. Mhamdi, H. Kaouach, A. Labidi, A. Boukhachem, K. Boubaker, M. Amlouk and R. Chtourou, Some physical investigations on silver-doped ZnO sprayed thin films, Mater. Sci. Semicond. Process., 2015, 30, 255–262 CrossRef CAS.
- A. L. Ortiz, M. M. Zaragoza, J. S. Gutiérrez, M. M. da Silva Paula and V. Collins-Martínez, Silver oxidation state effect on the photocatalytic properties of Ag doped TiO2 for hydrogen production under visible light, Int. J. Hydrogen Energy, 2015, 40, 17308–17315 CrossRef.
- S. Yang, J. Kim, Y. J. Tak, A. Soon and H. Lee, Single-atom catalyst of platinum supported on titanium nitride for selective electrochemical reactions, Angew. Chem., Int. Ed., 2016, 55, 2058–2062 CrossRef CAS.
- Z.-Y. Yu, Y. Duan, M.-R. Gao, C.-C. Lang, Y.-R. Zheng and S.-H. Yu, A one-dimensional porous carbon-supported Ni/Mo2C dual catalyst for efficient water splitting, Chem. Sci., 2017, 8, 968–973 RSC.
- A. K. Clarke, M. J. James, P. O'Brien, R. J. K. Taylor and W. P. Unsworth, Silica-Supported Silver Nitrate as a Highly Active Dearomatizing Spirocyclization Catalyst: Synergistic Alkyne Activation by Silver Nanoparticles and Silica, Angew. Chem., Int. Ed., 2016, 55, 13798–13802 CrossRef CAS.
- K. Mori, S. Masuda, H. Tanaka, K. Yoshizawa, M. Che and H. Yamashita, Phenylamine-functionalized mesoporous silica supported PdAg nanoparticles: a dual heterogeneous catalyst for formic acid/CO2-mediated chemical hydrogen delivery/storage, Chem. Commun., 2017, 53, 4677–4680 RSC.
- M. P. McDaniel, K. S. Clear, E. D. Schwerdtfeger and J. M. Praetorius, Aqueous methods for titanating a chromium/silica catalyst, 2019 Search PubMed.
- G. Q. Liu, Z. G. Jin, X. X. Liu, T. Wang and Z. F. Liu, Anatase TiO2 porous thin films prepared by sol-gel method using CTAB surfactant, J. Sol-Gel Sci. Technol., 2007, 41, 49–55 CrossRef CAS.
- M. F. Sanad, A. E. Shalan, S. M. Bazid, E. S. A. Serea, E. M. Hashem, S. Nabih and M. A. Ahsan, A graphene gold nanocomposite-based 5-FU drug and the enhancement of the MCF-7 cell line treatment, RSC Adv., 2019, 9, 31021–31029 RSC.
- F. Sanad, S. Nabih and M. A. Goda, A lot of promise for ZnO-5FU nanoparticles cytotoxicity against breast cancer cell lines, J. Nanomed. Nanotechnol., 2018, 9, 1–8 CrossRef.
- M. A. Ahsan, V. Jabbari, A. A. El-Gendy, M. L. Curry and J. C. Noveron, Ultrafast catalytic reduction of environmental pollutants in water via MOF-derived magnetic Ni and Cu nanoparticles encapsulated in porous carbon, Appl. Surf. Sci., 2019, 497, 143608 CrossRef CAS.
- C. Batarseh, A. Levi-Zada and R. Abu-Reziq, Preparation of catalytic deep eutectic solvent-based silica microreactors using a non-aqueous sol–gel route, J. Mater. Chem. A, 2019, 7, 2242–2252 RSC.
- A. Abdollahi, H. Roghani-Mamaqani, M. Salami-Kalajahi, A. Mousavi, B. Razavi and S. Shahi, Preparation of organic–inorganic hybrid nanocomposites from chemically modified epoxy and novolac resins and silica-attached carbon nanotubes by sol–gel process: Investigation of thermal degradation and stability, Prog. Org. Coat., 2018, 117, 154–165 CrossRef CAS.
- N. Basereh Taromsary, B. Bonakdarpour, M. A. Amoozegar, N. Fallah and A. Fadaei Tehran, Quantifying the organic content of saline wastewaters: Is chemical oxygen demand always an achievable parameter?, Talanta, 2019, 197, 509–516 CrossRef CAS PubMed.
- R. Saravanan, V. K. Gupta, E. Mosquera and F. Gracia, Preparation and characterization of V2O5/ZnO nanocomposite system for photocatalytic application, J. Mol. Liq., 2014, 198, 409–412 CrossRef CAS.
- R. Saravanan, V. K. Gupta, V. Narayanan and A. Stephen, Comparative study on photocatalytic activity of ZnO prepared by different methods, J. Mol. Liq., 2013, 181, 133–141 CrossRef CAS.
- R. Saravanan, V. K. Gupta, V. Narayanan and A. Stephen, Visible light degradation of textile effluent using novel catalyst ZnO/γ-Mn2O3, J. Taiwan Inst. Chem. Eng., 2014, 45, 1910–1917 CrossRef CAS.
- A. Asfaram, M. Ghaedi, S. Agarwal, I. Tyagi and V. Kumar Gupta, Removal of basic dye Auramine-O by ZnS:Cu nanoparticles loaded on activated carbon: optimization of parameters using response surface methodology with central composite design, RSC Adv., 2015, 5, 18438–18450 RSC.
- M. Ghaedi, S. Hajjati, Z. Mahmudi, I. Tyagi, S. Agarwal, A. Maity and V. K. Gupta, Modeling of competitive ultrasonic assisted removal of the dyes – Methylene blue and Safranin-O using Fe3O4 nanoparticles, Chem. Eng. J., 2015, 268, 28–37 CrossRef CAS.
- S. Natarajan, H. C. Bajaj and R. J. Tayade, Recent advances based on the synergetic effect of adsorption for removal of dyes from waste water using photocatalytic process, J. Environ. Sci., 2018, 65, 201–222 CrossRef.
- M. Cantarella, R. Sanz, M. A. Buccheri, F. Ruffino, G. Rappazzo, S. Scalese, G. Impellizzeri, L. Romano and V. Privitera, Immobilization of nanomaterials in PMMA composites for photocatalytic removal of dyes, phenols and bacteria from water, J. Photochem. Photobiol., A, 2016, 321, 1–11 CrossRef CAS.
- Z. Zainal, L. K. Hui, M. Z. Hussein, Y. H. Taufiq-Yap, A. H. Abdullah and I. Ramli, Removal of dyes using immobilized titanium dioxide illuminated by fluorescent lamps, J. Hazard. Mater., 2005, 125, 113–120 CrossRef CAS.
- R. Jain, M. Mathur, S. Sikarwar and A. Mittal, Removal of the hazardous dye rhodamine B through photocatalytic and adsorption treatments, J. Environ. Manage., 2007, 85, 956–964 CrossRef CAS.
- D. Maučec, A. Šuligoj, A. Ristić, G. Dražić, A. Pintar and N. N. Tušar, Titania versus zinc oxide nanoparticles on mesoporous silica supports as photocatalysts for removal of dyes from wastewater at neutral pH, Catal. Today, 2018, 310, 32–41 CrossRef.
- G. Salehi, R. Abazari and A. R. Mahjoub, Visible-light-induced graphitic–C3N4@nickel–aluminum layered double hydroxide nanocomposites with enhanced photocatalytic activity for removal of dyes in water, Inorg. Chem., 2018, 57, 8681–8691 CrossRef CAS.
- J.-H. Sun, S.-Y. Dong, Y.-K. Wang and S.-P. Sun, Preparation and photocatalytic property of a novel dumbbell-shaped ZnO microcrystal photocatalyst, J. Hazard. Mater., 2009, 172, 1520–1526 CrossRef CAS PubMed.
- H. Wang, X. Yuan, Y. Wu, G. Zeng, X. Chen, L. Leng and H. Li, Synthesis and applications of novel graphitic carbon nitride/metal–organic frameworks mesoporous photocatalyst for dyes removal, Appl. Catal., B, 2015, 174, 445–454 CrossRef.
- V. Mirkhani, S. Tangestaninejad, M. Moghadam, M. Habibi and A. Rostami-Vartooni, Photocatalytic degradation of azo dyes catalyzed by Ag doped TiO2 photocatalyst, J. Iran. Chem. Soc., 2009, 6, 578–587 CrossRef CAS.
- A. Kudo and M. Sekizawa, Photocatalytic H2 evolution under visible light irradiation on Ni-doped ZnS photocatalyst, Chem. Commun., 2000, 1371–1372 RSC.
- J. S. Hu, L. L. Ren, Y. G. Guo, H. P. Liang, A. M. Cao, L. J. Wan and C. L. Bai, Mass production and high photocatalytic activity of ZnS nanoporous nanoparticles, Angew. Chem., Int. Ed., 2005, 44, 1269–1273 CrossRef CAS.
- M. Antoniadou, V. M. Daskalaki, N. Balis, D. I. Kondarides, C. Kordulis and P. Lianos, Photocatalysis and photoelectrocatalysis using (CdS-ZnS)/TiO2 combined photocatalysts, Appl. Catal., B, 2011, 107, 188–196 CrossRef CAS.
- J. H. Bang, R. J. Helmich and K. S. Suslick, Nanostructured ZnS:Ni2+ photocatalysts prepared by ultrasonic spray pyrolysis, Adv. Mater., 2008, 20, 2599–2603 CrossRef CAS.
Footnotes |
| † Electronic supplementary information (ESI) available. See DOI: 10.1039/d1ra02284a |
| ‡ These authors contributed equally to the work. |
| This journal is © The Royal Society of Chemistry 2021 |

