DOI:
10.1039/D1RA02250D
(Paper)
RSC Adv., 2021,
11, 25141-25157
Canola protein thermal denaturation improved emulsion-templated oleogelation and its cake-baking application†
Received
21st March 2021
, Accepted 30th June 2021
First published on 19th July 2021
Abstract
The stability and viscoelasticity of an oil-in-water emulsion formed with canola proteins could be significantly improved by heat-induced protein thermal denaturation followed by aggregation at the oil droplet surface. This phenomenon was used to develop emulsion-templated oleogels with improved rheology and used in cake baking. Canola oil (50 wt%)-in-water emulsions stabilized by 1 and 4 wt% canola protein isolates (CPI), prepared by high-pressure homogenization, were dried at 60 °C in a vacuum oven followed by shearing to create the oleogels. Before drying, the emulsions were heated (90 °C for 30 min) to induce protein denaturation. The oleogel from 4 wt% CPI heated emulsions (HE) exhibited the lowest oil loss, highest gel strength, firmness and stickiness compared to all other oleogels. Cake batter prepared with shortening showed the lowest specific gravity, highest viscosity and storage modulus compared to CPI oleogels. Confocal micrographs of shortening cake batters showed smaller air bubbles entrapped in the continuous fat phase. In comparison, the oleogel cake batters showed dispersion of larger air bubbles, oil droplets, and protein aggregates. The oleogel cake showed a darker colour compared to the shortening cake due to the dark colour of CPI. Interestingly, oleogel cakes showed lower hardness, higher cohesiveness and springiness than the shortening cake, which was attributed to the higher cake volume of the former due to the formation of larger air channels stabilized by canola proteins. In conclusion, CPI stabilized emulsion-templated oleogels could be used as a potential shortening replacer in cake and other baking applications.
1. Introduction
Oleogelation is an approach where liquid oil is fabricated into a gel-like structure without traditional saturated or trans-fat. It is seen as an alternative to structure formation in unsaturated fatty acid-rich oils to meet the zero-trans and low-saturated fat challenge.1,2 In oleogels, the traditional fat crystal network of saturated fat-rich oils is replaced by molecular or polymeric gelators. There are two approaches to oleogel development: direct and indirect oleogelation.3–5 Direct oleogelation involves directly mixing the liquid oil with oleogelators such as waxes or phytosterols at their melting temperature. Upon cooling, the oleogelators crystallize or form structures that entrap the liquid oil within the matrix, forming a self-supporting gel. Indirect approaches such as foam and emulsion-templated oleogelation are used for biopolymeric oleogelators, such as proteins and polysaccharides. The biopolymeric oleogelators are first used to stabilize foam or emulsion so that their hydrophobic moieties are exposed. Subsequently, the aqueous phase of the system is removed through drying, thereby forming the oleogel. In the foam-templated approach, the liquid oil is added to the dried foam to develop oleogels. In the emulsion-templated approach, the dried emulsions are sheared to form homogeneous oleogels.6 However, the disintegration of the oil droplets structure during drying and shearing remains a challenge for the emulsion-templated oleogelation. Recent studies of emulsion-templated oleogelation utilized protein–polysaccharides complexes as oleogelators to improve their stability. For example, sodium caseinate (SC) and alginate (ALG) complex,7 gelatin–tannic acid-flaxseed gum complexe,8 soy protein and κ-carrageenan complex.9 Wijaya et al.7 reported the formation of stable oleogels with high gel strength and high oil binding capacity using an SC![[thin space (1/6-em)]](https://www.rsc.org/images/entities/char_2009.gif) :ALG ratio of 12:1 at pH 7, which was ascribed to the thickening effect of the SC:ALG mixtures at the interface entrapping the oil within the network. Tavernier et al.9 observed no oil leakage in their soy protein–κ carrageenan stabilized emulsion-templated oleogel after several months of storage. However, they reported a higher gel strength of the oleogel stabilized solely with soy protein than the soy protein–κ carrageenan complex, attributed to a different protein conformation at the interface when it was complexed with κ carrageenan. Other than the complexes, polysaccharides, such as hydroxypropyl methylcellulose (HPMC),10 regenerated cellulose (RC) and carboxymethyl cellulose (CMC)11 were also used as oleogelators in the emulsion-templated approach. Meng et al.10 used guar gum, gum Arabic and xanthan gum as thickening agents to form emulsion-templated oleogels with higher gel strength and lower oil loss using HPMC as an emulsifier. Shear thinning behaviour was also commonly observed among the various oleogels.10–12 Patel13 investigated thixotropy recovery of oleogels which gave an insight on the repeated applicability of oleogels as structured oil in food. The emulsion-templated oleogels structured with HPMC, cellulose and gelatin had shown significant thixotropic recovery with the highest recovery of 90% observed for HPMC and methylcellulose-based oleogels.8,11,14 Emulsion-templated oleogel structured with gelatin and xanthan gum exhibited partial thixotropic recovery even at high temperature (80 °C).15 One common factor in most emulsion-templated oleogel development was the importance of fabricating strong interfacial layers in emulsions so that the oil droplets' structure is stable against coalescence during drying and shearing. In this respect, the plant proteins' ability to undergo thermal denaturation followed by aggregation at the oil droplet surface, thereby improving the stability of the interface, has not been investigated. The present work is focused on the thermal denaturation of canola proteins at the oil droplet surface in improving the stability of the emulsion-templated oleogels.
:ALG ratio of 12:1 at pH 7, which was ascribed to the thickening effect of the SC:ALG mixtures at the interface entrapping the oil within the network. Tavernier et al.9 observed no oil leakage in their soy protein–κ carrageenan stabilized emulsion-templated oleogel after several months of storage. However, they reported a higher gel strength of the oleogel stabilized solely with soy protein than the soy protein–κ carrageenan complex, attributed to a different protein conformation at the interface when it was complexed with κ carrageenan. Other than the complexes, polysaccharides, such as hydroxypropyl methylcellulose (HPMC),10 regenerated cellulose (RC) and carboxymethyl cellulose (CMC)11 were also used as oleogelators in the emulsion-templated approach. Meng et al.10 used guar gum, gum Arabic and xanthan gum as thickening agents to form emulsion-templated oleogels with higher gel strength and lower oil loss using HPMC as an emulsifier. Shear thinning behaviour was also commonly observed among the various oleogels.10–12 Patel13 investigated thixotropy recovery of oleogels which gave an insight on the repeated applicability of oleogels as structured oil in food. The emulsion-templated oleogels structured with HPMC, cellulose and gelatin had shown significant thixotropic recovery with the highest recovery of 90% observed for HPMC and methylcellulose-based oleogels.8,11,14 Emulsion-templated oleogel structured with gelatin and xanthan gum exhibited partial thixotropic recovery even at high temperature (80 °C).15 One common factor in most emulsion-templated oleogel development was the importance of fabricating strong interfacial layers in emulsions so that the oil droplets' structure is stable against coalescence during drying and shearing. In this respect, the plant proteins' ability to undergo thermal denaturation followed by aggregation at the oil droplet surface, thereby improving the stability of the interface, has not been investigated. The present work is focused on the thermal denaturation of canola proteins at the oil droplet surface in improving the stability of the emulsion-templated oleogels.
Cakes are one of the popular bakery products in the market. The main ingredients required for cake baking are flour, sugar, fat, emulsifiers, leavening agent and water.16 After mixing, cake batter can be considered as a complex mixture of air and oil-in-water emulsion with dissolved and dispersed dry ingredients in the continuous aqueous phase. Air incorporation was seen as one of the most critical aspects in making a high-volume cake with desirable texture. Among the ingredients, fat assists in the air bubble's entrapment during mixing and leaven the product during baking.17 Shortening, which is formulated with blends of highly saturated fats, and monoglycerides are commonly used in the commercial production of cake. Apart from air entrapment, shortening also tenderizes the crumb, retains moisture in the product, and enhances the mouthfeel.16 Despite the wide applications of shortening in bakery products, the health concern of using shortening had been rising due to the reported link of highly saturated fat to cardiovascular diseases.18 Therefore, researchers have been developing shortening replacers in baking with inulin, vegetable oils and oleogels.19–21 The oleogels utilized in cake baking were mainly wax-based20,22,23 and phytosterols-based oleogels24 prepared using direct oleogelation. Application of emulsion-templated oleogel as shortening replacer in a cake was reported by Patel et al.25 and Luo et al.26 using methylcellulose and tea polyphenol–palmitate particles plus citrus pectin as emulsion stabilizers and oleogelators, respectively. The sensory hedonic scores for overall cake quality reported by Luo et al.26 were 21.5–27.6 for the oleogel cakes and 32.0 for the butter cake. It was proposed that the parameters that scored the lower score in the oleogel cakes were texture, crust, and crumb colour, while the flavour and odour scores were comparable to the butter cake. The higher hardness of the oleogel cakes was attributed to a lower air bubble incorporation in the batters and the cross-linked network of the citrus pectin in the batter. Patel et al.27 compared the texture of cakes made with butter, margarine, liquid oil and oleogels, over 3 days. Oleogel cakes showed a comparable result to the shortening cake and significant improvement compared to the liquid oil cake in the increase of hardness and chewiness over time, attributed to the physical barrier formed by the oleogel that reduced the cross-linking of the gluten network over time.28
The objectives of the present work was to utilize heat-denatured canola protein isolate (CPI) as an oleogelator through the emulsion-templated approach and then investigate the oleogel-based cake batter, structure and texture in comparison to traditional shortening. Canola proteins are known for their heat-induced gelling properties and were widely explored in the development of hydrogels.29–33 The gelling mechanism of canola proteins relies on the protein denaturation without splitting of disulphide bonds at its denaturation temperature, forming a particulate fractal structure supporting by the hydrophobic interactions, hydrogen bonds and disulphide bonds.30 However, canola proteins have never been used to create gels in hydrophobic oil phases. In our previous study, CPI was used to form a thick interfacial layer at the oil–water interface, which stabilized concentrated oil-in-water emulsions against coalescence during regular storage and heat treatment.34 The heat treatment of CPI-stabilized emulsions induced strong gelation due to protein aggregation at the oil droplet surface and the continuous phase. Therefore, we hypothesized that heat-denatured CPI's ability to form a dense and stable interfacial network stabilizing the oil droplets could be successfully utilized in the development of CPI-stabilized emulsion-templated oleogels. The replacement of highly saturated shortening by the CPI-based oleogel is expected to significantly improve the health beneficial aspect of baking fat.
2. Materials and method
2.1 Materials
Canola protein isolate (CPI: 94.5% d.b. protein, 1.6% moisture, 0.7% ash, 1.0% lipid, and 2.2% carbohydrate) was isolated from cold-pressed canola meal (donated by Pleasant Valley Oil Mills, Alberta, Canada) according to the method described by Tang and Ghosh.34 The ingredients used in cake baking, such as canola oil (Great Value brand), vegetable oil shortening (Crisco brand, composed of soybean oil, hydrogenated palm oil, modified palm oil, mono and diglycerides, TBHQ and citric acid), granulated sugar (Redpath, ON, Canada), baking powder (Magic baking powder, Kraft General Foods Canada Inc.), table salt (Windsor, QC, Canada), all-purpose flour (Robinhood Original All-Purpose Flour, ON, Canada) were purchased from a local grocery store (Walmart, Saskatoon, Canada). Milli-Q™ water (Millipore Corporation, MA, USA) was used to prepare all the solutions. All other chemicals were purchased from Sigma Aldrich (Oakville, ON, Canada).
2.2 Oleogels preparation with the emulsion-templated approach
Oleogel was prepared with an emulsion-templated approach. Oil-in-water (O/W) emulsions containing 50 wt% canola oil were prepared with 1 and 4 wt% CPI via six passes of high-pressure homogenization at 20000 psi (Emulsiflex C3, Avestin Inc, Ottawa, ON, Canada). In our previous study, 1, 2, 3 and 4 wt% CPI was used to stabilize 50 wt% oil-in-water emulsions. The droplet size were measured using a static laser diffraction particle size analyzer (Mastersizer 2000, Malvern Instrument, Montreal, QC, Canada).34 They were stable against coalescence at all concentrations with 4 wt% CPI emulsions showed the smallest droplet size and the highest gel strength.30 In the present study, only 1 and 4 wt% CPI-stabilized oil-in-water emulsions were used as a template for oleogelation. The emulsions were heated at 90 °C for 30 min to ensure complete protein denaturation and cooled down to room temperature before drying. To confirm protein denaturation, thermal behaviour of CPI was determined using a Differential Scanning Calorimeter (DSC) (Fig. S1, ESI†). From the DSC thermogram, it can be confirmed that holding the emulsion at 90 °C for 30 min, would completely denature CPI. The rheological properties of the heated emulsions were analyzed according to Tang et al.35 The heated (HE) and unheated emulsions (UE) were then dried at 0.4 atm vacuum (Vacuum Oven 9630, National Appliance Company, Portland, OR, USA) at 60 °C to constant weight. Finally, the oleogels were formed by shearing the dried emulsions using a 250 W kitchen hand blender (Oster®, Canada) until a homogenous texture was obtained.
2.3 Oil binding capacity
The oil binding capacity of the oleogels was evaluated according to Marangoni et al.36 with slight modifications. The oleogel samples (approximately 2.5 g) were transferred to a 50 mL centrifuge tube and centrifuged in DuPont Sorvall Instruments Model RC-5C centrifuge at 10000 rpm for 15 min. After centrifugation, the released free oil at the surface was decanted, and the weight of the centrifuge tube was measured. The percentage oil loss was calculated by eqn (1):| |
 | (1) |
where W1 is the total weight of the centrifuge tube with the sample before centrifugation, W2 is the total weight of the centrifuge tube with the sample after decanting the oil released from centrifugation. W3 is the weight of the oleogel sample.
2.4 Measurement of oil diffusion using PFG-NMR
The oil binding capacity of the oleogels in terms of oil diffusion coefficient was measured using a pulse field gradient (PFG) NMR with stimulated echo pulse sequence.7 The NMR measurements were performed at 23 °C with a Bruker Avance III spectrometer (magnetic field strength 14.1 T, corresponding to a 1H frequency of 600.17 MHz), using a standard Bruker 5 mm BBO probe with Z-gradient. The samples were filled into the standard glass NMR tube (5 mm OD) without any deuterated solvents. The 1H Diffusion-Ordered Spectroscopy (DOSY) data were acquired using the stimulated echo pulse (STE) sequence with bipolar gradient pulses. The detailed experimental parameters were as following: diffusion delay (Δ) of 200 ms, diffusion gradient length (δ) of 6 ms, 15 linear gradient increments with gradient strength (G) from 0.96 to 45.74 g cm−1, 16 scans for each spectrum with relaxation delay 12 s. The combination of Δ and δ was optimized to provide at least 95% signal attenuation at the strongest gradient field. The DOSY data were analyzed using the Bruker Topspin software (version 3.6). The diffusion coefficient, D, was calculated from the equation below| | |
I = I0 exp[−γ2δ2(Gz)(Δ − δ/3) × D]
| (2) |
where I is the echo intensity measured after the diffusion delay, I0 is the echo intensity in the absence of the gradient pulse, the gyromagnetic ratio, γ of 1H is (2.675 × 10⁸ s−1 T−1).
2.5 Rheological properties of oleogels
The rheological properties of the emulsions and oleogels were measured using a rheometer (AR G2, TA instruments, Montreal, QC, Canada) with a 40 mm cross-hatched parallel plate geometry.37 The samples were loaded onto the Peltier plate using a spatula. All the measurements were performed at 25 °C with a geometry gap of 1000 μm. For the determination of viscoelasticity, oscillatory strain sweep and frequency sweep were performed. The oscillatory strain sweep was applied at the constant frequency of 1 Hz and an increasing strain from 0.01% to 1000%. The frequency sweep was performed at a constant 0.1% strain within the linear viscoelasticity region, increasing frequency from 0.01 Hz to 100 Hz. The reversibility in the viscoelastic behaviour of the oleogel was also determined by repeating the strain sweep measurements using ascending, descending and second ascending pathways. The viscosity was measured by rotational shear using a cross-hatched parallel plate geometry as a function of increasing shear rate from 0.01 s−1 to 200 s−1. To evaluate the structure recovery (thixotropy) at a different shear rate, the samples were subjected to a 3-interval thixotropy test where the samples were sheared at 0.1 s−1 for 600 s, followed by 10 s−1 for 600 s and again at 0.1 s−1 for 600 s. The viscosity, storage modulus (G′) and loss modulus (G′′) of the samples were recorded with the TRIOS software version 4.5.0.42498 (TA Instruments, Montreal, QC, Canada).
2.6 Texture analysis of oleogels
The hardness and cohesiveness of the oleogels were measured using a texture analyzer (TA-Plus texture analyzer, Texture Technologies Corp., South Hamilton, MA, USA) fitted with a conical spreadability test probe (TA-425 TTC spreadability RIG) according to Mohanan et al.37 All the measurements were taken in compression mode with a penetration depth of 65 mm, test speed of 3 mm s−1 and post-test speed of 10 mm s−1. Before the measurement, the samples were loaded and pressed gently using a plastic spatula into the female cone to reduce air incorporation as much as possible. Subsequently, the female cone was fixed on the bottom platform of the texture analyzer. The male cone was to penetrate the sample and returned to the initial position after 65 mm penetration. A graph of force (g) versus time (s) was plotted during the measurement with the Exponent software version 6.1.16.0 (Stable Micro System, Surrey, United Kingdom). The hardness and cohesiveness were obtained from the maximum positive and negative force of the graph.
2.7 Preparation and characterizations of cakes
2.7.1 Cake baking with oleogels. Cake samples were prepared according to AACC38 approved method 10–90 with modifications described by Amoah et al.20 In brief, 100 g of all-purpose flour, 140 g of crystalline sugar, 50 g of fat, 12 g of non-fat dried milk, 9 g of dried egg white powder, 3 g of NaCl, 6.25 g of baking powder, and 175 g of water were used for the cake preparation. The ingredients were mixed using a KitchenAid Ultra Power Mixer (KitchenAid, Whirlpool Canada LP, Mississauga, ON) with a 4.5 qt (4.3 L) stationary bowl and rotating stirrers. For the fat phase, different ingredients were used, namely, shortening, canola oil and oleogels. First, the shortening/canola oil/oleogel was creamed with sugar at speed 2 for 2 min and then mixed with water (42 g) for another 2 min. Subsequently, the cream was mixed with all the dry ingredients and remaining water for 1 min at speed 2, followed by continuous mixing at speed 6 for 6 min. The batter was scraped down to ensure even mixing at every 2 min interval. The cake batter was then transferred to a muffin pan (1.5 × 7.24 × 12.5′′) and baked at 375 °F (190.6 °C) for 15 min. After that, the cakes were cooled down to room temperature and wrapped in plastic film and aluminum foil to store at room temperature. All the characterizations of the cakes were carried out 24 h after baking.
2.7.2 Cake batter specific gravity. The specific gravity of the cake batter was measured from the ratio of the weight of the cake batter in a measuring cup to the weight of water with the same volume as described by Amoah et al.20
2.7.3 Cake batter rheology. The viscosity and viscoelasticity of the cake batters were measured as described in Section 2.5.
2.7.4 Cake batter microstructure. The microstructure of the cake batter was observed using a Nikon C2 microscope (Nikon Inc., Mississauga, ON, Canada) with a combination of 543 nm and 633 nm lasers, a 10 × Plan APO VC (numerical aperture 0.45) objective lens and 2.5 times digital zoom. The cake batter was dyed with a mixture of fluorescent dyes in ethanol, consisting of 1 mg mL−1 of Nile red (excitation by 543 nm laser, emission collected in 573–613 nm range) and 1 mg mL−1 of fast green (0.01 wt%) (excitation by 633 nm laser, emission collected using a 650 nm long-pass filter).39 Observation of the cake batter microstructure were performed 15 min after the dye was added to allow sufficient dye diffusion to the target components.19
2.7.5 Colour analysis of cake batter and cake. The cake batter and cake colour were measured using a Hunterlab Miniscan XE™ (Hunter Associates Laboratory, Inc., Reston, VA, USA) using standard illuminant D and 65° observer angle. The instrument was first standardized with black and white tiles before measurement. The cake batter was placed into a disposable Petri dish (60 mm diameter) while the cake was cut vertically at the middle and placed on top of a clear plastic film above the light source. The parameters determined were L* (L* = 0 [black]; L* = 100 [white]), a* (−a* = greenness; +a* = redness), and b* (−b* = blueness; +b* = yellowness).
2.7.6 Cake specific volume. The volume of the cake was measured by the rapeseed displacement method. The volume difference of the rapeseed with and without the presence of cake was measured using a 500 mL measuring cylinder. The specific volume (mL g−1) of the cake was calculated by taking the ratio of cake volume to its weight.40
2.7.7 Image analysis of the cellular structure of cake crumb. Image analysis of the cake crumb cellular structure was done according to Rodríguez-García et al.19 with slight modifications. In brief, the cakes were cut in half, and the middle section of the crumbs was scanned using a flatbed scanner (Brother DCP-L2540DW Compact Monochrome Laser Multifunction, QC, Canada) with a resolution of 300 dpi. The scanned images were analyzed using ImageJ (National Institutes of Health, USA). The images were first cropped into a 372 × 456 pixels rectangular section, then they were converted to 8 bits palleted file, and finally, the images were binarized. The cell density (number of cells per cropped image) and the cell area percentage were calculated with the software. The data was obtained by analyzing 4 images from different samples for each replicate.
2.7.8 Cake texture analysis. The texture profile of the cakes was measured using a texture analyzer (TA-Plus texture analyzer, Texture Technologies Corp., South Hamilton, MA, USA) 24 h after baking according to Mohanan et al.37 The cakes were cut into 2 cm cubes and subjected to a 2-step compression with a cylindrical probe (2.5 cm diameter) until 50% strain of the original cake height. The test speed was 2 mm s−1, while the pre and post-test speeds were 5 mm s−1. A graph of force (g) versus time (s) was plotted during the measurement. The hardness, springiness, cohesiveness and chewiness were measured and calculated using the Exponent software (version 6.1.16.0, Stable Micro System, Surrey, United Kingdom).
2.8 Statistical analysis
All experiments were conducted in triplicate. The results were reported as mean ± standard deviation. The results were analyzed using an independent t-test and analysis of variance (ANOVA) with a 95% confidence level where p < 0.05 indicates a significant difference. The statistical analysis was done using SPSS software (v25, IBM, Armonk, NY, USA).
3. Results and discussion
3.1 Emulsions characterization
3.1.1 Emulsion droplet size distribution. The droplet size distributions of 1 and 4 wt% CPI-stabilized emulsions were multimodal (Fig. 1A), indicating high polydispersity. The large peaks were at around 15 μm and 7 μm for 1 and 4 wt% CPI, respectively, resulting from the droplet and protein aggregation. To verify the presence of droplet aggregates, 1 wt% SDS was added to the emulsions to disrupt any flocculation. A shift in the peaks towards small droplet size and reduction of peak width upon addition of 1% SDS would indicate flocculated droplets in the original emulsions. With the addition of 1 wt% SDS, the large peak of the 1 wt% CPI-stabilized emulsions had shifted to around 10 μm with a narrower peak while the 4 wt% CPI-stabilized emulsions became monomodal with a narrow peak at 3 μm (Fig. 1B). The volume average aggregate size (d43) of the emulsions showed that upon addition of SDS, the change in d43 of 1 wt% CPI-stabilized emulsions was not significant (from 17.0 ± 4.3 μm to 11.4 ± 1.3 μm). However, a significant reduction in d43 was observed in the 4 wt% CPI-stabilized emulsions, from 19.0 ± 4.6 μm without SDS to 4.2 ± 0.3 μm with SDS, which indicates a smaller droplet size at higher CPI concentration, although the droplets were extensively aggregated.
 |
| | Fig. 1 (A and B) Droplet size distribution of freshly prepared emulsions stabilized with 1 and 4 wt% CPI in (A) original condition and (B) in the presence of 1 wt% SDS. Volume average droplet diameters (d43) are shown on the size distribution graphs. (C–F) Viscoelasticity of 1 and 4 wt% CPI-stabilized emulsions with (triangle symbols) and without (circle symbols) heat treatment. Data for storage modulus (G′, close symbols) and loss modulus (G′′, open symbols) as a function of (C and D) strain % and (E and F) frequency are shown for unheated emulsions (●○) and heated emulsions (▲△). | |
3.1.2 Heat-induced gelation in emulsion. Upon heating at 90 °C for 30 min, all emulsions turned into a strong self-supporting gel. In the strain sweep measurements (Fig. 1C and D), the heated emulsions showed a significant increase in G′ and G′′ compared to the unheated emulsions for both 1 and 4 wt% CPI concentrations. The linear viscoelastic region (LVR) of the heated emulsions also became longer, and the G′ values of the heated 4 wt% CPI emulsions within the LVR reached 1.5 × 10⁴ Pa. The unheated emulsions showed a two-step yielding behaviour where the gel broke down into clusters, and then the inter-droplets bonds were broken, resulting in two peaks in G′′.42 The yielding behaviour of the heated emulsions, however, showed one-step yielding within the strain-rage studied. In this case, it is possible that the second yielding step would have happened at a higher stain beyond the experimental range. Otherwise, the strong inter-droplet bonds within the heated emulsions were holding the droplets firmly until a higher force was applied, breaking the gel directly into individual droplets.43 Similar viscoelastic properties were observed in the frequency sweep studies (Fig. 1E and F), where the heated emulsions exhibited a higher G′ and G′′ compared to the unheated emulsions. Unlike the unheated emulsions, both 1 and 4 wt% CPI heated emulsions showed no crossover of G′ and G′′ until 100 Hz. This behaviour showed a more robust gel network in the heated emulsions than the unheated emulsions, which was attributed to the protein aggregations after heat treatment above their denaturation temperature, forming a network of protein and droplets aggregates.34 To verify, the peak denaturation temperature of the CPI was determined using a differential scanning calorimeter, and a value of 84.2 °C was obtained (Fig. S1†), which was also close to the values reported by Folawiyo et al.33 (86 °C), and Kim et al.44 (87 °C). Therefore, heating to 90 °C would certainly denature the canola proteins.
3.2 Visual observation of oleogels
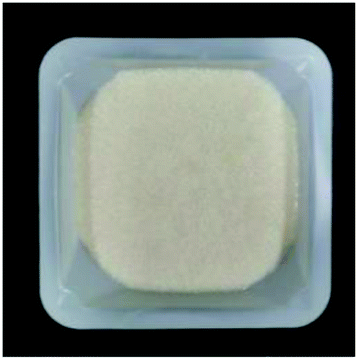
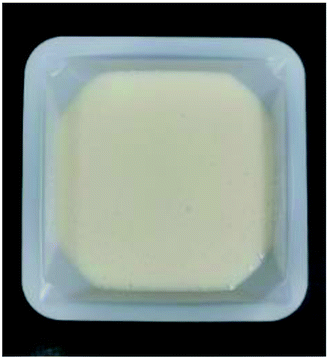
The oleogels were formed by drying the emulsions. The unheated emulsion (UE) oleogels exhibited liquid like texture, most likely attributed to the destruction of the oil droplets due to shearing, leading to the release of liquid oil (Fig. 2, top row). The heated emulsions (HE) oleogels exhibited gel-like structure after shearing, where it can be observed that the 4 wt% CPI HE oleogel was much firmer than the 1 wt% CPI HE oleogel (Fig. 2, top row).
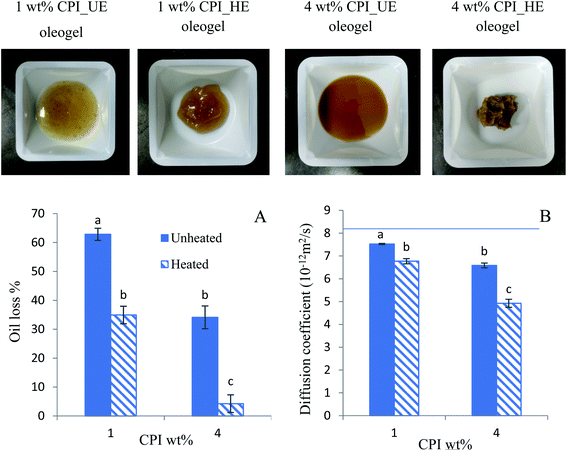 |
| | Fig. 2 Visual appearance of oleogels from 1 and 4 wt% CPI-stabilized unheated (UE) and heated emulsions (HE) (top row). The oil binding capacity of the oleogels was measured in two different ways: (A) oil loss% of oleogels after centrifugation at 10000 rpm for 15 min, and (B) oil diffusion coefficient in the oleogels measured by PFG-NMR. The solid line in (B) indicates the diffusion coefficient of the bulk canola oil (D = 8.48 ± 0.02 × 10⁻¹² m2 s−1). Different letters indicate significant difference (p < 0.05). | |
3.3 Oleogel oil binding capacity
3.3.1 Determination of oleogel oil loss through centrifugation method. The ability of the oleogels to retain oil within their structure was measured by the oil loss under centrifugal force (Fig. 2A). The oil loss % of the oleogels was calculated from the amount of weakly bound oil separated from the oleogels after centrifugation. A lower oil loss indicates a better oil binding capacity.45 The 1 wt% CPI UE oleogel showed the highest while the 4 wt% CPI HE oleogels showed the lowest oil loss. Both the 1 and 4 wt% HE oleogels exhibited significantly (p < 0.05) lower oil loss than the corresponding UE oleogels, indicating heating of emulsions before drying improved the oil binding capacity of the oleogels. During oleogel development, two steps could lead to the release of oil from the emulsified droplets. First, upon drying, the oil droplets were tightly packed into a compact polygonal structure due to water evaporation from the continuous phase.7 Second, the dried emulsions' structure might get disrupted during shearing, which could lead to oil droplet coalescence. Therefore, the lower oil loss from the HE oleogels could be attributed to the formation of stronger interfacial protein layers around the oil droplets as a result of heat-induced protein denaturation and interfacial aggregation as well as gelation of proteins in the continuous phase withholding the oil droplets. To confirm the improved interfacial strength of heat-denatured CPI, we have determined the oil–water interfacial viscoelastic moduli of heated (90 °C, 30 min) and unheated CPI solution as a function of time at 0.1% strain and 0.1 rad s−1 frequency using the methodology described by Gadkari et al.46 As 1 or 4 wt% CPI solution would transformed into a gel after the heat treatment, a dilute 0.25 wt% CPI solution was used for this purpose. The details of the methodology and the results are shown in Fig. S3 (ESI†). For both heated and unheated CPI solution, G′ was higher than the G′′ for the entire time duration, indicating dominating elastic nature of the CPI-interface. The G′ values of the heated CPI solution interface was always higher (on average 1.7 times higher) than the unheated CPI-interface. Moreover, average tan δ values of the heated CPI interface was 0.38 ± 0.01, compared to 0.56 ± 0.04 for the unheated CPI interface, indicating more stronger elastic nature of the former. We propose that such stronger interfacial structure helped to stabilize the droplets from structural disruption during drying and shearing leading to the improved stability of HE oleogels compared to UE oleogels.
3.3.2 Determination of oleogel oil diffusion coefficient by PFG-NMR. Pulse field gradient-NMR technique had been used to study the self-diffusion coefficient in many systems in which the molecules were able to diffuse without restriction.47 This technique exploits the changes in the net magnetic moment measured by the detector due to molecular diffusion when the sample is subjected to a sequence of pulse-field gradient stimulated spin echo.48 Overall, bulk canola oil showed highest diffusion coefficient (D = 8.48 ± 0.02 × 10⁻¹² m2 s−1) while the 4 wt% CPI HE oleogel exhibited the lowest diffusion coefficient (D = 4.93 ± 0.18 × 10⁻¹² m2 s−1) (Fig. 2B). Both the HE oleogels showed a lower diffusion coefficient than their corresponding UE oleogels (p < 0.05). In contrast, the 1 wt% CPI HE oleogel showed no significant difference in diffusion coefficient than the 4 wt% CPI UE oleogel. The more hindered oil diffusion behaviour of the oleogel than the bulk oil was also observed by Wijaya et al.7 in their study of emulsion-templated oleogels stabilized with sodium caseinate and alginate mixture at different ratios, where the D values were ranged from about 6.75 to 7.5 × 10⁻¹² m2 s−1. In the present case, the oil diffusion coefficient of the 4 wt% CPI HE oleogel was lower compared to the oleogels made by Wijaya et al.7 could be attributed to the improved stabilization ability of heat-denatured canola proteins compared to the sodium caseinate and alginate complex. The authors also reported a higher oil diffusion coefficient in the oleogels than the corresponding emulsions due to the disintegration of oil droplets during shearing, which led to the release of free oil.7 In the present case, the diffusion coefficient values also followed the oil loss percentage obtained through the centrifugation method (Fig. 2A and B); hence, both methods could be used as an indirect way to study the oleogel oil binding capacity.
3.4 Rheological properties of oleogels
3.4.1 Viscosity and thixotropic properties of oleogels. All oleogels exhibited a shear thinning behaviour where the viscosity decreased as a function of shear rate (Fig. 3A and B). The HE oleogels showed higher viscosity than the UE oleogel at all shear rates. The higher viscosity of the HE oleogels could be attributed to the protein aggregation around the oil droplets, thereby retaining the droplet structure after shearing. As the shear rate increased, the aggregated oil droplets and proteins got separated, leading to a lower viscosity. The flow behaviour of the oleogels was modeled with a Power law (τ = K![[small gamma, Greek, dot above]](https://www.rsc.org/images/entities/i_char_e0a2.gif) n), where τ is the applied stress and is the shear rate. The values of the consistency coefficient (K) and flow behaviour index (n) was calculated and shown in Fig. S4 (ESI†). Consistency coefficient (K) is a measure of apparent viscosity at 1 s−1 shear rate, which followed the similar trend observed in Fig. 3A. Higher values of K was obtained for the oleogels from heated emulsions (HE oleogel), compared to unheated emulsions (UE oleogel). Increase in CPI concentration from 1 to 4 wt% also led to an increase in the values of K. The flow behaviour index (n) is a measure of pseudoplasticity, where lower values of n for HE oleogels compared to UE oleogels indicate higher degree of pseudoplasticity, which could be due to more structural breakdown in the former.
n), where τ is the applied stress and is the shear rate. The values of the consistency coefficient (K) and flow behaviour index (n) was calculated and shown in Fig. S4 (ESI†). Consistency coefficient (K) is a measure of apparent viscosity at 1 s−1 shear rate, which followed the similar trend observed in Fig. 3A. Higher values of K was obtained for the oleogels from heated emulsions (HE oleogel), compared to unheated emulsions (UE oleogel). Increase in CPI concentration from 1 to 4 wt% also led to an increase in the values of K. The flow behaviour index (n) is a measure of pseudoplasticity, where lower values of n for HE oleogels compared to UE oleogels indicate higher degree of pseudoplasticity, which could be due to more structural breakdown in the former.
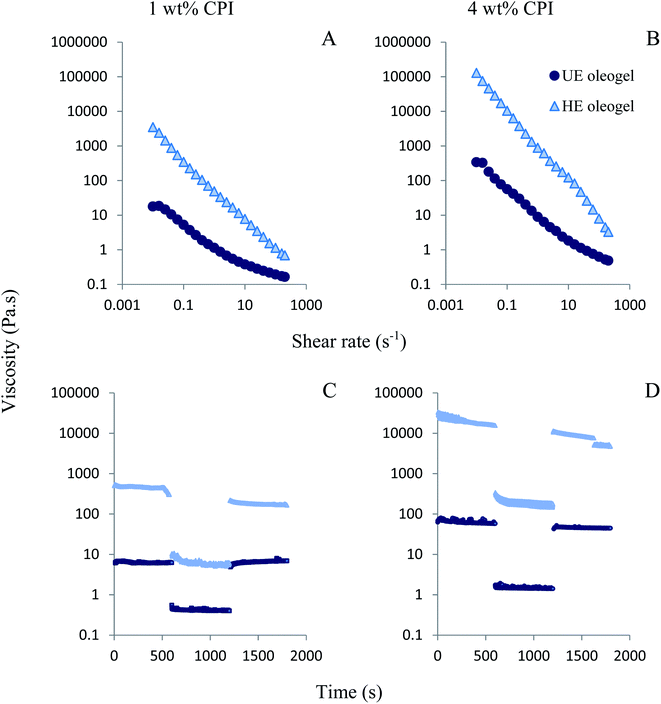 |
| | Fig. 3 (A and B) Viscosity as a function of shear rate and (C and D) thixotropic behaviour as a function of time with three different share rates 0.1 s−1 followed by 10 s−1 and again 0.1 s−1 (each 600 s) for 1 and 4 wt% CPI-stabilized oleogels from unheated emulsions (UE) (darker ●) and heated emulsions (HE) (lighter ▲). | |
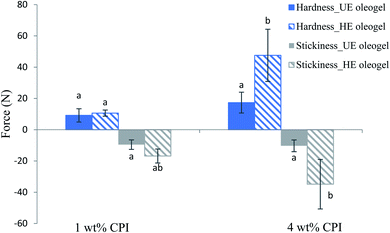
Another critical property that affects the functionality of oleogels in food products is their thixotropic recovery.13 In thixotropic materials, structural strength or viscosity decreased at a higher shear rate, still, the material should recover its structure, at least partially, when the shear rate is lowered. To gain insight into the oleogel structural recovery, a three-interval thixotropy test (3-ITT) was performed according to Tavernier et al.49 In this test, the viscosity was measured as a function of three time-intervals (600 s) under low, high and again low values of constant shear rates (0.1, 10, 0.1 s−1). The 3-ITT results are shown in Fig. 3C and D. The structural recovery ratio was calculated by comparing the apparent viscosity at the end of the first time-interval (0.1 s−1) and at the end of the last time-interval (0.1 s−1). The UE oleogels showed high structural recovery values 93% and 94% for 1 wt% (Fig. 3C) and 4 wt% CPI oleogels (Fig. 3D), respectively. The high structural recovery of the UE oleogels could be resulted from the lack of stable oil droplets in the structure and due to the presence of free liquid oil (higher oil loss, Fig. 2A). Therefore, these values might not be a good indicator of the structural recovery in the UE oleogels as there was not a great extent of packed oil droplet structure to begin with (visual observation in Fig. 2, top row).49 In contrast to the UE oleogels, the HE oleogels had a lower structural recovery with values 68% and 60% for 1 wt% (Fig. 3C) and 4 wt% CPI (Fig. 3D), respectively. Previously, thixotropic recovery ranged from around 17% to above 75% was reported for various emulsion-templated oleogels. For instance, Jiang et al.11 reported above 75% recovery for their regenerated cellulose and carboxymethyl cellulose-stabilized oleogels. Tavernier et al.49 investigated the effect of candelilla wax concentration in the emulsion-templated oleogels stabilized by 2.5 wt% soy protein. Though the overall structural recovery was lower than the other literature values, the authors reported an increase in structural recovery from 11% to 17% as the wax concentration increased from 1 to 5%. Luo et al.26 also showed good recovery of the structure in the thixotropy test of tea polyphenol palmitate particles plus citrus pectin stabilized oleogels; however, no exact values were reported. In the present case, thixotropic recovery of the HE oleogels decreased when the protein concentration increased from 1 to 4 wt%, which could be attributed to the inability of the oleogel to recover the strong protein network structure in 4 wt% CPI oleogel compared to the near-complete recovery of the weaker protein network structure in 1 wt% CPI oleogel.
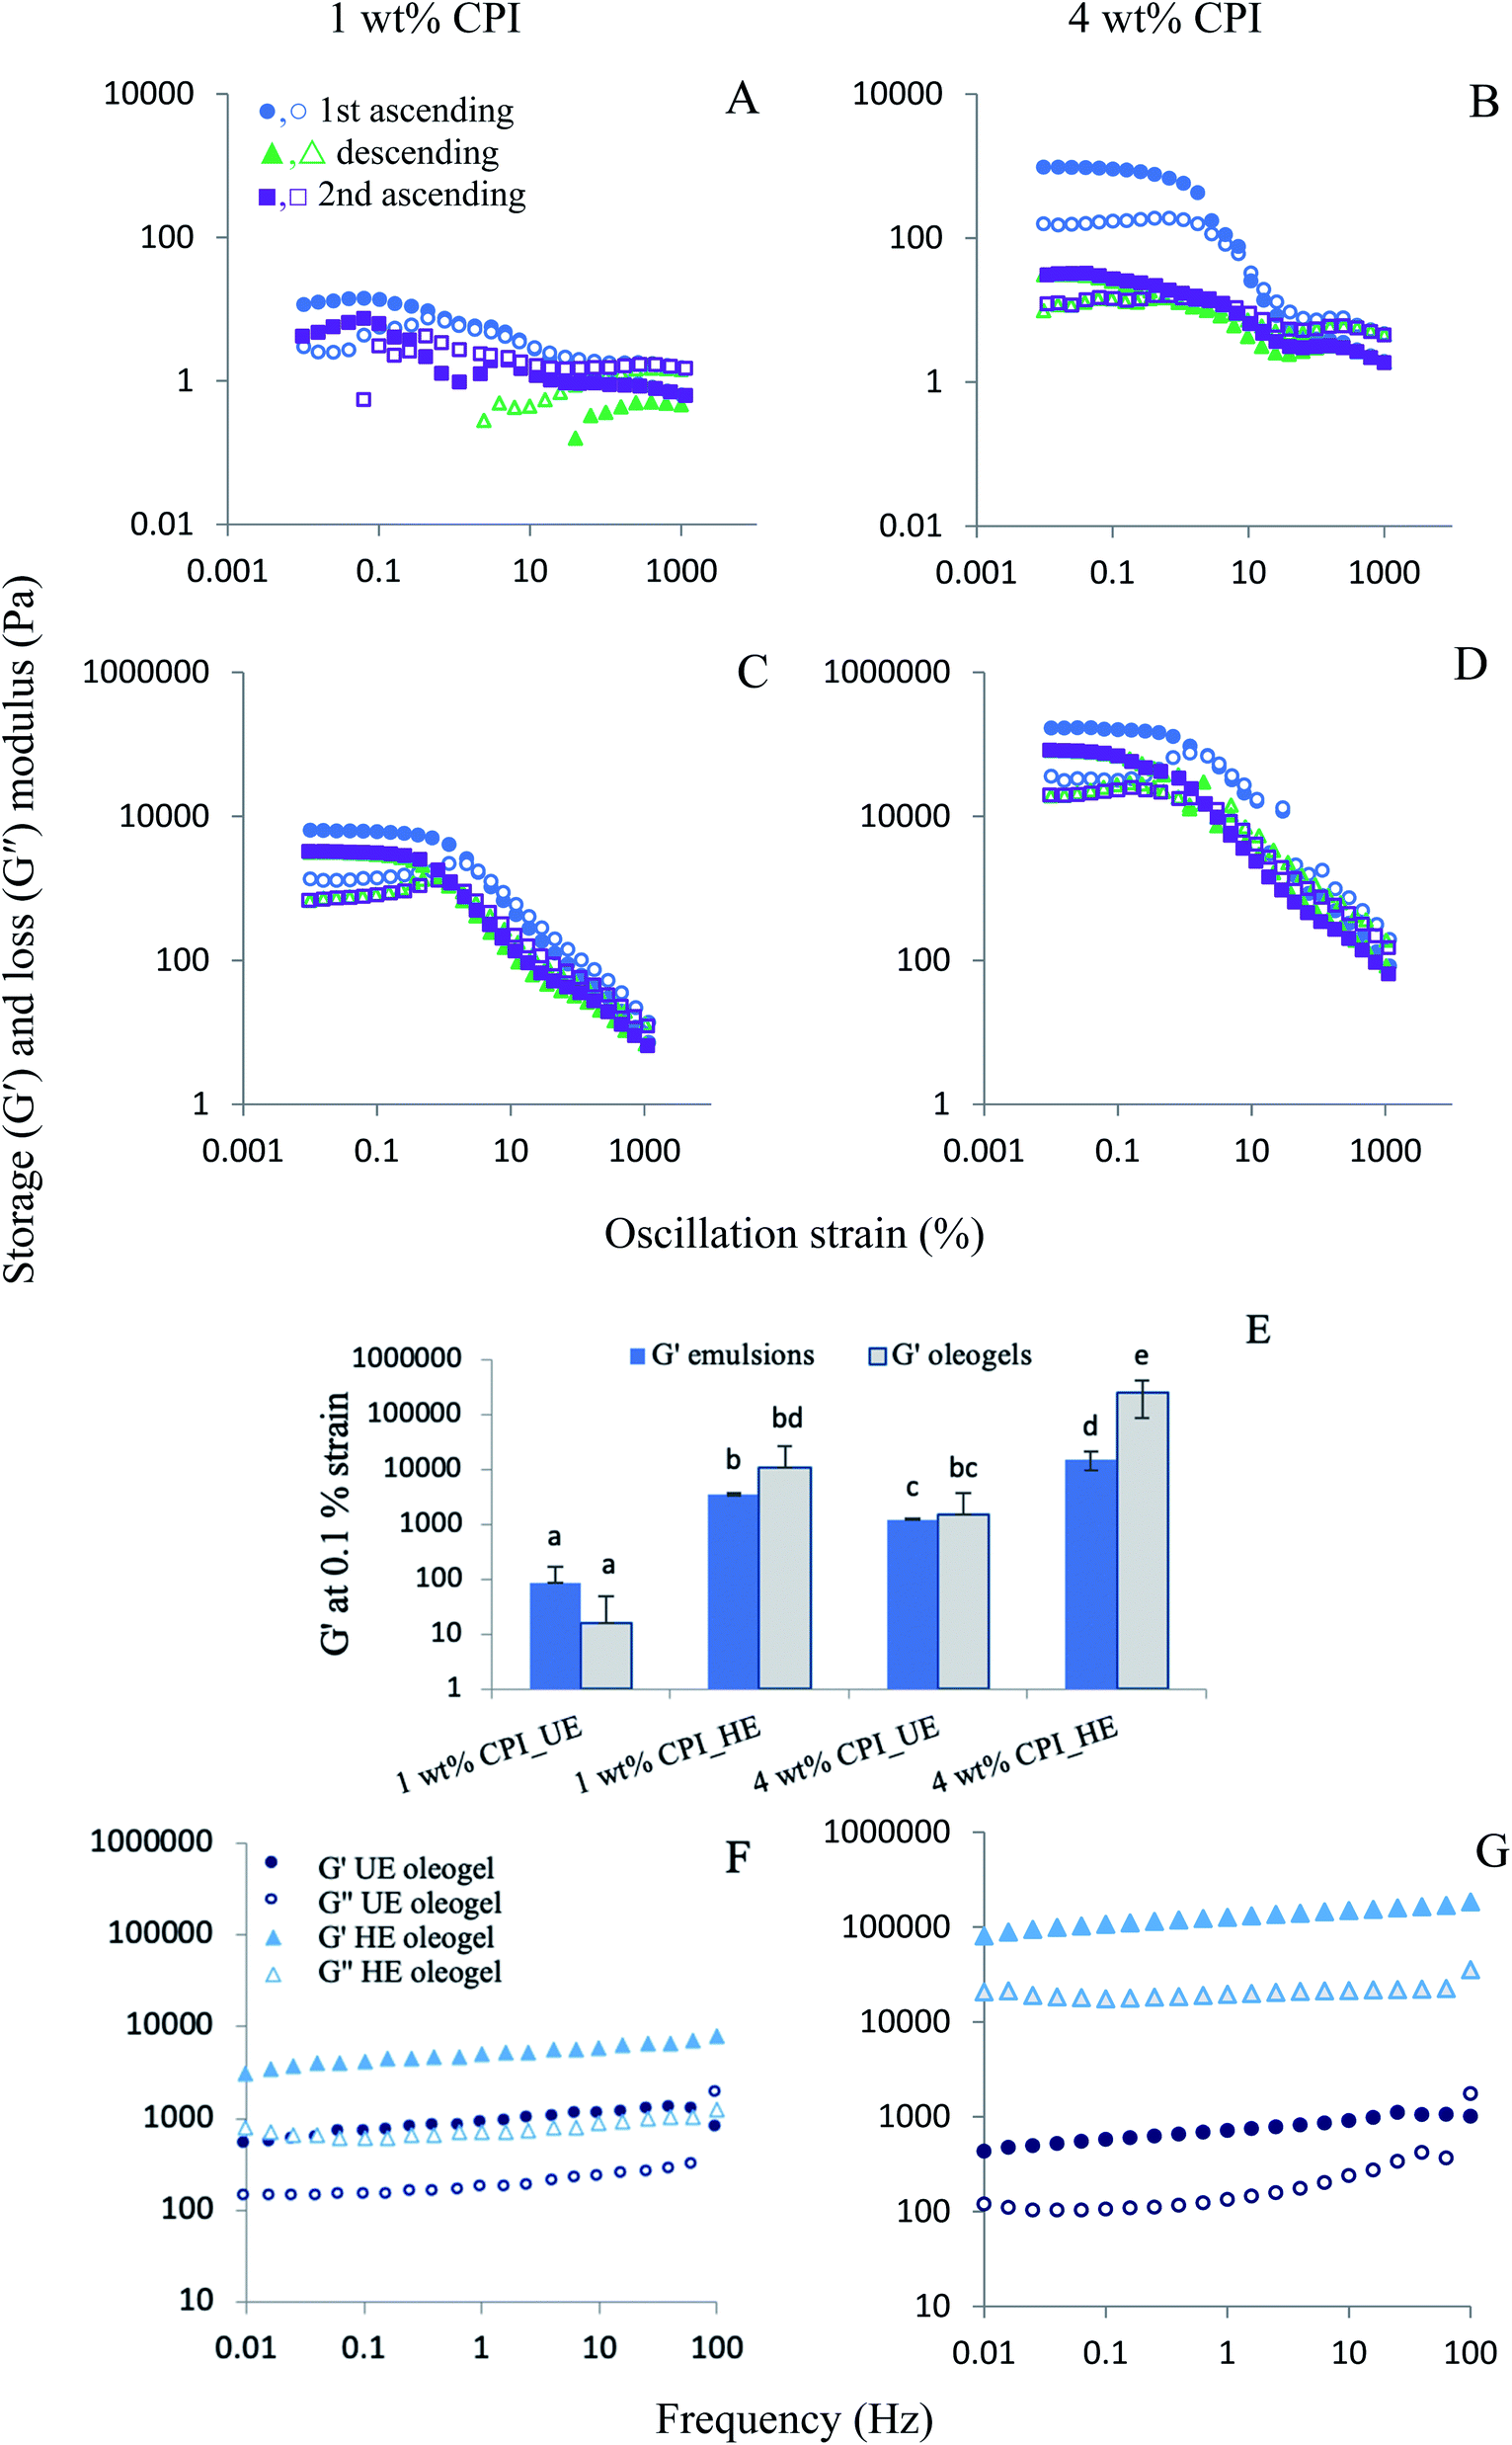
3.4.2 Viscoelasticity of oleogels. The viscoelastic properties of the oleogels were characterized by the dynamic oscillatory measurements (strain reversibility and frequency sweep) (Fig. 4). In the strain reversibility study, the samples were subjected to three cycles, starting from the first ascending strain sweep, followed by a descending strain sweep and a second ascending strain sweep. The 1 wt% CPI UE oleogel showed a weak gel behaviour where no linear viscoelastic region (LVR) was observed in the first ascending strain sweep. In the 1 wt% CPI HE, 4 wt% CPI UE and HE oleogels, the values of G′ were higher than G′′ in the low-strain region before crossover, and the LVRs were also observed between 0.01 to about 0.4% strain, indicating strong gel structure. Beyond LVR, both G′ and G′′ dropped, then went through a strain region where the values of G′ and G′′ remained similar, and after that the G′′ became higher than G′, indicating gel breakdown. For the 4 wt% CPI UE oleogel (Fig. 4B), a peak in G′′ was observed at around 250% strain, which could be due to a two-step yielding leading to a gel breakdown and release of free liquid oil from the oleogel. Such a peak in G′′ at higher strain could not be seen in both the HE oleogels (Fig. 4C and D), indicating improved structural stability of the oleogels made from heat-treated emulsions. During the descending strain sweep, all oleogels showed a loss in structural recovery as the low-strain G′ was lower than the initial G′ values during ascending strain sweep. The 4 wt% CPI UE oleogel (Fig. 4B) showed the lowest G′ and G′′ (only 3.0% recovery of G′) with a very short LVR in the descending strain sweep, indicating a loss of structure, which is consistent with the two-step yielding behaviour discussed above. For both the HE oleogels, G′ values in the LVR during the descending strain sweep were closer to the original G′ values, and recovery was about 50.8% & 43.0% for the 1 wt% (Fig. 4C) and 4 wt% CPI oleogels (Fig. 4D), respectively. During the second ascending strain sweep, there were no obvious changes in the gel behaviour compared to the descending strain sweep cycle, although the viscoelastic behaviour was much weaker than the original oleogels.
 |
| | Fig. 4 Oleogel viscoelasticity. Reversibility of oleogel viscoelasticity as a function of ascending ( ), descending ( ), descending ( ) and second ascending ( ) and second ascending ( ) strain sweep for unheated (UE) (A, B) and heated (HE) (C, D) 1 and 4 wt% CPI-stabilized emulsions. (E) Storage moduli (G′) at 0.1% strain for heated and unheated emulsions and their corresponding oleogels. (F, G) Storage (G′) and loss moduli (G′′) as a function of frequency for UE ( ) strain sweep for unheated (UE) (A, B) and heated (HE) (C, D) 1 and 4 wt% CPI-stabilized emulsions. (E) Storage moduli (G′) at 0.1% strain for heated and unheated emulsions and their corresponding oleogels. (F, G) Storage (G′) and loss moduli (G′′) as a function of frequency for UE ( ) and HE ( ) and HE ( ) oleogels from 1 and 4 wt% CPI. Storage moduli are denoted with close symbols, while loss moduli are shown with open symbols. ) oleogels from 1 and 4 wt% CPI. Storage moduli are denoted with close symbols, while loss moduli are shown with open symbols. | |
Emulsion-templated oleogels with gel strength ranged from 104 to 106 Pa was reported by various researchers. A common trend was the increase in G′ with an increase in the oleogelator concentration. In the present case, a maximum G′ of about 2.5 × 10⁵ Pa was observed for the 4 wt% CPI HE oleogels. According to Wijaya et al.,7 the highest G′ within the LVR was about 105 Pa for the oleogels stabilized by sodium caseinate–alginate complexes. Tavernier et al.9 reported the highest G′ between 105 Pa to 106 Pa in their emulsion-templated oleogels stabilized with 2.5% soy protein. The variability of the oleogel gel strengths among different studies could be attributed to various factors such as emulsion preparation and stabilization, oleogelator type and concentration, drying and shearing methods.
To directly compare the gel strength of the oleogels and the corresponding emulsions from the present study, their G′ values at 0.1% strain were plotted in Fig. 4E. For the unheated samples, emulsions' G′ values were not significantly different than the corresponding oleogels (p > 0.05). In contrast, for the 4 wt% CPI heated samples, the oleogels showed a significantly higher G′ than the corresponding emulsions (p < 0.05). Its G′ value was also the highest (∼2.5 × 10⁵ Pa) among all the oleogels and emulsions. The higher G′ of the oleogels than the emulsions could result from the removal of water from the continuous phase during drying, leading to the close-packed structure and stronger network formation by the protein-coated oil droplets and the aggregated proteins in the continuous phase.7 Here, the strength of the protein interfacial layer and its ability to fully cover the oil droplets are critical for oleogel viscoelasticity because only the 4 wt% CPI oleogels with heat-denatured protein-covered oil droplets showed an increased gel strength compared to the emulsions.
In the frequency sweep viscoelasticity study, all oleogels showed a higher G′ than G′′ at all frequencies up to 100 Hz (Fig. 4E and F). At 100 Hz, a crossover of G′ and G′′ was observed in the UE oleogels, indicating a gel breakdown at high-frequency shear. The HE oleogels exhibited strong gel-like behaviour with higher G′ and G′′ than the UE oleogels at all frequencies without any crossover, with the 4 wt% CPI HE oleogels showed the highest G′ at about 105 Pa.
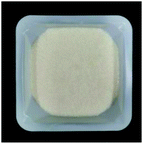
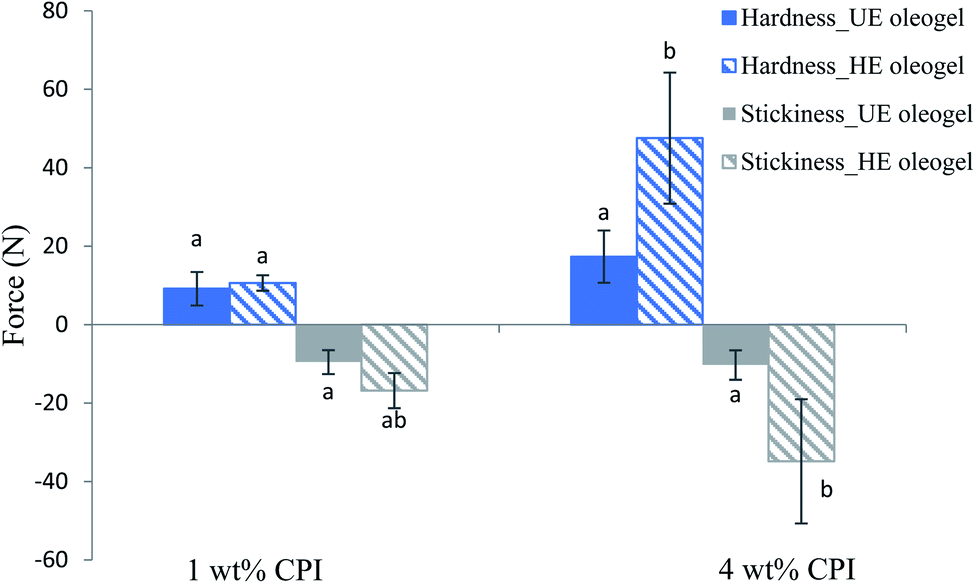
3.5 Texture analysis of oleogels
The texture parameters (firmness and stickiness) of the oleogels are shown in Fig. 5. A graph of force versus time was plotted during the measurement, and the positive maximum peak height was taken as the firmness while the maximum negative peak height was taken as stickiness.50 Firmness represents the total amount of force required during the shearing process. In contrast, stickiness represents the force necessary to overcome the adhesive forces between the sample and the surface of the probe with which the sample comes in contact.51 Overall, the 4 wt% CPI HE oleogel showed the highest firmness (47.5 ± 16.7 N) and stickiness (34.8 ± 15.8 N). The firmness of the 4 wt% CPI HE oleogel is comparable to the commercial shortening (46.5 ± 1.03 N) reported by Mohanan et al.37 using a similar experimental setup. For the 1 wt% CPI oleogels, there was no significant difference in firmness and stickiness between the UE and HE samples (p > 0.05). For the 4 wt% CPI oleogels, both the firmness and stickiness of the HE sample were higher than that of the UE sample (p < 0.05). The increase in firmness and stickiness in the heated emulsions oleogels could be ascribed to the strengthened protein network around the oil droplets from the heat denaturation and subsequent aggregation. Upon removing the water from the emulsions, the protein–protein network further strengthened around the oil droplets due to fewer protein–water interactions through hydrogen bonds.52 This can be seen from the one order of magnitude increase in  of the emulsions before and after heat treatment (Fig. 1C and D) and again in the corresponding oleogels (Fig. 4E). The increase in gel strength of the oleogels also improved their firmness. The stickiness of the oleogels could be due to the change in hydrophobic interactions or hydrogen bonding from the proteins. Yang et al.30 carried out the gel dissociation test to understand the interactions involved in the canola protein hydrogel. They had reported a sticky texture after the gel was immersed in urea for 48 h to disrupt the hydrogen bonds among the proteins.
 |
| | Fig. 5 Texture parameters (firmness and stickiness) of the oleogels from different emulsion templates. Different letters indicate significant difference within the same parameters (p < 0.05). | |
3.6 Characterization of cake batters prepared with different types of baking fat
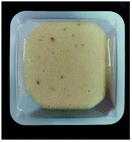
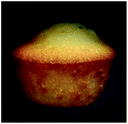
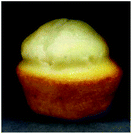
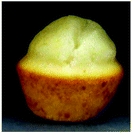
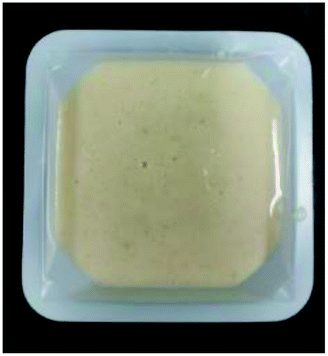
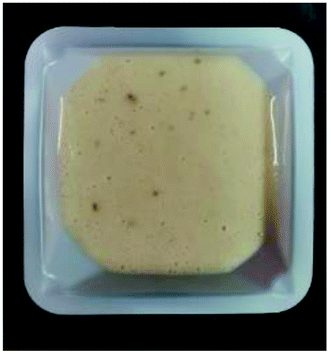
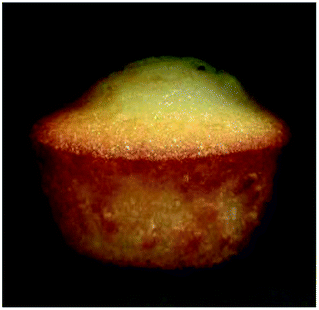
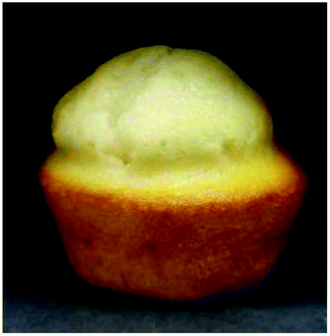
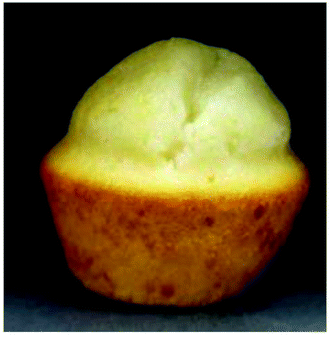
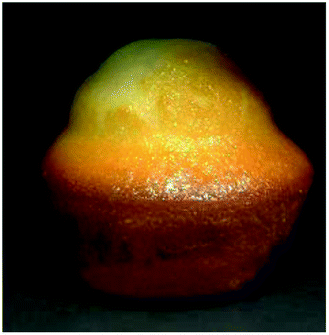
Since the 4 wt% CPI emulsion oleogels exhibited more desirable characteristics (higher gel strength and lower oil loss), both the UE and HE oleogels made from 4 wt% CPI emulsions were used as baking fat in cake preparation. Shortening and canola oil was also used as a control baking fat. The image of the cake batters after mixing are shown in Table 1. The cake batter prepared from the oleogels appeared to be darker than that of the shortening and canola oil cake batters.
Table 1 The images of the cake batters and cakes, specific gravities of cake batters, specific volumes (mL g−1) of cakes and the colour of the cake batter and crumb of cakes made with different types of fat. Different letters in the same row indicate significantly different values (p < 0.05)
| |
Shortening |
Canola oil |
UE oleogel |
HE oleogel |
| Batter |
 |
 |
 |
 |
| Specific gravity |
1.01 ± 0.02a |
1.05 ± 0.03ab |
1.06 ± 0.01ab |
1.09 ± 0.03b |
| Colour L* |
84.51 ± 3.60a |
79.15 ± 0.23b |
69.29 ± 2.20c |
70.28 ± 2.55c |
| Colour a* |
0.44 ± 0.54a |
−0.34 ± 0.05b |
1.82 ± 0.23c |
1.32 ± 0.16c |
| Colour b* |
15.03 ± 0.50a |
15.54 ± 0.33a |
20.63 ± 0.87b |
20.80 ± 0.38b |
| Cake |
 |
 |
 |
 |
| Specific volume |
1.50 ± 0.09a |
1.66 ± 0.08b |
1.73 ± 0.09bc |
1.82 ± 0.12c |
| Colour L* |
73.88 ± 0.80a |
80.31 ± 0.74b |
73.48 ± 1.27a |
71.72 ± 0.82c |
| Colour a* |
−0.38 ± 0.20a |
−0.63 ± 0.02b |
1.11 ± 0.35c |
1.13 ± 0.18c |
| Colour b* |
19.83 ± 1.60a |
17.77 ± 0.21b |
21.58 ± 0.38c |
21.33 ± 0.34c |
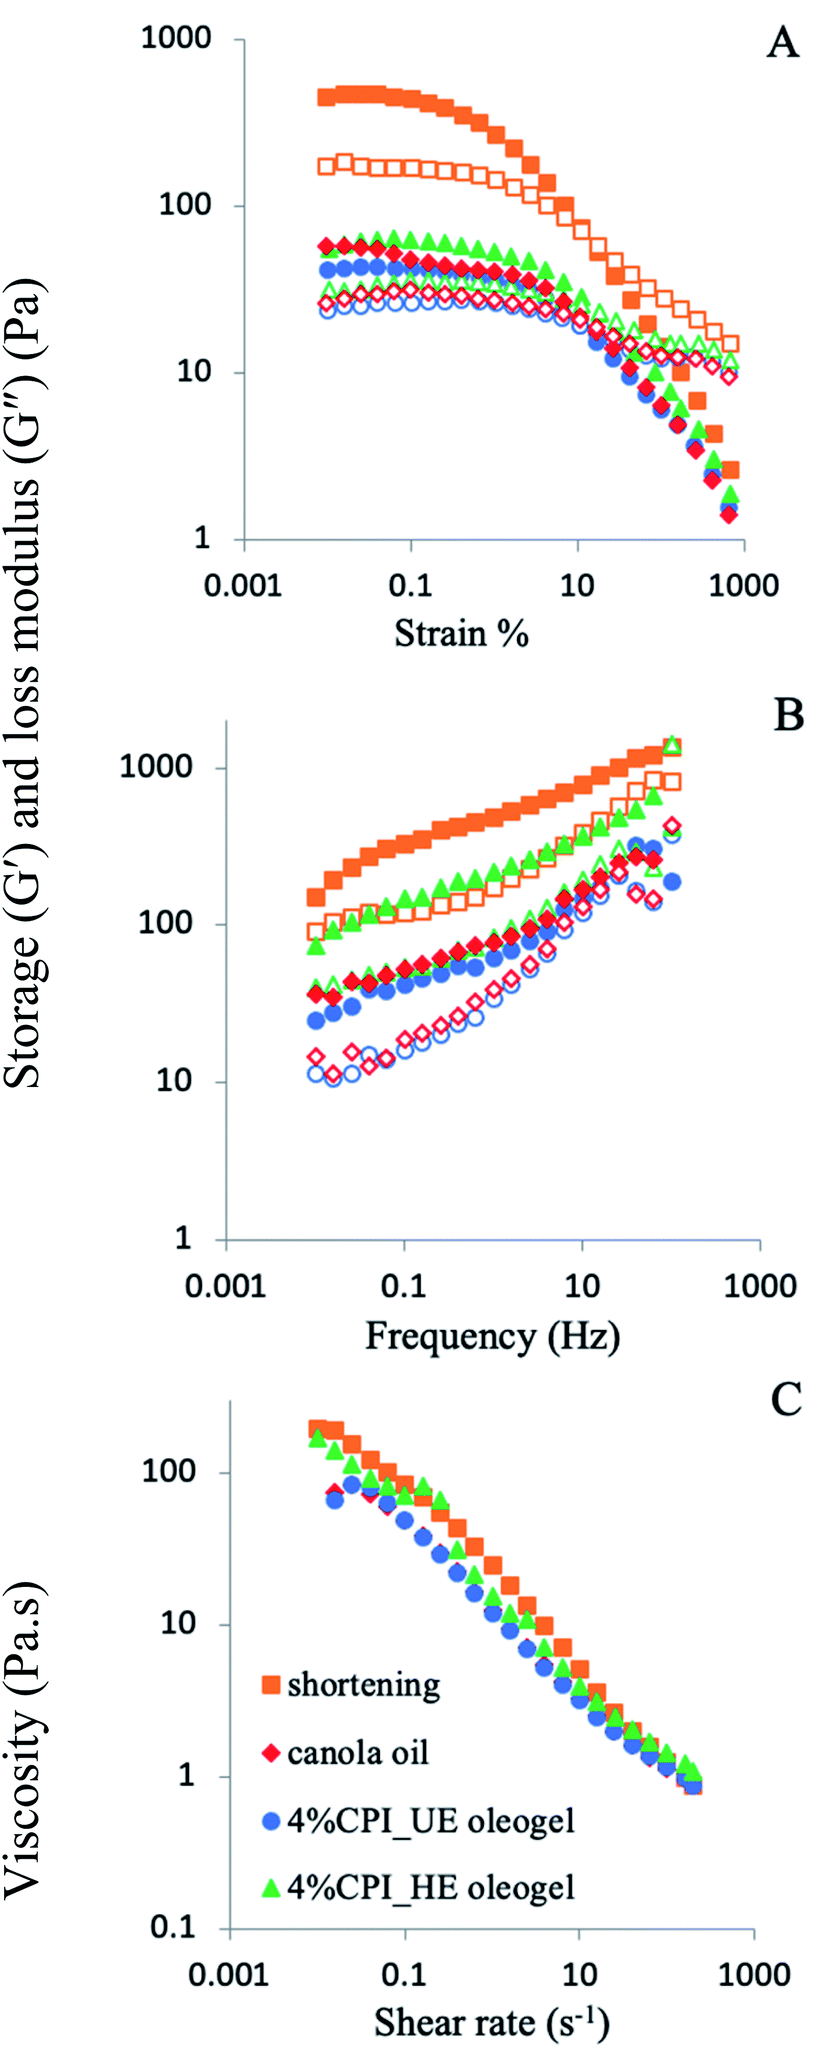
3.6.1 Rheology of cake batters. The viscoelastic properties of the cake batters were studied by the oscillatory strain and frequency sweep (Fig. 6A and B). In the strain sweep (Fig. 6A), the shortening cake batter showed much higher G′ and G′′ than all the oleogels and canola oil cake batters, even though all of them had a crossover at around 4.4 strain %. However, the LVR of the shortening cake batter was the shortest, which indicates the lowest yielding force of the gel structure. In the frequency sweep (Fig. 6B), the shortening cake batter exhibited higher G′ and G′′ at all frequency than the HE oleogel cake batter, while the UE oleogel and canola oil showed the lowest G′ and G′′. In the viscosity analysis, all the cake batters exhibited a shear thinning behaviour where the viscosity decreased as the shear rate increased, which was commonly seen in cake batters.23,24 Both the shortening and HE oleogel cake batters showed slightly higher viscosity than the rest of the batters at a lower shear rate between 0.01 to 10 s−1. The higher viscosity and gel strength of shortening cake batter might be attributed to the presence of solid fat crystals24 and the entrapped air bubbles by the shortening (will be discussed under microstructure), which caused more frictional resistance to shear.53 The higher viscosity and gel strength of the HE oleogel cake batter than the UE oleogel and canola oil cake batters might be ascribed to the high viscoelasticity of the HE oleogel. In the study of the utilization of beeswax oleogel-shortening mixtures in bakery products, Demirkesen and Mert23 showed an increase in batter viscosity as the shortening ratio in the fat phase increased. In cake baking, an optimum viscosity of the cake batter is required. Higher batter viscosity helps retain the air bubbles incorporated during mixing; however, it might also restrict the cake expansion during baking. On the contrary, if the batter viscosity is too low, it might not retain the air bubbles during baking, thus resulting in lower cake volume.54
 |
| | Fig. 6 Viscoelasticity of the cake batters made with shortening ( ), canola oil ( ), canola oil ( ), 4 wt% CPI unheated emulsion (UE) oleogel ( ), 4 wt% CPI unheated emulsion (UE) oleogel ( ) and 4 wt% CPI heated emulsion (HE) oleogel ( ) and 4 wt% CPI heated emulsion (HE) oleogel ( ) as a function of (A) strain % and (B) frequency. Data for storage moduli (G′, close symbol) and loss moduli (G′′, open symbol) are shown. (C) Viscosity of the cake batters made with different fats as a function of shear rate. ) as a function of (A) strain % and (B) frequency. Data for storage moduli (G′, close symbol) and loss moduli (G′′, open symbol) are shown. (C) Viscosity of the cake batters made with different fats as a function of shear rate. | |
3.6.2 Microstructure of cake batters. In the confocal micrographs, the fat phase of the shortening cake batter (Fig. 7A) appeared as the continuous phase with numerous small air bubbles entrapped within the fat matrix. For the oleogels and canola oil cake batters, the fat phase was dispersed around the protein's matrix as oil droplets, and the large air bubbles were stabilized by the oil droplets and the proteins (arrows in Fig. 7B and D). According to the cake batter confocal micrograph reported by Rodríguez-García et al.,19 sunflower oil appeared as oil droplets dispersed in the batter. Hesso et al.55 also showed a dispersed fat phase in the rapeseed oil cake batter and a more continuous fat phase in the milk fat cake batter. Mohanan et al.37 also observed numerous air bubbles entrapped in the shortening matrix of the cake batter. However, unlike the dispersed oil droplets shown in Fig. 7 for the canola oil and oleogel batters, the fat phase of their canola oil and pulse protein foam-templated oleogel batter appeared to be a continuous phase entrapping protein, flour particles and air bubbles.41 These different fat and air bubbles distributions in the cake batters reported by various authors could be attributed to the types of oleogel, oleogelators, and the mixing process, which involved multi-stage mixing or single-stage mixing along with various mixing speeds.16
 |
| | Fig. 7 Confocal micrograph of cake batters made with different types of fat: (A) shortening, (B) canola oil, (C) UE oleogel, and (D) HE oleogel. Fat phase is shown with red, while the proteins are shown in green. Yellow colour regions are combination of signal from of both the fat and proteins. Air bubbles are appeared as circular black spheres. White arrows show the large air bubbles were stabilized by the oil droplets and the proteins. Scale bar 200 μm. | |
Since fat enhances the batter aeration for leavening of cake during baking, the specific gravity of the cake batter was determined to understand the extent of aeration due to shortening replacement with oleogels.16 The specific gravity of the shortening cake batter (1.01 ± 0.02) was the lowest of all; however, only the specific gravity of HE oleogel cake batter (1.09 ± 0.03) was significantly different than all the others (p < 0.05) (Table 1). The mechanism of air bubble stabilization by shortening is different from canola oil and oleogels. The shortening cake batter showed numerous small air bubbles entrapped in the continuous fat phase (Fig. 7). The solid crystals and the monoglyceride emulsifiers present in the shortening helped to stabilize a large number of air bubbles.17,56 Oleogels were able to incorporate a lower amount and larger air bubbles compared to shortening. Some air bubbles were also seen to be stabilized by oil droplets (see arrows in Fig. 7B and C); however, oil droplets were not as efficient as fat crystals and monoglycerides. Hence, HE oleogel with a higher oil droplet stability was not capable of stabilizing a large number of air bubbles (Fig. 7D). A higher specific gravity of the oleogel cake batter than the shortening cake had also been reported by Amoah et al.20 and Patel et al.25
3.6.3 Colour of cake batters. The effect of different fat phases on the cake batter colour was also studied (Table 1). The colour of the cake batter was measured by a colorimeter and reported as a combination of L* (lightness/darkness), a* (greenness/redness) and b* (blueness/yellowness). The value of L* of the shortening cake batter (84.51 ± 3.60) was the highest (p < 0.05) while it was the lowest for the UE (69.29 ± 2.20) and HE oleogels (70.28 ± 2.55) cake batters, indicating darker colour for the latter (Table 1). For the a* value, the UE and HE oleogel showed the highest values, while the canola oil cake batter exhibited the lowest values (p < 0.05). The b* values were not significantly different between the shortening and canola oil and between the UE and HE oleogels (p > 0.05). Still, the oleogels showed a higher b* than that of the shortening and canola oil. Higher a* and b* indicate higher redness and yellowness for the oleogel cake batters, respectively. The change of colour in the cake batter could be ascribed to the presence of canola protein which was dark brown due to the presence of phenolic antioxidants.57
3.7 Evaluation of cake properties prepared with different types of baking fat
3.7.1 Cake specific volume. All the cakes appeared golden brown, with the oleogel-based cakes showing a higher rise than the others (Table 1). The specific volume of the cake was calculated by taking the ratio of the cake volume to its weight. The specific volume of the shortening cake (1.50 ± 0.09 mL g−1) is significantly lower than that of the canola oil cake (1.66 ± 0.08 mL g−1) and oleogels cake (p < 0.05), while the HE oleogel cake exhibited the highest specific volume (1.82 ± 0.12 mL g−1) among all (Table 1). The final cake volume depends on the initial air incorporation during mixing and the stability of the air bubbles during baking.17 In this case, the shortening batter showed higher air incorporation (lower specific gravity); however, the final cake specific volume was lower than the oleogel cakes. A higher specific volume of a cake could be ascribed to its stability against bubble collapse during the cooling and structure setting process. Wilderjans et al.58 reported that more protein aggregation helped stabilize the cake structure against collapse due to the formation of the stronger cell walls. Hence, canola protein aggregates in the oleogel cakes could form a stronger protein-starch network during baking, strengthening the cake structure during cooling, and rendered a higher specific volume. Although the HE oleogels had more protein aggregation due to the initial heat treatment, during baking, the temperature reached 190 °C, which was enough to induce protein denaturation in the UE oleogel cakes as well leading to the formation of a stronger protein network around the air bubbles.
3.7.2 Cake colour. From the colour analysis of the cakes' internal cross-section, the L* value was the highest for the canola oil cake (80.31 ± 0.74) while it was the lowest for the HE oleogel cake (71.72 ± 0.82). The L* value of the cakes prepared with shortening and UE oleogel were not significantly different (p > 0.05). For a* and b* values, shortening and canola oil cakes were significantly different (p < 0.05); however, the UE and HE oleogel cakes had significantly higher a* and b* values than the shortening and canola oil cakes due to the presence of canola protein which caused a darker colour in the cake batters as mentioned above.
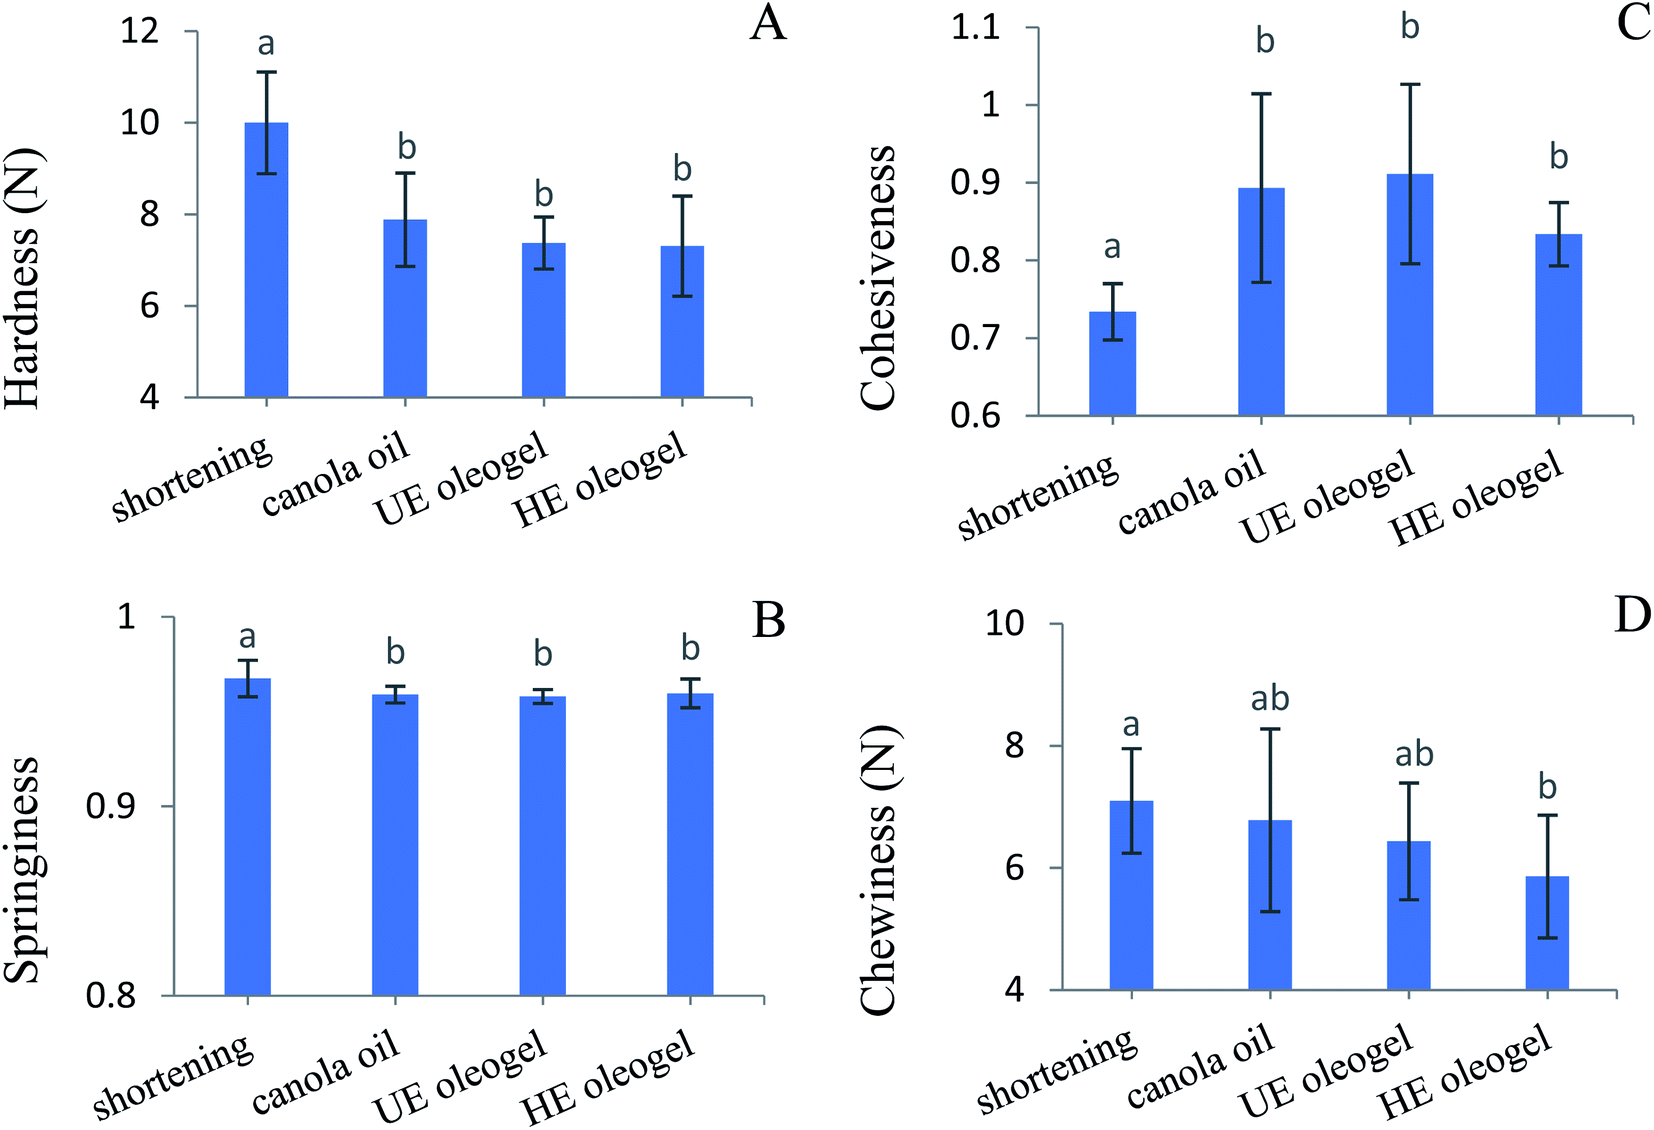
3.7.3 Cake texture profile analysis. Fig. 8 showed the result of the texture profile analysis of the cakes using a two-step compression test. Hardness, chewiness, springiness and cohesiveness values were calculated from the force vs. time graph. Hardness is defined as the maximum force obtained during the first compression curve. In the present study, the hardness of the shortening cake was significantly higher than that of the canola oil and oleogel cakes (p < 0.05). To understand the relationship between the cake hardness and the cake volume, they were plotted against each other in Fig. S2 (ESI†). The trend suggests that the cake hardness reduction was associated with an increase in cake volume. It showed an R2 value of 0.67, indicating more than half of the variability in hardness could be attributed to the changes in the cake volume. It has been established that higher cake volume is usually associated with lower hardness.59 Zhou et al.60 also reported a similar relationship of cake volume and the cake hardness when using different types of shortening and liquid vegetable oil with various emulsifiers as fat phase; however, they reported a lower R2 value of 0.47. In the present case, canola proteins in the oleogels could be associated with improved structure formation around the air bubble, thereby increasing cake volume and reducing hardness.
 |
| | Fig. 8 Texture parameters (A) hardness, (B) springiness, (C) cohesiveness, (D) chewiness of cakes prepared with different types of fats. Different letters indicate significant difference (p < 0.05). | |
Springiness (Fig. 8B) indicates a cake's ability to recover to its initial height between the two compression cycles. Although it is significantly different, the shortening cake's springiness (0.97 ± 0.01) was almost similar to the canola oil and oleogel cakes (0.96 ± 0.004). The cohesiveness (Fig. 8C) of the cake was calculated from the ratio of the second peak area to the first peak area in the force versus time graph. It gives an indication of the crumbliness or perceptions of denseness in the sensory studies.61 The cohesiveness of the shortening cake was lower than that of the canola oil and oleogel cakes (p < 0.05), suggesting less crumbliness for the shortening cake. Chewiness (Fig. 8D) is a function of hardness, springiness and cohesiveness. The shortening, canola oil and UE oleogel cakes exhibited higher chewiness with values ranged from 6.44 ± 0.96 N to 7.09 ± 0.86 N. In comparison, the HE oleogel cake showed a significantly lower chewiness (5.86 ± 1.00 N) than the shortening cake (p < 0.05), but it was similar to the canola oil and UE-oleogel cakes (p > 0.05).
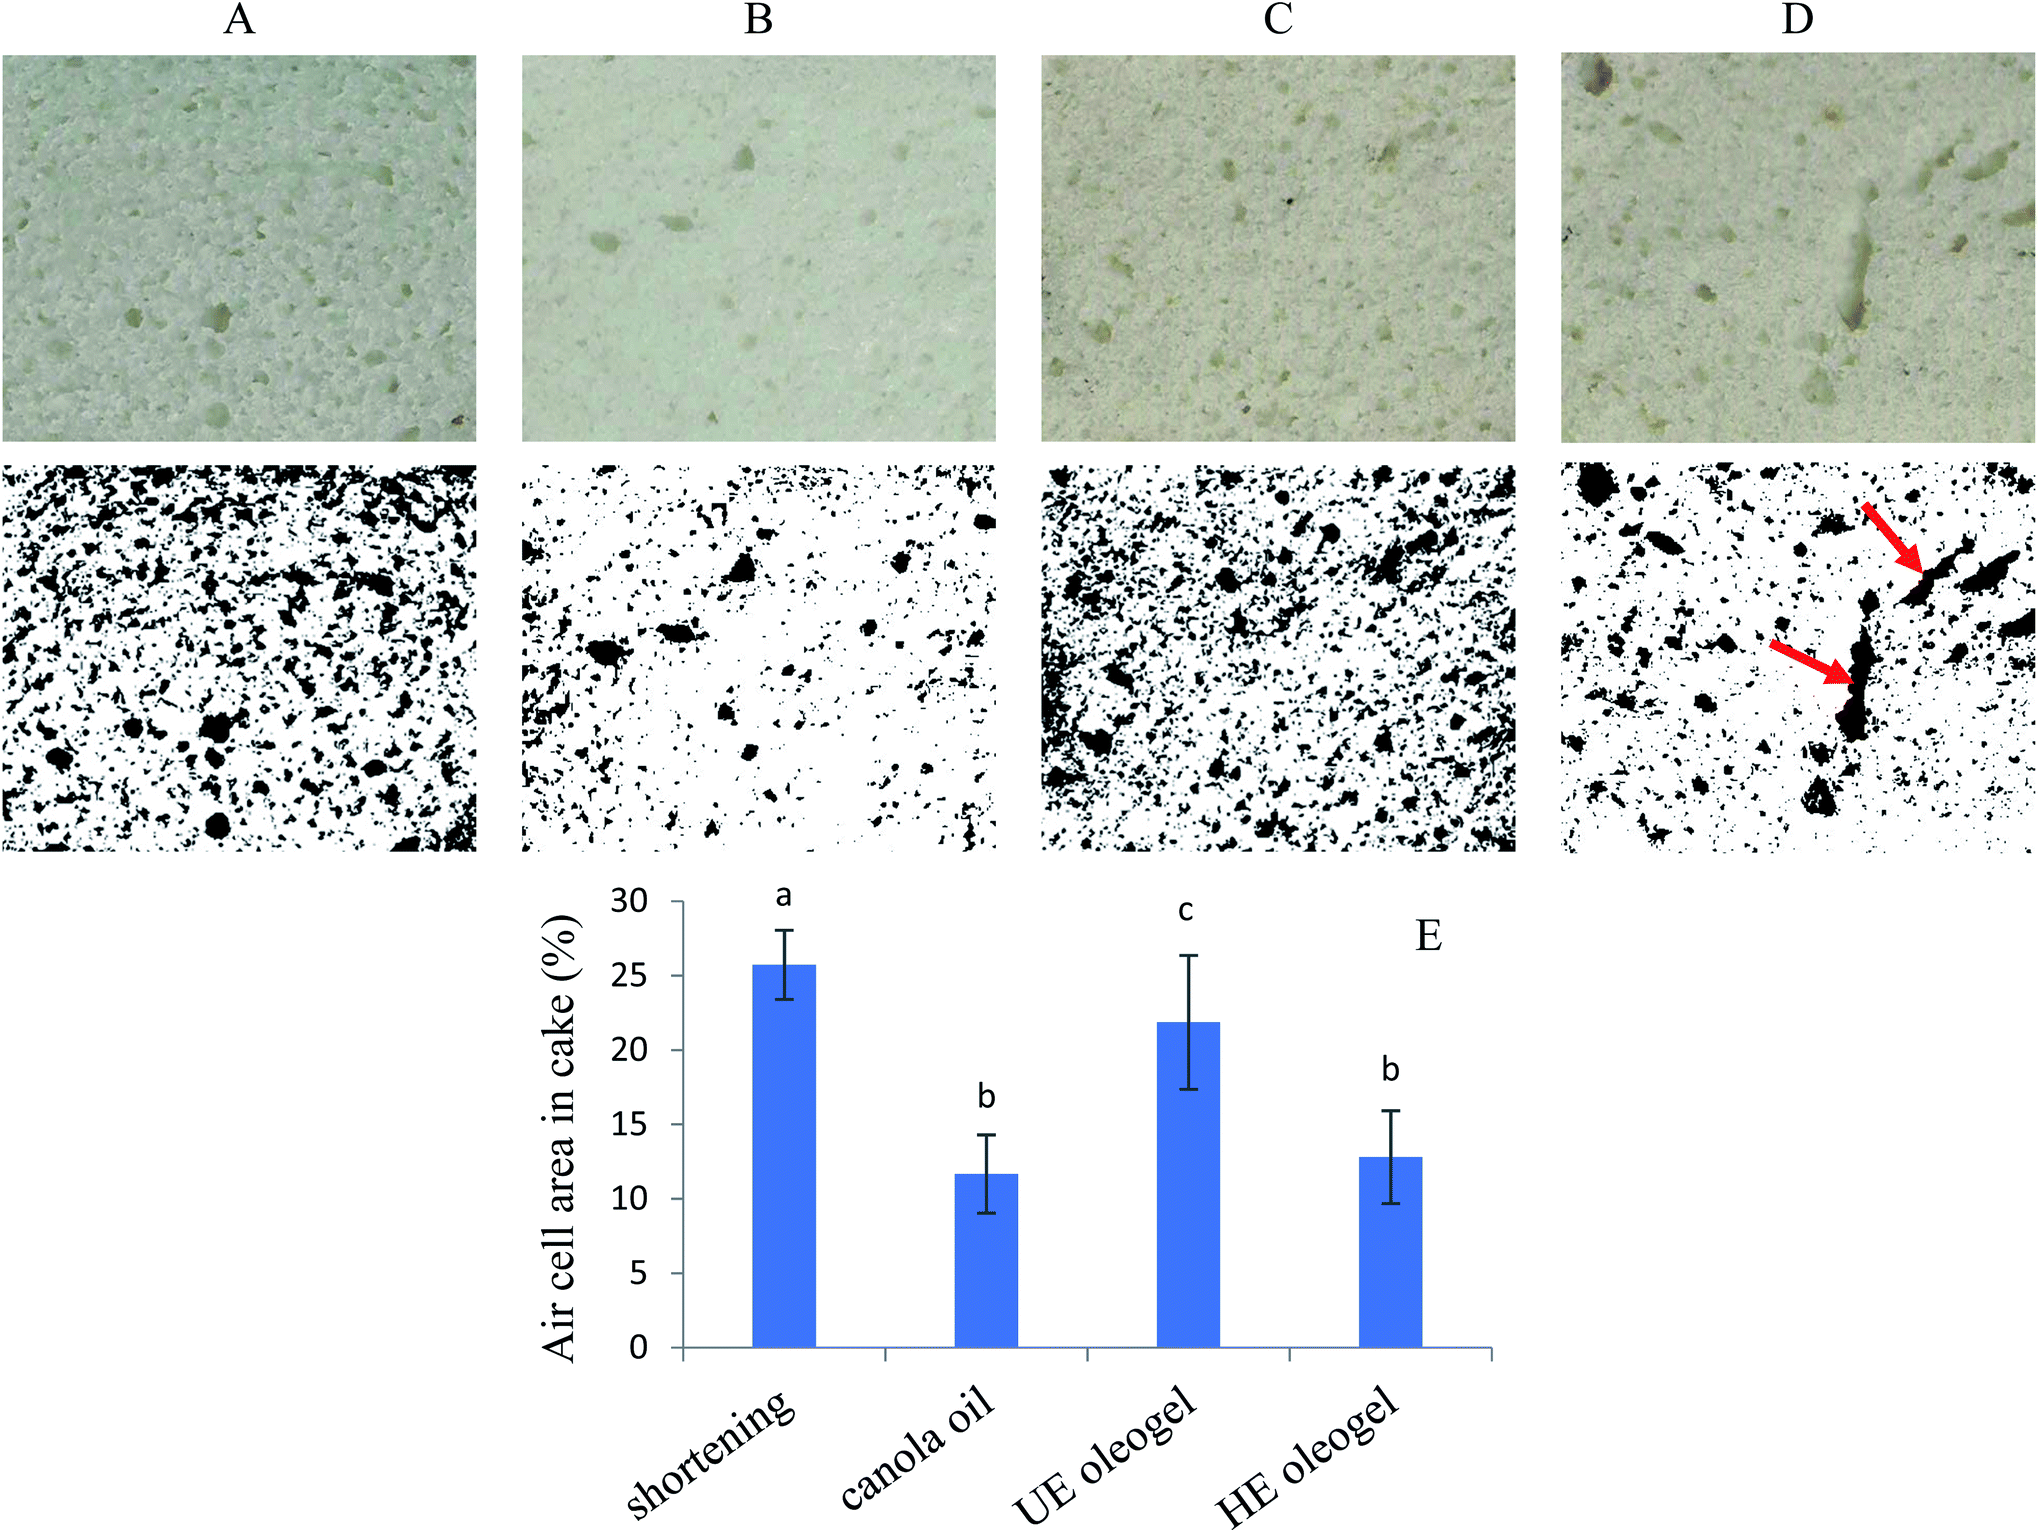
To understand the origin of higher cake volume in the HE oleogel cake, the internal cellular structure of the cakes was recorded, and the cell area percentages were calculated by analyzing the binary images (Fig. 9). The shortening cake showed the highest cell area percentage, which could be attributed to stabilization of numerous air bubbles by the fat crystals and monoglycerides present in the shortening batter microstructure (Fig. 7A). In contrast, the lowest cell area percentage of canola oil and HE oleogel cake can be attributed to a lower amount air bubbles poorly stabilized by oil droplets and proteins, as observed in the batter microstructure (Fig. 7B–D). Although a higher air cell area percentage often resulted in a higher specific volume,20,62 this correlation was not observed in this study. The shortening cake showed a lower specific volume despite having a higher cell area percentage, while the HE oleogel cake showed a higher specific volume despite a lower cell area percentage. Such difference could be partially attributed to the different batter microstructure and the different mechanism of air bubble stabilization in shortening and oleogel cakes (Fig. 7). According to Matsakidou et al.,63 continuous bubble channels are essential in maintaining the cake volume during cooling. During cake baking, the starch granules gelatinized and the protein aggregated, the batter transformed into a solid foam leading to the cake structure formation.16 Simultaneously, the high temperature in the cake also caused the air cells to expand, ruptured and coalesced. These big bubbles could rapidly float to the surface and disappear; however, if the cake structure was set before the bubble dispersion, the big air bubbles would form tunnels in the cakes.17 As shown in Fig. 9D, continuous channels (shown with arrows) were observed in the HE oleogel cake, possibly due to the stabilization effect of denatured aggregated canola proteins, contributing to the higher specific volume despite a lower total cell area percentage. Higher specific volume of HE oleogel cake led to lower hardness than the shortening cake.
 |
| | Fig. 9 Cellular structure of the cakes crumbs baked with (A) shortening, (B) canola oil, (C) UE oleogel, (D) HE oleogel as fat phase. Top row: scanned cake crumbs, middle row: binary images of the scanned crumbs. (E) Total air cell area of the cake crumbs prepared with different fat types calculated from the binary images using ImageJ software. | |
4. Conclusions
In conclusion, protein isolate extracted from cold-pressed canola meal was successfully utilized to develop emulsion-templated oleogels. Heated and unheated 1 and 4 wt% CPI-stabilized 50 wt% oil-in-water emulsions were vacuum dried to remove water, followed by shearing to create a homogeneous texture of the oleogels. Heated emulsions exhibited better structure formation in the oleogels with significantly lower oil loss and higher gel strength than the oleogels developed from unheated emulsions, which were ascribed to heat-induced canola protein denaturation and aggregation at the oil droplet surface and in the continuous phase. Among all, the 4 wt% CPI HE oleogel exhibited superior characteristics in terms of gel-like structure, lowest oil loss, higher viscosity and viscoelasticity, and higher firmness and cohesiveness. Therefore, complete replacement of highly saturated shortening with the 4 wt% CPI UE and HE oleogels in cake baking was investigated. Despite having a higher specific gravity of the batter and the lower air cell area of the cake crumb, the HE oleogel cake exhibited higher cake specific volume than the shortening cake due to the formation of larger air channels in the cake stabilized by the presence of aggregated canola proteins. Both UE and HE oleogels cakes exhibited lower hardness, higher springiness and cohesiveness than the shortening cake, which was attributed to higher cake volume in the presence of canola protein-stabilized oleogels. Overall, the present study showed the potential of heat-denatured CPI in forming stable oleogels via the emulsion-templated method and the ability of the CPI oleogels to replace conventional highly saturated shortening in cake baking. Successful application such oleogel to replace saturated fat in baking would significantly improve the health beneficial aspects of processed food.
Conflicts of interest
There are no conflicts of interest to declare.
Acknowledgements
This research was supported by SaskCanola Dr Roger Rimmer Graduate Student Scholarship, NSERC Discovery Grant, Canada Foundation for Innovation (CFI) Leaders Opportunity Fund and Saskatchewan Science Foundation.
References
- A. G. Marangoni, J. Am. Oil Chem. Soc., 2012, 89, 749–780 CrossRef CAS.
- M. A. Rogers, Food Res. Int., 2009, 42, 747–753 CrossRef CAS.
- J. Daniel and R. Rajasekharan, J. Am. Oil Chem. Soc., 2003, 80, 417–421 CrossRef CAS.
- M. A. Rogers, A. J. Wright and A. G. Marangoni, Soft Matter, 2008, 4, 1483–1490 RSC.
- X. Yan, Y. Cui, Q. He, K. Wang and J. Li, Chem. Mater., 2008, 20, 1522–1526 CrossRef CAS.
- I. Demirkesen and B. Mert, Crit. Rev. Food Sci. Nutr., 2020, 60, 2460–2479 CrossRef CAS PubMed.
- W. Wijaya, Q.-Q. Sun, L. Vermeir, K. Dewettinck, A. R. Patel and P. Van der Meeren, Food Struct., 2019, 21, 100112 CrossRef.
- C. Qiu, Y. Huang, A. Li, D. Ma and Y. Wang, J. Agric. Food Chem., 2018, 66, 13243–13252 CrossRef CAS PubMed.
- I. Tavernier, A. R. Patel, P. Van der Meeren and K. Dewettinck, Food Hydrocolloids, 2017, 65, 107–120 CrossRef CAS.
- Z. Meng, K. Qi, Y. Guo, Y. Wang and Y. Liu, Food Chem., 2018, 246, 137–149 CrossRef CAS PubMed.
- Y. Jiang, L. Liu, B. Wang, X. Sui, Y. Zhong, L. Zhang, Z. Mao and H. Xu, Food Hydrocolloids, 2018, 77, 460–464 CrossRef CAS.
- A. R. Patel, D. Schatteman, A. Lesaffer and K. Dewettinck, RSC Adv., 2013, 3, 22900–22903 RSC.
- A. R. Patel, Mater. Chem. Phys., 2017, 195, 268–274 CrossRef CAS.
- A. R. Patel, N. Cludts, M. D. Bin Sintang, B. Lewille, A. Lesaffer and K. Dewettinck, ChemPhysChem, 2014, 15, 3435–3439 CrossRef CAS PubMed.
- A. R. Patel, P. S. Rajarethinem, N. Cludts, B. Lewille, W. H. De Vos, A. Lesaffer and K. Dewettinck, Langmuir, 2015, 31, 2065–2073 CrossRef CAS PubMed.
- E. Wilderjans, A. Luyts, K. Brijs and J. A. Delcour, Trends Food Sci. Technol., 2013, 30, 6–15 CrossRef CAS.
- J. Zhou, J. M. Faubion and C. E. Walker, LWT--Food Sci. Technol., 2011, 44, 1802–1808 CrossRef CAS.
- P. W. Siri-Tarino, S. Chiu, N. Bergeron and R. M. Krauss, Annu. Rev. Nutr., 2015, 35, 517–543 CrossRef CAS PubMed.
- J. Rodríguez-García, A. Puig, A. Salvador and I. Hernando, J. Food Sci., 2012, 77, C189–C197 CrossRef PubMed.
- C. Amoah, J. Lim, S. Jeong and S. Lee, LWT--Food Sci. Technol., 2017, 86, 430–437 CrossRef.
- M. Sowmya, T. Jeyarani, R. Jyotsna and D. Indrani, Food Hydrocolloids, 2009, 23, 1827–1836 CrossRef CAS.
- H. Pehlivanoglu, G. Ozulku, R. M. Yildirim, M. Demirci, O. S. Toker and O. Sagdic, J. Food Process. Preserv., 2018, 42, e13621 CrossRef.
- I. Demirkesen and B. Mert, J. Am. Oil Chem. Soc., 2019, 96, 545–554 CrossRef CAS.
- S. A. Willett and C. C. Akoh, J. Food Sci., 2019, 84, 1390–1399 CrossRef CAS PubMed.
- A. R. Patel, P. S. Rajarethinem, A. Grędowska, O. Turhan, A. Lesaffer, W. H. De Vos, D. Van de Walle and K. Dewettinck, Food Funct., 2014, 5, 645–652 RSC.
- S.-Z. Luo, X.-F. Hu, Y.-J. Jia, L.-H. Pan, Z. Zheng, Y.-Y. Zhao, D.-D. Mu, X.-Y. Zhong and S.-T. Jiang, Food Hydrocolloids, 2019, 95, 76–87 CrossRef CAS.
- A. R. Patel, N. Cludts, M. D. B. Sintang, A. Lesaffer and K. Dewettinck, Food Funct., 2014, 5, 2833–2841 RSC.
- E. B. Bennion and G. Bamford, The technology of cake making, Springer Science & Business Media, 1997 Search PubMed.
- J. H. Kim, N. V. Varankovich, A. K. Stone and M. T. Nickerson, Food Res. Int., 2016, 89, 408–414 CrossRef CAS PubMed.
- C. Yang, Y. Wang, T. Vasanthan and L. Chen, Food Hydrocolloids, 2014, 40, 225–236 CrossRef CAS.
- R. He, H.-Y. He, D. Chao, X. Ju and R. Aluko, Food Bioprocess Technol., 2014, 7, 1344–1353 CrossRef CAS.
- L. W. Léger and S. D. Arntfield, J. Am. Oil Chem. Soc., 1993, 70, 853–861 CrossRef.
- Y. L. Folawiyo and R. K. O. Apenten, J. Sci. Food Agric., 1996, 70, 241–246 CrossRef CAS.
- Y. R. Tang and S. Ghosh, Food Hydrocolloids, 2020, 106399 Search PubMed.
- H.-N. Liang and C.-h. Tang, LWT--Food Sci. Technol., 2014, 58, 463–469 CrossRef CAS.
- A. G. Marangoni and N. Garti, Edible oleogels: structure and health implications, Elsevier, 2018 Search PubMed.
- A. Mohanan, Y. R. Tang, M. T. Nickerson and S. Ghosh, RSC Adv., 2020, 10, 14892–14905 RSC.
- AACC, Approved Methods of Analysis, 11th edn, Method 90–10.01, 1999 Search PubMed.
- Y. Zou, J. Guo, S.-W. Yin, J.-M. Wang and X.-Q. Yang, J. Agric. Food Chem., 2015, 63, 7405–7414 CrossRef CAS PubMed.
- M. A. Gularte, M. Gómez and C. M. Rosell, Food Bioprocess Technol., 2012, 5, 3142–3150 CrossRef CAS.
- A. Mohanan, M. T. Nickerson and S. Ghosh, J. Am. Oil Chem. Soc., 2020, 97, 1319–1333 CrossRef CAS.
- Z. Shao, A. S. Negi and C. O. Osuji, Soft Matter, 2013, 9, 5492–5500 RSC.
- R. C. Kramb and C. F. Zukoski, J. Phys.: Condens. Matter, 2010, 23, 035102 CrossRef PubMed.
- J. H. Kim, N. V. Varankovich and M. T. Nickerson, Food Res. Int., 2016, 81, 31–38 CrossRef CAS.
- A. I. Blake and A. G. Marangoni, J. Am. Oil Chem. Soc., 2014, 91, 885–903 CrossRef CAS.
- P. V. Gadkari, N. Longmore, M. Reaney and S. Ghosh, Colloid Interface Sci. Commun., 2019, 30, 100180 CrossRef CAS.
- A. I. Romoscanu, A. Fenollosa, S. Acquistapace, D. Gunes, T. Martins-Deuchande, P. Clausen, R. Mezzenga, M. Nydén, K. Zick and E. Hughes, Langmuir, 2010, 26, 6184–6192 CrossRef CAS PubMed.
- C. Zhang, Z. Jin, B. Zeng, W. Wang, G. Palui and H. Mattoussi, J. Phys. Chem. B, 2020, 124(22), 4631–4650 CrossRef CAS PubMed.
- I. Tavernier, C. D. Doan, P. Van der Meeren, B. Heyman and K. Dewettinck, Eur. J. Lipid Sci. Technol., 2018, 120, 1700393 CrossRef.
- S. Bayarri, I. Carbonell and E. Costell, J. Dairy Sci., 2012, 95, 6926–6936 CrossRef CAS PubMed.
- E. Yılmaz and M. Öğütcü, RSC Adv., 2015, 5, 50259–50267 RSC.
- E. Scholten, Curr. Opin. Food Sci., 2019, 27, 36–42 CrossRef.
- B. Brooker, Food Struct., 1993, 12, 2 Search PubMed.
- S. S. Sahi and J. M. Alava, J. Sci. Food Agric., 2003, 83, 1419–1429 CrossRef CAS.
- N. Hesso, C. Garnier, C. Loisel, S. Chevallier, B. Bouchet and A. Le-Bail, Food Struct., 2015, 5, 31–41 CrossRef.
- S. M. Lakshminarayan, V. Rathinam and L. KrishnaRau, J. Sci. Food Agric., 2006, 86, 706–712 CrossRef CAS.
- L. Xu and L. Diosady, Food Res. Int., 2002, 35, 23–30 CrossRef CAS.
- E. Wilderjans, B. Pareyt, H. Goesaert, K. Brijs and J. A. Delcour, Food Chem., 2008, 110, 909–915 CrossRef CAS PubMed.
- C. E. Stauffer, Emulsifiers, Eagan Press Handbook Series, AACC, St. Paul, MN, 1999, pp. 47–66 Search PubMed.
- J. Zhou, J. M. Faubion and C. E. Walker, LWT--Food Sci. Technol., 2011, 44, 1802–1808 CrossRef CAS.
- M. A. Brandt, E. Z. Skinner and J. A. Coleman, J. Food Sci., 1963, 28, 404–409 CrossRef.
- S. Mironeasa, G. G. Codină and M. A. Oroian, Bull. UASVM Food Sci. Technol., 2016, 73, 2344 Search PubMed.
- A. Matsakidou, G. Blekas and A. Paraskevopoulou, LWT--Food Sci. Technol., 2010, 43, 949–957 CrossRef CAS.
Footnote |
| † Electronic supplementary information (ESI) available. See DOI: 10.1039/d1ra02250d |
|
| This journal is © The Royal Society of Chemistry 2021 |
Click here to see how this site uses Cookies. View our privacy policy here. 
 Open Access Article
 This Open Access Article is licensed under a Creative Commons Attribution-Non Commercial 3.0 Unported Licence
 *
*

 ), descending (
 ) and second ascending (
 ) strain sweep for unheated (UE) (A, B) and heated (HE) (C, D) 1 and 4 wt% CPI-stabilized emulsions. (E) Storage moduli (G′) at 0.1% strain for heated and unheated emulsions and their corresponding oleogels. (F, G) Storage (G′) and loss moduli (G′′) as a function of frequency for UE (
 ) and HE (
 ) oleogels from 1 and 4 wt% CPI. Storage moduli are denoted with close symbols, while loss moduli are shown with open symbols.
 of the emulsions before and after heat treatment (Fig. 1C and D) and again in the corresponding oleogels (Fig. 4E). The increase in gel strength of the oleogels also improved their firmness. The stickiness of the oleogels could be due to the change in hydrophobic interactions or hydrogen bonding from the proteins. Yang et al.30 carried out the gel dissociation test to understand the interactions involved in the canola protein hydrogel. They had reported a sticky texture after the gel was immersed in urea for 48 h to disrupt the hydrogen bonds among the proteins.
 ), canola oil (
 ), 4 wt% CPI unheated emulsion (UE) oleogel (
 ) and 4 wt% CPI heated emulsion (HE) oleogel (
 ) as a function of (A) strain % and (B) frequency. Data for storage moduli (G′, close symbol) and loss moduli (G′′, open symbol) are shown. (C) Viscosity of the cake batters made with different fats as a function of shear rate.