 Open Access Article
Unsymmetrical pentamethine cyanines for visualizing physiological acidities from the whole-animal to the cellular scale with pH-responsive deep-red fluorescence†
Yicheng Wang‡
a,
Zuhai Lei‡a,
Cong Wanga,
Chong Caoa,
Jiayi Hua,
Ling Du*b,
Limei Han*a and
Cong Li *a
*a
aMinhang Hospital and Key Laboratory of Smart Drug Delivery, Ministry of Education, School of Pharmacy, Fudan University, Zhangheng Road 826, Shanghai, 201203, China. E-mail: congli@fudan.edu.cn
bKey Laboratory of Digestive Cancer Full Cycle Monitoring and Precise Intervention of Shanghai Municipal Health Commission, Minhang Hospital, Fudan University, Xingsong Road 170, Shangha, 201100, China
First published on 20th May 2021
Abstract
Acidity plays an important role in numerous physiological and pathological events. Non-invasively monitoring pH dynamics would be valuable for understanding pathological processes and optimizing therapeutic strategies. Although numerous near-infrared (NIR) fluorophores have been developed to monitor acidification in vivo, the experimental results are difficult to verify at the molecular or cellular level using a fluorescence microscope or flow cytometer due to the lack of lasers with excitation wavelengths in the NIR wavelength range. This work presents a sequential condensation strategy for obtaining unsymmetrical pentamethine cyanines with fine-tuned pKa values and improved yields. These deep-red fluorophores with pH responsiveness can not only be used to monitor acidification in live cells using confocal microscopic imaging and flow cytometry, but they can also be used to non-invasively identify infected tissue with a low pH value in live mouse models. In addition, the acidity in infected tissue slices was verified under a conventional confocal microscope. Overall, this work demonstrates a new synthetic method with improved yields for unsymmetrical pentamethine cyanines that can report acidity. These pH-responsive deep-red fluorophores not only provide new tools for accessing pH-associated physiological and pathological events, but they can also help in understanding in vivo imaging results at the molecular or cellular level due to their detectability by multiple imaging instruments.
Introduction
Acidity plays important roles in numerous physiological and pathological events. For example, acidification accompanies the maturity of intracellular organelles such as lysosomes and autophagosomes in normal cells.1 Additionally, due to the reprogramming of glucose metabolism from oxidative phosphorylation to glycolysis in cancer cells, the acidification of the extracellular matrix is considered to be a hallmark of solid tumors regardless of their phenotypes or genotypes.2 Acidity plays important roles in developing the tumor microenvironment. For instance, extracellular acidification suppresses immune responses by promoting the phenotypic transition of macrophages and deactivating the effective T cells.3 Furthermore, a temporal and spatial correlation was demonstrated between extracellular acidity and tissue malignancy in tumor invasive margins.4,5 Therefore, non-invasively monitoring pH dynamics in live cells, small animals and excised tissues would not only provide indispensable information for accessing the physiological and pathological processes, but also benefit therapeutic responses via intra-operative delineation of tumor invasive margins during surgery6,7 and guiding immune checkpoint therapy by evaluating the immune microenvironment in advance.8Fluorescent probes have emerged as an essential tool in monitoring pH with high sensitivity, accuracy and safety.9 Fluorescence in the near-infrared region (NIR) (700–1700 nm) is preferable for in vivo imaging studies due to the deep tissue penetration and minimum background noise.10,11 Although NIR fluorescent probes show advantages for in vivo imaging studies, their fluorescence signals are difficult to detect in cell cultures and ex vivo tissue samples using conventional confocal fluorescence microscopy and flow cytometry due to the lack of lasers with wavelengths in the NIR range.12 The above challenge makes it difficult to verify in vivo experimental results from NIR fluorescent probes at the cellular and molecular levels via ex vivo or in vitro imaging studies. Deep-red fluorophores with absorption and emission wavelengths in the range of 620–680 nm have attracted attention because they show high tissue penetration depth and can be excited by He–Ne lasers (633 nm), which are widely equipped in confocal fluorescence microscopes and flow cytometers.13 However, only a few deep-red fluorophores have been reported to sense physiologic acidity.14,15 As pH responsive deep-red fluorophores, unsymmetrical pentamethine cyanines can visualize physiologic acidity with high molar extinction coefficients, good photophysical stabilities and satisfactory quantum yields.16,17 However, current synthetic strategies for unsymmetrical pentamethine cyanines suffer from unsatisfactory overall yield16,18 and inconvenience in adjusting their pKa values. Additionally, it is also difficult to covalently conjugate these cyanine fluorophores to targeting biomolecules or polymers. Therefore, strategies for the development of unsymmetrical pentamethine cyanines with improved yields, tuneable pKa value and conjugation ability are urgently needed.
In this work, we report a sequential condensation strategy for unsymmetrical pentamethine cyanines with improved yields as high as 42%. Using this strategy, a series of unsymmetrical pentamethine cyanine derivatives, DR1–6, with pKa values of 6.8–7.4 were synthesized (Scheme 1). Their photophysical properties as a function of pH were first investigated. The fluorophore DR1 with a pKa of 7.0 was then selected and successfully used to monitor pH fluctuations in the cytoplasm of live cells via both a fluorescence microscope and flow cytometer. DR1 non-invasively visualized infection-induced tissue acidity in the mouse abdomen via in vivo fluorescence imaging. Furthermore, ex vivo fluorescence microscopic images verified the infection-induced acidification in the excised intestinal and peritoneum tissues. In addition, the carboxyl-group-modified in DR1 provides convenience for labelling proteins, nanoparticles or other functional macromolecules.
 | ||
| Scheme 1 The chemical structures of the unsymmetrical pentamethine cyanines upon protonation and deprotonation. | ||
Results and discussion
Synthesis of unsymmetrical pentamethine cyanines DR1–6
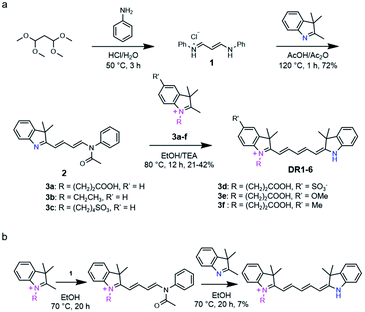
The general synthetic route of DR1–6 is shown in Scheme 2a. The probes were developed via the condensation of malonaldehyde bis(phenylimine) with two different indole derivatives. To optimize the overall yield, different reaction conditions, such as the use of toluene/n-butyl alcohol, acetic anhydride/sodium acetate and ethanol/triethylamine, were tested. The results demonstrated that the ethanol/triethylamine combination is superior to the others.Interestingly, we found that the reaction sequence was critical to the yields of the unsymmetrical cyanines. 2,3,3-Trimethyl-3H-indole first reacted with 1 to give intermediate 2, which further reacted with N-substituted indoles 3a–f to afford the final products DR1–6. In this way, the desired products were obtained with higher overall yields (42%) compared to that (yield: 7%) obtained using the adverse condensation sequence reported by Clear et al.19 (Scheme 2b). This experimental result can be attributed to the different reactivities of N-substituted and non-N-substituted indoles. The electron-withdrawing quaternary ammonium could enhance the reactivity of the 2-methyl on the indole salts in comparison to that of non-N-substituted indoles. Therefore, the indole salts (3a–f) could react with intermediates 2 more effectively than the non-N-substituted indoles (Scheme 2b).
Photophysical properties of DR1–6
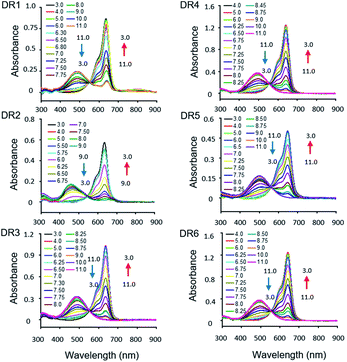
The photophysical parameters of DR1–6 are summarized in Table 1. The pH-dependent absorption and emission of the fluorophores were measured in phosphate buffers (PBS) with different pH values. In the UV-vis absorption spectra of DR1–6, two major absorption bands were observed (Fig. 1). As the pH was increased, the absorption at 630–650 nm diminished but the absorption at 460–500 nm increased, indicating a conversion between the protonated state (I) and deprotonated state (II) of these fluorophores (Scheme 1, Fig. S1†). The pH-dependent emission spectra and relative fluorescence intensity variation of DR1–6 are shown in Fig. 2. Strong fluorescence intensity was found under acidic conditions for all fluorophores, and decreased gradually with increasing pH. The signal “ON” state of the non-N-alkylated unsymmetrical pentamethine cyanines in acid conditions can be explained by an electron push–pull resonance effect between the two indole rings.20 The abstraction of the proton from the indole rings destroys this resonance and leads to a non-fluorescent form.21 This pH response mechanism was verified by 1H NMR (Fig. S1†) using DR6 as an example.| Comp. | λAbs(max-OH)/nm | λAbs(max-H)/nm | λEm/nm | ΔλST/nm | pKa | Φfl |
|---|---|---|---|---|---|---|
| a λAbs(max-OH) and λAbs(max-H) are the absorption maxima of the alkaline and acidic forms, respectively. λEm is the emission maximum. ΔλST is the Stokes shift. Φfl is the quantum yield.b Fluorescence quantum yields of compounds under acidic conditions (pH 4.0, PBS).c Fluorescence quantum yields of compounds in a physiological environment (pH 6.75, PBS). | ||||||
| DR1 | 486 | 637 | 661 | 24 | 7.01 | 0.29b |
| 0.17c | ||||||
| DR2 | 463 | 635 | 658 | 23 | 6.80 | 0.18b |
| 0.10c | ||||||
| DR3 | 488 | 636 | 660 | 24 | 7.34 | 0.19b |
| 0.14c | ||||||
| DR4 | 475 | 635 | 661 | 26 | 6.99 | 0.20b |
| 0.18c | ||||||
| DR5 | 500 | 647 | 677 | 30 | 7.31 | 0.04b |
| 0.02c | ||||||
| DR6 | 497 | 641 | 667 | 26 | 7.41 | 0.19b |
| 0.09c | ||||||
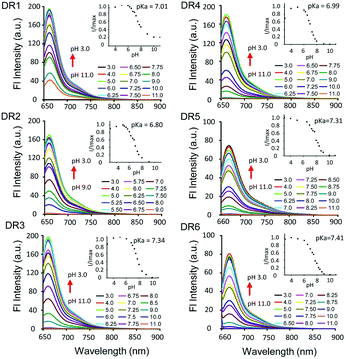 | ||
| Fig. 2 Fluorescence spectra of DR1–6 (1 × 10⁻⁶ M, DMSO/PBS = 1/1000) as a function of the pH value. The insets show the pH-dependent intensity variations. | ||
We performed density functional theory (DFT) calculations at the B3LYP/6-31 G(d,p) level to study the mechanism of the photophysical changes upon acidification (Fig. 3). In the protonated form, the π electrons of the HOMO are located over the whole π-conjugated chain, but the LUMO is mainly positioned at the center of the conjugated polymethine, where the bond length alternation (BLA) is minimal. This electron delocalization pattern in the HOMO/LUMO is a classic feature of cyanine dyes. In the deprotonated form, the π electrons on the HOMO and LUMO are mainly located on the π-conjugated polymethine and conjugated polymethine-indole, respectively. In other words, the deprotonated molecule loses its “cyanine limit” structure, which is characterized by a sharp and intense absorption in the NIR region. Additionally, the energy gap between the HOMO and LUMO is much smaller for the protonated structure, consistent with its long-wavelength absorption and emission spectra.22
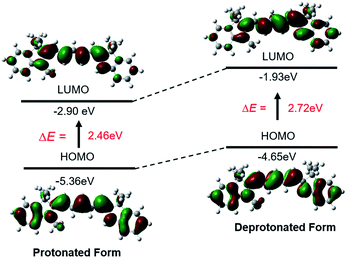 | ||
| Fig. 3 Theoretical calculations of the photophysical properties of the unsymmetrical pentamethine cyanine dye in its protonated and deprotonated forms. | ||
For DR1–3, the R′ group at the 5′ position of the indole was fixed as hydrogen, and the R group was an N-substituted alkyl chain with a terminal group such as carboxylic acid or sulfonic acid. Their absorption and emission spectra were not affected by the substituent at the terminal of the N-alkyl chain. A bathochromic shift of about 16 nm was observed with electron-donating substitution on the indole moiety by comparison in the spectra of DR4–6, in which the R group was fixed as N-substituted alkyl chain with a terminal carboxyl group and the R′ groups were groups with different electron-donating capabilities. Time-dependent density functional theory (TDDFT) calculations at the B3LYP/6-311 G(d,p) level were performed to study the photophysical properties of all the fluorophores. Schematic drawings of the HOMO and LUMO orbitals, the excitation energies and the corresponding absorption wavelength of DR1–6 are shown in Fig. S1† and Table S1†. The TDDFT studies indicated that the HOMO–LUMO energy gaps of DR5 and DR6 were higher than that of DR1, which is in good agreement with the observation that the absorption wavelengths of DR5 and DR6 are larger than that of DR1. The oscillator strength of DR5 was lower than those of other fluorophores, which may explain the significant reduction of its quantum yield. The calculated absorption maxima of the deprotonated dyes were consistent with the experimental data. However, the calculated absorption maxima of the protonated dyes were shorter than those obtained experimentally. TDDFT calculations may underestimate excitation or emission wavelengths due to the limitations of the exchange-correlation functional.23,24
The pKa values of DR1–6 are shown in Fig. 2. The pKa value of DR1 was determined to be 7.01. DR2 and DR3 with ethyl and butyl sulfonic acid substitution showed pKa values of 6.80 and 7.34, respectively. It appears that these functional groups affect the space charge distribution and hence the pKa of the fluorophores.20 The sulfo group served as a water-soluble group and did not affect the pKa value (DR4). DR5 and DR6 with electron-donating group substitution showed increased pKa values of 7.31 and 7.41, respectively. These results indicated that the pKa values of the unsymmetrical pentamethine cyanines can be fine-tuned by ingeniously introducing functional groups on an indole moiety.
DR1 for imaging intracellular acidity in live cancer cells
Since DR1 had the highest quantum yield and an appropriate pKa, we then employed DR1 as a fluorescent pH probe for cell culture studies under confocal laser scanning microscopy. The cytotoxicity of DR1 towards HeLa cells was first determined using a Cell Counting Kit-8 (CCK-8) assay (Fig. S4†). The relative viabilities of the HeLa cells were above 90% with probe concentrations of up to 50 μM, indicating the low cytotoxicity and good biocompatibility of DR1. The selectivity of DR1 was examined in the presence of various other coexisting species to determine the potential interference under physiological conditions. As shown in Fig. S5,† the fluorescence intensity in pH 4.0 PBS increased approximately 3-fold in comparison to that in pH 7.0 PBS. However, no significant variations in the fluorescence signal intensity were observed in the presence of potential interferents (NH4+, Co2+, Ca2+, Mg2+, Fe2+, Fe3+, H2O2, glucose, glutathione and cysteine), except for Cu2+. Cu2+ may oxidize the unsaturated bonds and hence attenuate the fluorescence intensity. Considering the intracellular concentration of free Cu2+ (10−18 M),23 which is far below the tested concentration (200 μM), its potential disruption to the pH-responsive fluorescence should be minimal. The performance of DR1 for monitoring the intracellular acidity in live cells was investigated. HeLa cells were incubated with DR1 (10 μM) for 12 h. The medium was then replaced with high-K+ buffers with different pH values.24 As shown in Fig. 4a, the fluorescence intensity decreased proportionally as the pH value was increased from 5.0 to 8.0. The mean intensities at different pH values in the cells were further quantified using flow cytometry (Fig. 4b, c). DR1 exhibited pH-responsive fluorescence behavior in live cells with a good linear relationship in the range of pH 5.0–8.0. The above results confirm that DR1 can be used to monitor pH changes in cell cultures under a fluorescence microscope.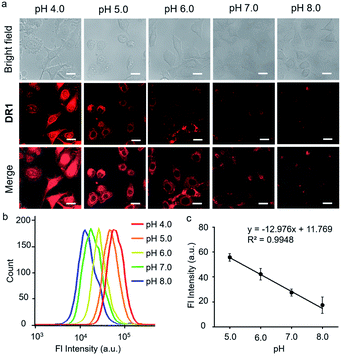 | ||
| Fig. 4 (a) Bright field, fluorescence, and merged images of HeLa cells treated with DR1 at pH 4.0, 5.0, 6.0, 7.0, and 8.0 (Ex: 633 nm), scale bar = 20 μm. (b) Flow cytometry of HeLa cells treated with DR1 at pH 4.0, 5.0, 6.0, 7.0, and 8.0. (c) The linear relationship between the fluorescence intensity and pH from the data in Fig. 3b. Error bars represent the mean standard deviation (S.D.), n = 3. | ||
DR1 for visualizing infection-induced acidity in mouse models and excised tissue sections
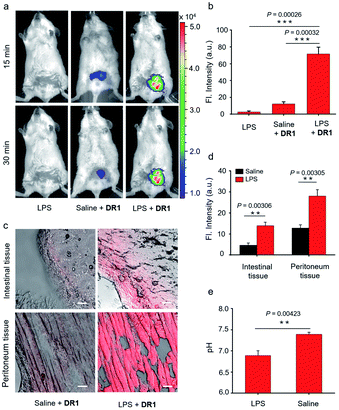
Encouraged by the in vitro imaging studies, we further evaluated the use of DR1 for visualizing pH changes in infection-associated animal models that were developed by intraperitoneally injecting lipopolysaccharide (LPS, 10 mg kg−1). Acute inflammatory symptoms such as tissue acidification have been reported after LPS administration.15,25 The mouse infection models were randomly divided into two groups. One group was used as a negative control without the administration of DR1. The other group was injected intraperitoneally with DR1 at 5 h post administration of LPS. Additionally, a group of normal mice were treated with DR1 as the positive control. As shown in Fig. 5a, the abdomens of the mouse models treated with LPS alone showed almost no fluorescence. In contrast, the mice treated with LPS followed by DR1 exhibited significantly higher fluorescence intensity than those of the healthy mice treated with DR1. Quantitative studies revealed that the fluorescence intensity in the abdomen increased approximately 7-fold in comparison with that of the normal mice (Fig. 5b, S6†). Importantly, acidity-triggered fluorescence enhancement in the infected tissues excised from the models was successfully observed under laser confocal microscopy. As shown in Fig. 5c and d, both the intestinal and peritoneum tissues of the LPS-treated animals exhibited significantly higher fluorescence intensity than those treated with PBS alone, which is consistent with the in vivo results. Notably, both the in vivo and ex vivo results based on DR1 fluorescence imaging were in good agreement with the pH values (6.60–6.90) of the intraabdominal tissue fluids measured using a pH meter (Fig. 5e). Collectively, these results clearly demonstrated that DR1 can verify the tissue acidification observed in an in vivo animal study at the excised tissue and cell scales.Conclusions
In summary, we developed a series of deep-red emissive and pH-sensitive fluorophores, DR1–6, using a sequence-dependent synthesis strategy. The pKa values of these fluorophores can be finely modulated via introducing selected substituents on the indole moiety. Compared with NIR fluorescent probes, these deep-red fluorophores not only provide new tools for imaging pH-associated physiological and pathological events, but they also help in the understanding of events observed under in vivo conditions at the molecular or cellular level due to their visibility using a conventional fluorescence microscope and flow cytometer.Experimental section
General information
All chemical reagents and solvents for probe synthesis were obtained from Adamas Reagent Co. Ltd. unless otherwise specified. 1-(2-Carboxyethyl)-5-methoxy-2,3,3-trimethyl-3H-indole and 1-(2-carboxyethyl)-5-methyl-2,3,3-trimethyl-3H-indole were purchased from Meryer Co. Ltd. Culture media, fetal bovine serum (FBS), trypsin, penicillin and streptomycin were purchased from Thermo-Fisher Scientific Inc. Cell Counting Kit-8 (CCK-8) was supplied by Yeasen (China). 1H and 13C NMR spectra were recorded using a 400 MHz (Varian, USA) or 600 MHz (Bruker, USA) NMR spectrometer. High resolution electron spray ionization (HR-ESI) mass spectra were obtained using a Q-TOF 2 (Micromass, USA) or AB 5600+ Q-TOF mass spectrometer (AB Sciex, USA). All pH measurements were performed using a Mettler Toledo (Switzerland) MP220 pH meter. An Inlab Micro Pro-ISM electrode was employed to measure the pH values in vivo. Absorption spectra were obtained using a SHIMADZU (Japan) UV-2550 spectrophotometer. Fluorescence spectra were collected using a SHIMAZDU (Japan) RF-5301 PC fluorophotometer. Fluorescence microscopy images were obtained using a Leica (Germany) DMI4000D inverted microscope and a Zeiss (Germany) LSM 710 confocal microscope. Flow cytometric studies were analyzed using a BD (USA) FACSAria II flow cytometer. Small animal imaging was acquired in an IVIS Spectrum In Vivo Imaging System (Caliper Life Sciences, USA).Photospectroscopic studies
Stock solutions of DR1–6 were prepared in dimethyl sulfoxide (DMSO) with a concentration of 1 × 10⁻³ M.
 | (1) |
Calculations of pKa values
The fluorescence quantum yields were determined using Rhodamine B26 as a standard and calculated according to eqn (2):
 | (2) |
Synthesis of DR1–6
![[thin space (1/6-em)]](https://www.rsc.org/images/entities/char_2009.gif) :
:![[thin space (1/6-em)]](https://www.rsc.org/images/entities/char_2009.gif) acetic anhydride = 1
acetic anhydride = 1![[thin space (1/6-em)]](https://www.rsc.org/images/entities/char_2009.gif) :
:![[thin space (1/6-em)]](https://www.rsc.org/images/entities/char_2009.gif) 1, v/v), and the solution was refluxed with stirring under argon for 1 hour at 120 °C. The mixture was cooled and diluted with ethyl acetate. The resulting solution was extracted with saturated Na2CO3 aqueous solution, and the organic phase was dried over Na2SO4, filtered and evaporated. The residue was purified by column chromatography on silica gel with CH2Cl2 to obtain product 2 as a yellow solid (3 g, 72% yield).
1, v/v), and the solution was refluxed with stirring under argon for 1 hour at 120 °C. The mixture was cooled and diluted with ethyl acetate. The resulting solution was extracted with saturated Na2CO3 aqueous solution, and the organic phase was dried over Na2SO4, filtered and evaporated. The residue was purified by column chromatography on silica gel with CH2Cl2 to obtain product 2 as a yellow solid (3 g, 72% yield).In vitro studies
In vivo studies
Conflicts of interest
There are no conflicts to declare.Acknowledgements
This work was supported by the National Natural Science Foundation of China (No. 81771895, 21908030), the National Science Fund for Distinguished Young Scholars (822025019), and the Program of Shanghai Science and Technology Committee (No. 19431900400, 18441900600 and 20S31903700).Notes and references
- J. R. Casey, S. Grinstein and J. Orlowski, Nat. Rev. Mol. Cell Biol., 2010, 11, 50–61 CrossRef CAS PubMed.
- R. J. Gillies, Z. Liu and Z. Bhujwalla, Am. J. Physiol., 1994, 267, C195–C203 CrossRef CAS PubMed.
- H. Sekine, M. Yamamoto and H. Motohashi, Nat. Immunol., 2018, 19, 1281–1283 CrossRef CAS PubMed.
- V. Estrella, T. Chen, M. Lloyd, J. Wojtkowiak, H. H. Cornnell, A. Ibrahim-Hashim, K. Bailey, Y. Balagurunathan, J. M. Rothberg, B. F. Sloane, J. Johnson, R. A. Gatenby and R. J. Gillies, Cancer Res., 2013, 73, 1524–1535 CrossRef CAS PubMed.
- W. Duan, Q. Yue, Y. Liu, Y. Zhang, Q. Guo, C. Wang, S. Yin, D. Fan, W. Xu, J. Zhuang, J. Gong, X. Li, R. Huang, L. Chen, S. Aime, Z. Wang, J. Feng, Y. Mao, X.-Y. Zhang and C. Li, Chem. Sci., 2020, 11, 4397–4402 RSC.
- L. Han, W. Duan, X. Li, C. Wang, Z. Jin, Y. Zhai, C. Cao, L. Chen, W. Xu, Y. Liu, Y.-Y. Bi, J. Feng, Y. Mao, Q. Yue, X.-Y. Zhang and C. Li, ACS Appl. Mater. Interfaces, 2019, 11, 15241–15250 CrossRef CAS PubMed.
- X. Gao, Q. Yue, Z. Liu, M. Ke, X. Zhou, S. Li, J. Zhang, R. Zhang, L. Chen, Y. Mao and C. Li, Adv. Mater., 2017, 29, 1603917 CrossRef PubMed.
- S. A. Patel and A. J. Minn, Immunity, 2018, 48, 417–433 CrossRef CAS PubMed.
- J. Han and K. Burgess, Chem. Rev., 2010, 110, 2709–2728 CrossRef CAS PubMed.
- Z. Guo, S. Park, J. Yoon and I. Shin, Chem. Soc. Rev., 2014, 43, 16–29 RSC.
- J. Zhang, Z. Liu, P. Lian, J. Qian, X. Li, L. Wang, W. Fu, L. Chen, X. Wei and C. Li, Chem. Sci., 2016, 7, 5995–6005 RSC.
- A. Ramesh, S. Kumar, A. Brouillard, D. Nandi and A. Kulkarni, Adv. Mater., 2020, 32, e2000648 CrossRef PubMed.
- A. G. White, B. D. Gray, K. Y. Pak and B. D. Smith, Bioorg. Med. Chem. Lett., 2012, 22, 2833–2836 CrossRef CAS PubMed.
- J. E. Mathejczyk, J. Pauli, C. Dullin, U. Resch-Genger, F. Alves and J. Napp, J. Biomed. Opt., 2012, 17, 076028 CrossRef PubMed.
- Y. Li, Y. Wang, S. Yang, Y. Zhao, L. Yuan, J. Zheng and R. Yang, Anal. Chem., 2015, 87, 2495–2503 CrossRef CAS PubMed.
- V. Wycisk, K. Achazi, P. Hillmann, O. Hirsch, C. Kuehne, J. Dernedde, R. Haag and K. Licha, ACS Omega, 2016, 1, 808–817 CrossRef CAS PubMed.
- F. Xue, Y. Wen, P. Wei, Y. Gao, Z. Zhou, S. Xiao and T. Yi, Chem. Commun., 2017, 53, 6424–6427 RSC.
- S. A. Hilderbrand, K. A. Kelly, M. Niedre and R. Weissleder, Bioconjugate Chem., 2008, 19, 1635–1639 CrossRef CAS PubMed.
- K. J. Clear, K. Virga, L. Gray and B. D. Smith, J. Mater. Chem. C, 2016, 4, 2925–2930 RSC.
- M. E. Cooper, S. Gregory, E. Adie and S. Kalinka, J. Fluoresc., 2002, 12, 425–429 CrossRef CAS.
- M. S. Briggs, D. D. Burns, M. E. Cooper and S. J. Gregory, Chem. Commun., 2000, 2323–2324, 10.1039/b007108k.
- X. Yin, K. Liu, Y. Ren, R. A. Lalancette, Y. L. Loo and F. Jakle, Chem. Sci., 2017, 8, 5497–5505 RSC.
- E. Gaggelli, H. Kozlowski, D. Valensin and G. Valensin, Chem. Rev., 2006, 106, 1995–2044 CrossRef CAS PubMed.
- M. Tafani, J. A. Cohn, N. O. Karpinich, R. J. Rothman, M. A. Russo and J. L. Farber, J. Biol. Chem., 2002, 277, 49569–49576 CrossRef CAS PubMed.
- C. R. Raetz and C. Whitfield, Annu. Rev. Biochem., 2002, 71, 635–700 CrossRef CAS PubMed.
- R. A. Velapoldi and H. H. Tonnesen, J. Fluoresc., 2004, 14, 465–472 CrossRef CAS PubMed.
- D. S. Pisoni, L. Todeschini, A. C. Borges, C. L. Petzhold, F. S. Rodembusch and L. F. Campo, J. Org. Chem., 2014, 79, 5511–5520 CrossRef CAS PubMed.
- C. Bouteiller, G. Clave, A. Bernardin, B. Chipon, M. Massonneau, P. Y. Renard and A. Romieu, Bioconjugate Chem., 2007, 18, 1303–1317 CrossRef CAS PubMed.
- J. Cao, J. Chi, J. Xia, Y. Zhang, S. Han and Y. Sun, ACS Appl. Mater. Interfaces, 2019, 11, 25720–25729 CrossRef CAS PubMed.
- S. P. Gromov, M. V. Fomina, A. S. Nikiforov, A. I. Vedernikov, L. G. Kuz'mina and J. A. K. Howard, Tetrahedron, 2013, 69, 5898–5907 CrossRef CAS.
Footnotes |
| † Electronic supplementary information (ESI) available. See DOI:10.1039/d1ra02217b |
| ‡ These authors contributed equally to this work. |
| This journal is © The Royal Society of Chemistry 2021 |

