 Open Access Article
Creative Commons Attribution 3.0 Unported Licence
A highly efficient rod-like-CeO2-supported palladium catalyst for the oxidative carbonylation of glycerol to glycerol carbonate
Ziyan Wanga,
Shuo Guob,
Zhimiao Wang *ab,
Fang Liab,
Wei Xue
 *ab and
Yanji Wang
 abc
abc
aHebei Provincial Key Laboratory of Green Chemical Technology and High Efficient Energy Saving, School of Chemical Engineering and Technology, Hebei University of Technology, Tianjin 300130, China. E-mail: weixue@hebut.edu.cn; wangzhimiao@hebut.edu.cn
bTianjin Key Laboratory of Chemical Process Safety, Tianjin 300130, China
cHebei Industrial Technology Research Institute of Green Chemical Industry, Huanghua 061100, Hebei, China
First published on 10th May 2021
Abstract
A rod-like-CeO2-supported Pd catalyst (Pd/CeO2-r) was prepared using two-step hydrothermal impregnation and used in the oxidative carbonylation of glycerol to produce glycerol carbonate. The characterization results showed that the Pd was highly dispersed on the surface of the CeO2-r, and metallic Pd was the main species in the catalyst. The Pd/CeO2-r exhibited good catalytic performance for the oxidative carbonylation of glycerol. Under optimized reaction conditions, the glycerol conversion and glycerol carbonate selectivity were 93% and 98%, respectively, and turnover frequency was 1240 h−1. However, because of the leaching of Pd and the growth of Pd particles, the catalyst was gradually deactivated throughout reuse.
1 Introduction
In recent years, concerns about global warming have resulted in increased interest in the biodiesel industry as a source of renewable energy.1 However, during the manufacture of biodiesel, a large quantity of glycerol (GL) is produced as a by-product.2 For every 10 tons of biodiesel produced, approximately 1 ton of GL is produced. As biodiesel is produced on a large scale, the use of GL has become an important factor affecting the development of the biodiesel industry. GL can be converted into valuable chemicals by reaction, such as acrolein,3 glycerol ether,4 1,2-propanediol,5 lactic acid,6,7 and glycerol carbonate (GLC).8 GLC is an important derivative of GL with a high boiling point, high biodegradability, low flammability, and low toxicity. It can be used as a green solvent in the fields of paint, cosmetics, medicine, and lithium batteries. It can also be used as a raw material in the synthesis of surfactants, agrochemicals, and polymers.9,10 Therefore, much attention has been given to the synthesis of GLC.11 There are several methods for the synthesis of GLC from GL, including phosgenation,2 transesterification,12,13 urea alcoholysis,14,15 and the oxidative carbonylation of GL.16 The oxidative carbonylation of glycerol (OCG) is a highly efficient and attractive approach for obtaining GLC because of the high availability and low cost of CO and O2, and the high atom economy of the process.17 The reaction equation is shown in Scheme 1.The catalysts used for the OCG reaction include homogeneous and heterogeneous catalysts. Hu et al.17 explored a homogeneous PdCl2(phen)/KI (phen = 1,10-phenanthroline) catalyst system for the OCG reaction. GL conversion was 92%, GLC selectivity was 99%, and the turnover frequency (TOF) reached 184 h−1. Casiello et al. studied the homogeneous OCG reaction using CuCl2 as a catalyst and pyridine as a co-catalyst.16 Excellent conversions (>92%) and selectivities (>93%) were obtained, and it was found that Cu+ is the intermediate species in the catalytic cycle. Because of the inherent disadvantages of homogeneous catalysts, such as the difficulty in separation and recovery of catalysts, heterogeneous catalysts have been attracting increasing attention. Hu et al.18 developed a zeolite-Y-confined Pd catalyst (PdCl2(phen)@Y) for the OCG reaction. This heterogeneous catalyst exhibited a high activity, with a reasonable GL conversion of 95%, GLC selectivity of 98%, and a TOF of 317 h−1. The catalyst could be reused five times without a significant decrease of the catalytic activity. Wang et al.19 studied a commercially available Pd/C catalyst for GLC synthesis via the OCG reaction with the aid of NaI. Under the optimum conditions, a TOF of 900 h−1 was obtained. Lei et al.8 reported Pd@PQP-NHC as a recyclable catalyst for the OCG reaction. It could afford 96% conversion of GL with a high TOF of 1901 h−1.
The oxidative carbonylation reaction involves electron transfer. Pd compounds are usually used as catalysts with various co-catalysts. Ceria, widely used in various oxidation reactions,20,21 exhibits a good promotion effect for Pd-catalyzed oxidative carbonylation because of its high oxygen adsorption capacity and good oxygen storage and release (Ce3+/Ce4+) performance. In our previous work,22 a Pd–Ce–O/SiO2 catalyst was prepared using a microemulsion method. The catalyst was used for the oxidative carbonylation of phenol to synthesize diphenyl carbonate (DPC). It was found that Ce4+ entered the PdO crystal lattice, which meant that the electrons of the deactivated Pd could easily be transferred to the Ce. Therefore, the Pd–Ce–O/SiO2 catalyst was easily regenerated and exhibited good performance. Yuan23 and Fu et al.24 studied the oxidative carbonylation of phenol to produce DPC over a Pd catalyst supported on CeO2 nanotubes. This catalyst exhibited excellent performance. They also found that the morphology of the CeO2 had a significant effect on the performance of the catalyst. CeO2 can also be used as a catalyst for the carbonylation of GL with CO2 to produce GLC, as described in ref. 25. The GLC yield in this study was up to 78.9%, and the CeO2 catalyst could be regenerated simply by calcination after 5 cycles.
CeO2 is very important in the oxidative carbonylation reaction. However, as far as we know, CeO2 has not been used in the OCG reaction to produce GLC. In this paper, a rod-like-CeO2-supported palladium catalyst (Pd/CeO2-r) was prepared, and its performance in the OCG reaction was evaluated. The Pd/CeO2-r exhibited excellent catalytic performance with GL conversion of 93% and GLC selectivity of 98%. We also discuss the stability and catalytic mechanism of the Pd/CeO2-r catalyst.
2 Experimental
2.1 Experimental section chemicals
Polyethylene oxide–polypropylene oxide–polyethylene oxide block copolymer (P123) and glycerol were purchased from Sigma-Aldrich. CeCl3·7H2O, aqueous ammonia (28 wt%), absolute ethanol, PdCl2, and NaBH4 were purchased from Sinopharm Chemical Reagent Co., Ltd. NaI and dimethyl acetamide were purchased from Macklin. All chemicals were used without further purification.2.2 Catalyst preparation
P123 (17.4 g) was dissolved in a mixture of absolute ethanol (60 mL) and deionized water (60 mL) with ultrasonic treatment in a beaker. CeCl3·7H2O (5.58 g) was then added to the solution. With vigorous stirring, NH3·H2O (28 wt%) was added dropwise until the pH value of the solution was 10. The solution was then stirred for another 30 min. The resulting suspension was rapidly transferred into a polytetrafluoroethylene (PTFE)-lined stainless steel autoclave with a capacity of 200 mL, and hydrothermally treated at 160 °C for 72 h. After cooling to room temperature, the solid was separated by centrifugation and washed with water and ethanol until the filtrate was neutral. The resulting solid was then dried at 60 °C and calcined at 500 °C for 4 h with a heating rate of 5 °C min−1. Finally, a light-yellow powder, the rod-like CeO2, was obtained, and was denoted by CeO2-r.PdCl2 (0.018 g) was dissolved in a mixture of deionized water (10 mL) and NH3·H2O (28 wt%, 5 mL) with ultrasonic treatment. CeO2-r (0.36 g) was dispersed in deionized water (10 mL). Then the two mixtures were mixed together and stirred for 2 h. Next, NaBH4 solution (0.010 g NaBH4 dissolved in 10 mL H2O) was added dropwise into the mixture, which was stirred for 24 h. The solid was filtered and washed with ethanol and dried in a vacuum at 80 °C. Finally, the solid was calcined in a tube furnace at 300 °C under flowing nitrogen gas. The obtained catalyst was denoted by Pd/CeO2-r and had a nominal Pd loading of 3.0 wt%.
2.3 Catalyst characterization
Scanning electron microscope (SEM) of FEI Nova Nano SEM 450 type was carried out to observe the morphology of the catalyst particles. Transmission electron microscope (TEM) and selected area electron diffraction (SAED) were observed with PHILIPS TECNOL 20. X-ray diffraction (XRD) patterns were recorded on a Bruker D8 FOCUS X-ray diffractometer with Cu Kα radiation (40 kV) and a secondary beam graphite monochromator (SS/DS = 1°, RS 0.15 mm, counter SC) at the scanning 2θ range of 5°–90°. The specific surface areas of the samples were calculated by BET equation using N2 adsorption–desorption technique with a Micromeritics ASAP 2020M + C porosity analyzer. Thermo Scientific Escalab 250 Xi photoelectron spectrometer (14.6 kV, 200 W) with Al Kα (1486.6 eV) were used for X-ray photoelectron spectroscopy (XPS) and the number of scanning times was 20. The correction was performed with C 1s (284.8 eV). Pd content in the catalyst was determined by a Thermo Scientific iCAP 7400 Inductively Coupled Plasma-Optical Emission Spectroscopy (ICP-OES).2.4 Catalyst evaluation
The catalyst activity was evaluated in a stainless-steel autoclave of Amtech® Slurry Phase Reactor Systems with an inner volume of 50 mL. In a typical experiment, glycerol, Pd/CeO2-r catalyst, co-catalyst (NaI) and solvent (dimethyl acetamide, DMA) were added into the autoclave. Then the autoclave was sealed and pressurized with a mixture of O2 (1.7 MPa) and CO (3.3 MPa) and the temperature was heated to the desired value. After a period of time, the autoclave was cooled to room temperature and vented. The catalyst was separated by centrifugation, and the liquid phase was analyzed by gas chromatograph.The reaction products were identified quantitatively using an Agilent 7890B gas chromatograph with a KB-Wax capillary column (30 m × 0.32 mm × 0.50 μm) and a flame ionization detector. Column temperature started at 80 °C and was increased to 260 °C at a rate of 30 °C min−1. Nitrogen was used as the carrier gas. The quantitative analysis of the reaction products were carried out using n-butanol as internal standard.
After the OCG reaction, the Pd/CeO2-r catalyst was recovered by centrifugation, washed thoroughly with ethanol, and dried at 80 °C for 12 h. It was then reused directly in OCG reaction.
3 Results and discussion
3.1 Catalyst characterization
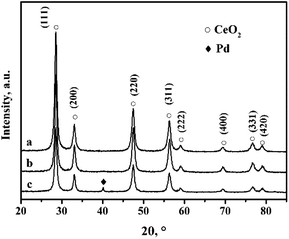
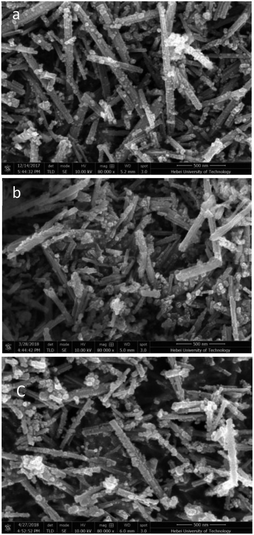
Fig. 1 shows the XRD (X-ray diffraction) patterns of the CeO2-r and Pd/CeO2-r. There are no obvious differences between the diffraction peak positions and strengths in the patterns of the two samples. The peaks at 2θ = 28.51°, 33.10°, 47.62°, 56.53°, 59.07°, 69.45°, 76.74°, and 79.21° are attributed to the (111), (200), (220), (311), (222), (400), (331), and (420) crystal planes of CeO2 with a cubic structure (JCPDS65-5923). Peaks corresponding to Pd metal or Pd compounds were not observed in the XRD patterns of the Pd/CeO2-r, which may be because a small amount of Pd species was highly dispersed on the CeO2.26,27The CeO2-r and Pd/CeO2-r were characterized using SEM (scanning electron microscopy) and TEM (transmission electron microscopy), and the images are shown in Fig. 2 and 3, respectively. Fig. 2(a) is the SEM image of the CeO2-r, which shows that most of the CeO2-r has a rod-like structure, with lengths from 300 nm to 2 μm, and diameters from 30 to 100 nm. Additionally, there are some small particles attached to the rods, with widths of less than 50 nm. The Pd/CeO2-r catalyst was prepared by loading Pd species on the CeO2-r, and its SEM image is shown in Fig. 2(b). It can be seen from the figure that the loading has a small effect on the morphology of the CeO2-r. Upon loading, although the rod structure remains dominant, the morphology becomes less regular and the length decreases.
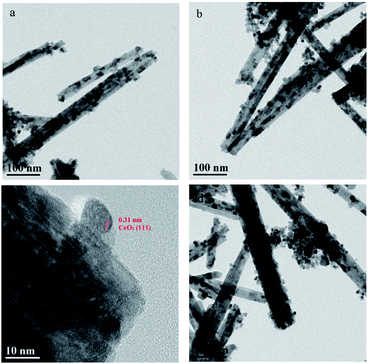
Fig. 3 shows the TEM images of the CeO2-r and Pd/CeO2-r, and the conclusions are similar to those drawn from the SEM images. Both samples comprise rod-like-shaped CeO2, with some small particles. Additionally, no obvious Pd species were observed in the Pd/CeO2-r. It is generally believed that most Pd particles on a CeO2 support cannot be observed, even using HR-TEM.28 This may be because the high electron density of CeO2 prevents Pd particles from being observed.29 An alternative explanation is that the strong interaction between Pd and CeO2 inhibits the growth of Pd particles,23 and smaller Pd particles cannot be easily observed using TEM. This is consistent with the XRD results.
The textural properties of the CeO2-r and Pd/CeO2-r were analyzed using N2 adsorption–desorption measurements at liquid N2 temperature. The results are shown in Table 1. After Pd loading, the surface area and pore volume of the CeO2-r decreased markedly, while the average pore size increased. This may be because the Pd species entered the CeO2-r pore channels and blocked some of the smaller pores, leaving larger pores open. Wu et al.30 obtained similar results when loading Pd species on CeO2 nanotubes.
3.2 Oxidative carbonylation of GL over the Pd/CeO2-r
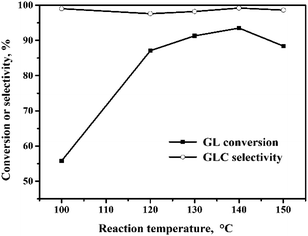
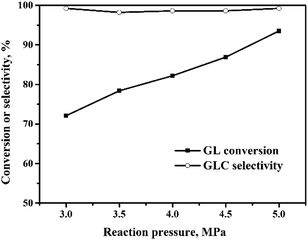
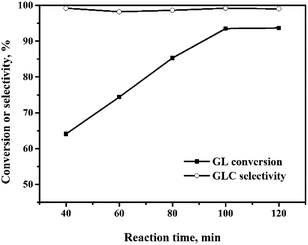
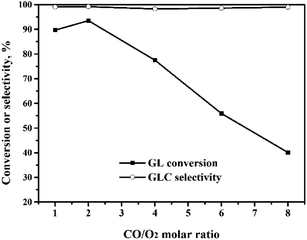
The oxidative carbonylation of GL over the Pd/CeO2-r to produce GLC was investigated, and the reaction conditions, including the reaction temperature, pressure, catalyst loading, CO/O2 ratio, and reaction time, were optimized.![[thin space (1/6-em)]](https://www.rsc.org/images/entities/char_2009.gif) :
:![[thin space (1/6-em)]](https://www.rsc.org/images/entities/char_2009.gif) 1 to 2
1 to 2![[thin space (1/6-em)]](https://www.rsc.org/images/entities/char_2009.gif) :
:![[thin space (1/6-em)]](https://www.rsc.org/images/entities/char_2009.gif) 1. Upon further increase of the CO/O2 molar ratio to 8
1. Upon further increase of the CO/O2 molar ratio to 8![[thin space (1/6-em)]](https://www.rsc.org/images/entities/char_2009.gif) :
:![[thin space (1/6-em)]](https://www.rsc.org/images/entities/char_2009.gif) 1, the GL conversion decreased quickly to 40%. Meanwhile, the GLC selectivity changed very little with the CO/O2 molar ratio. The role of O2 is to ensure that the Pd(0) ↔ Pd(II) cycle occurs, so that the OCG reaction catalyzed by the Pd species is a catalytic reaction. When the CO/O2 ratio is increased, the amount of O2 is decreased, which means that the in situ oxidation regeneration process, Pd(0) → Pd(II), is hindered.21 This means that the catalyst activity and the GL conversion decrease.
1, the GL conversion decreased quickly to 40%. Meanwhile, the GLC selectivity changed very little with the CO/O2 molar ratio. The role of O2 is to ensure that the Pd(0) ↔ Pd(II) cycle occurs, so that the OCG reaction catalyzed by the Pd species is a catalytic reaction. When the CO/O2 ratio is increased, the amount of O2 is decreased, which means that the in situ oxidation regeneration process, Pd(0) → Pd(II), is hindered.21 This means that the catalyst activity and the GL conversion decrease.
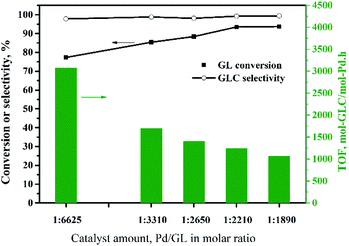
![[thin space (1/6-em)]](https://www.rsc.org/images/entities/char_2009.gif) :
:![[thin space (1/6-em)]](https://www.rsc.org/images/entities/char_2009.gif) GL molar ratio of 1
GL molar ratio of 1![[thin space (1/6-em)]](https://www.rsc.org/images/entities/char_2009.gif) :
:![[thin space (1/6-em)]](https://www.rsc.org/images/entities/char_2009.gif) 2210. Increasing the amount of catalyst further did not improve the GL conversion. Although increasing the amount of catalyst is beneficial to the reaction, too much solid catalyst affects the stirring efficiency and increases the mass transfer resistance. This has negative effects on the reaction. In other words, there is an optimal amount of catalyst. Additionally, the TOF decreased as the amount of catalyst was increased, and was 1240 h−1 at the maximum GL conversion, which was higher than those reported for most catalysts for this reaction (Table 2), except the Pd@PQP-NHC catalyst from the latest reports.8 For the smallest amount of catalyst used in this experiment, the GL conversion was 77%, and the TOF was 3075 h−1, which is the highest value observed in this experiment.
2210. Increasing the amount of catalyst further did not improve the GL conversion. Although increasing the amount of catalyst is beneficial to the reaction, too much solid catalyst affects the stirring efficiency and increases the mass transfer resistance. This has negative effects on the reaction. In other words, there is an optimal amount of catalyst. Additionally, the TOF decreased as the amount of catalyst was increased, and was 1240 h−1 at the maximum GL conversion, which was higher than those reported for most catalysts for this reaction (Table 2), except the Pd@PQP-NHC catalyst from the latest reports.8 For the smallest amount of catalyst used in this experiment, the GL conversion was 77%, and the TOF was 3075 h−1, which is the highest value observed in this experiment.
3.3 Catalyst stability
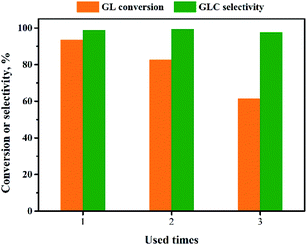
The reusability of the Pd/CeO2-r catalyst was examined. After the reaction, the catalyst was recovered by centrifugation, washed thoroughly with ethanol, and dried at 80 °C for 12 h. It was then re-evaluated for the OCG reaction to produce GLC; the results are shown in Fig. 9. The more times the catalyst had been reused, the lower the GL conversion. The GL conversion was 61% when the catalyst was used for the third time.To clarify the cause of the catalyst deactivation, the recovered Pd/CeO2-r catalyst was characterized using XRD, and the results are shown in Fig. 1(c). In addition to the diffraction peaks assigned to CeO2, a new diffraction peak is present at 40.15°. This corresponds to the (111) crystal plane of metallic Pd. This might be present as a result of the aggregation and growth of Pd particles during the reaction. The aggregated Pd would reduce the contact between the reactants and the active centers, thus reducing the activity of the catalyst.
The morphology of the recovered Pd/CeO2-r catalyst was observed using SEM and TEM, and the results are shown in Fig. 2(c) and 3(d), respectively. The images show that the morphologies of the catalyst before and after the reaction had no obvious differences, and the rod-like shape was maintained.
The Pd content in the Pd/CeO2-r catalyst was determined using ICP-OES (inductively coupled plasma optical emission spectrometry). The results showed that the Pd content was 2.0 wt% and 1.1 wt% in the fresh and recovered Pd/CeO2-r catalyst, respectively. Pd leaching during the reaction was also a cause of catalyst deactivation. Wang et al.19 studied the Pd/C catalyzed OCG reaction. They found that with the aid of NaI, Pd species first dissolved in solvents, and after a period of time, were deposited on the support, with less leaching. They also confirmed that the dissolved Pd species were active in the reaction. The leaching of Pd in our work was much higher than that reported by Wang et al.19 This may be because the CeO2-r support had a smaller specific surface area (31.6 m2 g−1) than that of the Pd/C used by Wang et al. (662.7 m2 g−1). A smaller specific surface area would not favor the re-deposition of Pd species.
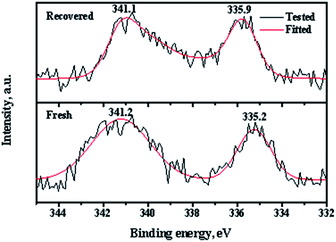
XPS (X-ray photoelectron spectroscopy) measurements of the fresh and recovered Pd/CeO2-r catalysts were used to determine the Pd state, and the results are shown in Fig. 10. There are two peaks in the spectrum of the fresh Pd/CeO2-r with binding energies of 341.2 eV and 335.2 eV, which correspond to the Pd 3d3/2 and Pd 3d5/2 states, respectively. These peaks are assigned to zero valent Pd species.31 This indicates that almost all the Pd species were reduced by NaBH4. After the reaction, the chemical state of the Pd on the recovered catalyst changed significantly. The binding energies of the Pd 3d peaks increased and the peaks became wider and asymmetric, which indicates the existence of Pd species with high valence. Wang et al.19 believed that some Pd(0) was oxidized to PdI2 during the OCG reaction. However, the change of the Pd valence was not the main reason for the Pd/CeO2-r catalyst deactivation, because Pd(II) is also active in the reaction.8,19 To demonstrate this, the PdCl2/CeO2-r catalyst, without reduction by NaBH4, was prepared and evaluated for the OCG reaction. Under the same conditions as those used for the highest conversion with the Pd/CeO2-r catalyst, the GL conversion was 82% and the GLC selectivity was 98% over the PdCl2/CeO2-r catalyst. This indicates that the activity of Pd(II) was slightly lower than that of Pd(0). Therefore, the main reason for the deactivation of the Pd/CeO2-r is the leaching of Pd species.
3.4 Proposed mechanism for the OCG reaction over Pd/CeO2-r
Based on the current understanding of the mechanism of Pd-catalyzed oxidative carbonylation19,23,32 and the experimental results in this paper, we propose a reaction mechanism for glycerol oxidative carbonylation over the Pd/CeO2-r catalyst, which is shown in Scheme 2. In this catalytic cycle, I− first reacts with O2 to form I2, and then Pd(0) is transformed into Pd2+ under the action of I2. Pd2+ is the active center for the OCG reaction. GLC is then formed from GL and CO, catalyzed by Pd2+, and Pd2+ is reduced to Pd(0) at the same time. Additionally, some Pd2+ is deposited on the CeO2-r support in the form of Pd(II) species. Finally, H+ and O2−, generated in the previous steps, react to form water to complete the catalytic cycle. Notably, the Pd(II) species redeposited on the support are also active in the OCG reaction – this is not indicated in the mechanism diagram. In addition, CeO2-r support can also promote the Pd-catalyzed OCG reaction. Oxygen can be adsorbed on the oxygen vacancy of CeO2-r surface and transformed into lattice oxygen O2−; at the same time, Ce3+ is oxidized to Ce4+, while Ce4+ can promote the conversion of Pd(0) generated in the reaction to Pd(II), thus regenerating the activity.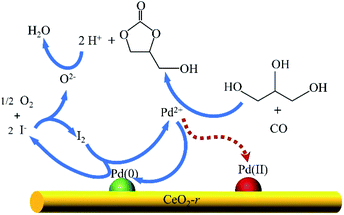 | ||
| Scheme 2 Proposed mechanism for the oxidative carbonylation of glycerol over the Pd/CeO2-r catalyst. | ||
To understand the heterogeneity of the Pd/CeO2-r catalyst, a hot filtration test was carried out under the optimized conditions (GL (25 mmol), Pd![[thin space (1/6-em)]](https://www.rsc.org/images/entities/char_2009.gif) :
:![[thin space (1/6-em)]](https://www.rsc.org/images/entities/char_2009.gif) GL = 1
GL = 1![[thin space (1/6-em)]](https://www.rsc.org/images/entities/char_2009.gif) :
:![[thin space (1/6-em)]](https://www.rsc.org/images/entities/char_2009.gif) 2210 (molar ratio), NaI (I−/Pd = 10
2210 (molar ratio), NaI (I−/Pd = 10![[thin space (1/6-em)]](https://www.rsc.org/images/entities/char_2009.gif) :
:![[thin space (1/6-em)]](https://www.rsc.org/images/entities/char_2009.gif) 1 in molar ratio), DMA (15 mL), CO (3.3 MPa), O2 (1.7 MPa), 140 °C). At first, the reaction was allowed to proceed for 30 min (GL conversion: 51%), after which the catalyst was separated carefully. And the rest of the liquid phase was refilled into the autoclave, which was then pressurized with CO and O2, and the reaction continued for another 70 min. The final GL conversion was 72%. The results show that, on the one hand, homogeneous Pd species do have catalytic effect on OCG reaction; on the other hand, the activity of homogeneous Pd is inferior to that of heterogeneous Pd/CeO2-r Catalysts, which is due to the promotion of CeO2-r support. That is to say, homogeneous and heterogeneous catalysis exist simultaneously in Pd catalyzed OCG reaction.
1 in molar ratio), DMA (15 mL), CO (3.3 MPa), O2 (1.7 MPa), 140 °C). At first, the reaction was allowed to proceed for 30 min (GL conversion: 51%), after which the catalyst was separated carefully. And the rest of the liquid phase was refilled into the autoclave, which was then pressurized with CO and O2, and the reaction continued for another 70 min. The final GL conversion was 72%. The results show that, on the one hand, homogeneous Pd species do have catalytic effect on OCG reaction; on the other hand, the activity of homogeneous Pd is inferior to that of heterogeneous Pd/CeO2-r Catalysts, which is due to the promotion of CeO2-r support. That is to say, homogeneous and heterogeneous catalysis exist simultaneously in Pd catalyzed OCG reaction.
4 Conclusion
CeO2 with a rod-like structure (CeO2-r) was prepared via a hydrothermal method, using P123 as a morphology control agent. It was then used as a support for the Pd/CeO2-r catalyst for the oxidative carbonylation of glycerol to produce glycerol carbonate. The Pd/CeO2-r catalyst was characterized and evaluated. The optimized reaction conditions were: glycerol (25 mmol), Pd![[thin space (1/6-em)]](https://www.rsc.org/images/entities/char_2009.gif) :
:![[thin space (1/6-em)]](https://www.rsc.org/images/entities/char_2009.gif) glycerol = 1
glycerol = 1![[thin space (1/6-em)]](https://www.rsc.org/images/entities/char_2009.gif) :
:![[thin space (1/6-em)]](https://www.rsc.org/images/entities/char_2009.gif) 2210 (molar ratio), NaI (I−/Pd molar ratio = 10
2210 (molar ratio), NaI (I−/Pd molar ratio = 10![[thin space (1/6-em)]](https://www.rsc.org/images/entities/char_2009.gif) :
:![[thin space (1/6-em)]](https://www.rsc.org/images/entities/char_2009.gif) 1), DMA (15 mL), CO (3.3 MPa), O2 (1.7 MPa), 100 min, and 140 °C. Under the optimized reaction conditions, the glycerol conversion and glycerol carbonate selectivity were 93% and 98%, respectively, and the TOF was 1240 h−1. When the amount of catalyst was reduced so that the Pd
1), DMA (15 mL), CO (3.3 MPa), O2 (1.7 MPa), 100 min, and 140 °C. Under the optimized reaction conditions, the glycerol conversion and glycerol carbonate selectivity were 93% and 98%, respectively, and the TOF was 1240 h−1. When the amount of catalyst was reduced so that the Pd![[thin space (1/6-em)]](https://www.rsc.org/images/entities/char_2009.gif) :
:![[thin space (1/6-em)]](https://www.rsc.org/images/entities/char_2009.gif) glycerol molar ratio was 1
glycerol molar ratio was 1![[thin space (1/6-em)]](https://www.rsc.org/images/entities/char_2009.gif) :
:![[thin space (1/6-em)]](https://www.rsc.org/images/entities/char_2009.gif) 6625, the TOF was as high as 3075 h−1, and the glycerol conversion and glycerol carbonate selectivity were 77% and 99%, respectively. As the number of times the Pd/CeO2-r catalyst was reused was increased, the activity of the catalyst gradually decreased. Through characterization, we found that the leaching of active Pd and the growth of Pd particles were the main causes of the deactivation.
6625, the TOF was as high as 3075 h−1, and the glycerol conversion and glycerol carbonate selectivity were 77% and 99%, respectively. As the number of times the Pd/CeO2-r catalyst was reused was increased, the activity of the catalyst gradually decreased. Through characterization, we found that the leaching of active Pd and the growth of Pd particles were the main causes of the deactivation.
Author contributions
Ziyan Wang, Shuo Guo: performed all the experiments. Zhimiao Wang and Fang Li: written the manuscript and analyzed the experimental data. Yanji Wang: designed the experiments, Wei Xue: conceived the research idea, designed the experiments, interpreted the data, and co-wrote the paper, recruit of funding.Conflicts of interest
There are no conflicts to declare.Acknowledgements
This work was financially supported by the National Natural Science Foundation of China (No. 21776057), and Natural Science Foundation of Tianjin (No. 18JCYBJC21500, 18JCYBJC42600). We thank Stephen Hessey, PhD, from Liwen Bianji, Edanz Editing China (www.liwenbianji.cn/ac), for editing the english text of a draft of this manuscript.References
- I. Ambat, V. Srivastava and M. Sillanpää, Renewable Sustainable Energy Rev., 2018, 90, 356–369 CrossRef CAS.
- X. H. Song, Y. F. Wu, D. H. Pan, J. H. Zhang, S. Q. Xu, L. J. Gao, R. P. Wei and G. M. Xiao, J. CO2 Util., 2018, 28, 326–334 CrossRef CAS.
- T. L. Ma, J. F. Ding, X. L. Liu, G. L. Chen and J. D. Zheng, J. Nanosci. Nanotechnol., 2020, 20, 7680–7685 CrossRef CAS.
- C. Cannilla, G. Bonura, S. Maisano, L. Frusteri, M. Migliori, G. Giordano, S. Todaro and F. Frusteri, J. Energy Chem., 2020, 48, 136–144 CrossRef.
- X. Zhang, G. Q. Cui and M. Wei, Ind. Eng. Chem. Res., 2020, 59, 12999–13006 CrossRef CAS.
- S. G. Xu, T. He, J. M. Li, Z. M. Huang and C. W. Hu, Appl. Catal., B, 2021, 292, 120145 CrossRef CAS.
- S. G. Xu, Y. Wu, J. M. Li, Y. He, Y. Xiao, C. Q. Zhou and C. W. Hu, ACS Sustainable Chem. Eng., 2020, 8, 4244–4255 CrossRef CAS.
- Y. Z. Lei, G. S. Lan, M. T. Fan and G. X. Li, Catal. Commun., 2020, 140, 106007 CrossRef CAS.
- S. Christy, A. Noschese, M. Lomeli-Rodriguez, N. Greeves and J. A. Lopez-Sanchez, Renewable Sustainable Energy Rev., 2016, 63, 533–555 CrossRef.
- P. B. Zhang, M. N. Zhu, M. M. Fan, P. P. Jiang and Y. M. Dong, J. Chin. Chem. Soc., 2019, 66, 164–170 CrossRef CAS.
- M. O. Sonnati, S. Amigoni, E. P. T. Givenchy, T. Darmanin, O. Choulet and F. Guittard, Curr. Opin. Green Sustain. Chem., 2018, 14, 99–107 CrossRef.
- C. W. Chang, Z. J. Gong, N. C. Huang, C. Y. Wang and W. Y. Yu, Catal. Today, 2020, 351, 21–29 CrossRef CAS.
- P. U. Okoye, S. Wang, W. A. Khanday, S. X. Li and T. Tang, Renewable Energy, 2020, 146, 2676–2687 CrossRef CAS.
- N. P. Huy and E. W. Shin, J. Catal., 2019, 373, 147–160 CrossRef.
- D. M. Chaves and M. J. Da Silva, New J. Chem., 2019, 43, 3698–3706 RSC.
- M. Casiello, A. Monopoli, P. Cotugno, A. Milella, M. M. Dell'Anna, F. Ciminale and A. Nacci, J. Mol. Catal. A: Chem., 2014, 381, 99–106 CrossRef CAS.
- J. L. Hu, J. J. Li, Z. H. Guan, W. L. Mo, Y. M. Ni, T. Li and G. X. Li, Appl. Catal., A, 2010, 386, 188–193 CrossRef CAS.
- J. L. Hu, Y. L. Gu, Z. H. Guan, J. J. Li, W. L. Mo, T. Li and G. X. Li, ChemSusChem, 2011, 4, 1767–1772 CrossRef CAS PubMed.
- L. Y. Wang, Y. Liu, C. L. Liu, R. Z. Yang and W. S. Dong, Sci. China: Chem., 2013, 56, 1455–1462 CrossRef CAS.
- B. Goris, S. Turner, S. Bals and G. Van Tendeloo, ACS Nano, 2014, 8, 10878–10884 CrossRef CAS PubMed.
- S. Sato, F. Sato, H. Gotoh and Y. Yamada, ACS Catal., 2013, 3, 721–734 CrossRef CAS.
- Z. M. Wang, H. Q. Zhang, L. C. Zhou, F. Li, W. Xue and Y. J. Wang, CIESC J., 2019, 70, 4625–4634 CAS.
- Y. Yuan, Z. M. Wang, H. L. An, W. Xue and Y. J. Wang, Chin. J. Catal., 2015, 36, 1142–1154 CrossRef CAS.
- Z. J. Fu, Z. M. Wang, H. J. Wang, F. Li, W. Xue and Y. J. Wang, RSC Adv., 2019, 9, 11356–11364 RSC.
- J. X. Liu, Y. M. Li, J. Zhang and D. H. He, Appl. Catal., A, 2016, 513, 9–18 CrossRef CAS.
- G. N. Li, L. Li, Y. Yuan, J. J. Shi, Y. Y. Yuan, Y. S. Li, W. R. Zhao and J. L. Shi, Appl. Catal., B, 2014, 158, 341–347 CrossRef.
- H. Q. Zhu, Z. F. Qin, W. J. Shan, W. J. Shen and J. G. Wang, J. Catal., 2004, 225, 267–277 CrossRef CAS.
- A. I. Boronin, E. M. Slavinskaya, I. G. Danilova, R. V. Gulyaev, Y. I. Amosov, P. A. Kuznetsov, I. A. Polukhina, S. V. Koscheev, V. I. Zaikovskii and A. S. Noskov, Catal. Today, 2009, 144, 201–211 CrossRef CAS.
- M. Cargnello, V. V. T. Doan-Nguyen, T. R. Gordon, R. E. Diaz, E. A. Stach, R. J. Gorte, P. Fornasiero and C. B. Murray, Science, 2013, 341, 771–773 CrossRef CAS PubMed.
- J. M. Wu, L. Zeng, D. G. Cheng, F. Q. Chen, X. L. Zhan and J. L. Gong, Chin. J. Catal., 2016, 37, 83–90 CrossRef CAS.
- D. D. Ding, X. Y. Xu, P. F. Tian, X. L. Liu, J. Xu and Y. F. Han, Chin. J. Catal., 2018, 39, 673–681 CrossRef CAS.
- L. C. Zhou, G. Feng, X. J. Liu, Z. M. Wang, F. Li, W. Xue and Y. J. Wang, Chin. J. Chem. Eng., 2020, 28, 2592–2599 CrossRef.
| This journal is © The Royal Society of Chemistry 2021 |


