 Open Access Article
Achieving solubility alteration with functionalized polydimethylsiloxane for improving the viscosity of supercritical CO2 fracturing fluids†
Bin Liu a,
Yanling Wang*a,
Lei Lianga and
Yijin Zeng*b
aSchool of Petroleum Engineering, China University of Petroleum (East China), Qingdao 266580, China. E-mail: wangyl@upc.edu.cn
bSinopec Petroleum Exploration and Development Research Institute, Beijing, 10083, China. E-mail: zengyj.sripe@sinopec.com
First published on 11th May 2021
Abstract
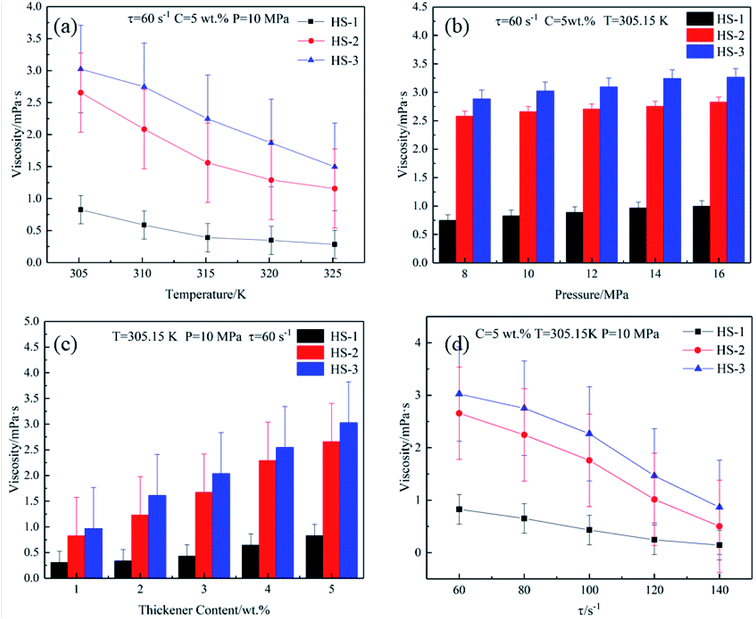
Supercritical carbon dioxide (SC-CO2) fracturing technology has the characteristics of a large amount of fixed CO2 and anhydrous fracturing. It has great application potential for developing unconventional oil and gas resources and mitigating the greenhouse effect. However, the low viscosity of SC-CO2 limits the development of this technology. In this work, HS series thickeners were prepared via a ring-opening polymerization and hydrosilylation reaction by a molecular simulation-aided design method. The simulation results of cohesive energy density, interaction energy, and radial distribution function are consistent with the visualization experimental results, which proves that HS (hyperbranched siloxane) series thickeners have excellent solubility in SC-CO2. HS-3 is the best thickener in the HS series. At 305.15 K and 10 MPa, 5 wt% HS-3 (60 s−1) increases the viscosity of SC-CO2 by 151 times, and the apparent viscosity is 3.024 mPa s. The apparent viscosity of SC-CO2 was positively correlated with the pressure and concentration but negatively correlated with the temperature and shear rate. The results indicate that it is feasible to introduce an aliphatic group and polysiloxane into a SC-CO2 thickener by hydrosilylation.
1. Introduction
The application of carbon dioxide has received extensive attention from scientists.1 The two main reasons are as follows: (1) climatic changes caused by CO2 cannot be overlooked, and (2) compared with hydrocarbon used as a raw material in the traditional industry, carbon dioxide can be economically beneficial and reduce environmental pollution.2 CO2 utilization was seen as a necessary cornerstone of successful large-scale carbon capture and storage.3 Currently, 5% of the US annual crude oil production relies on CO2-EOR (enhanced oil recovery) technology.4 Under heterogeneous reservoir conditions, 1.1–3.3 barrels of crude oil can be produced for every ton of CO2 injected.5 The CO2-EOR technology has the potential to be applied to 90% of the world's oilfields,6 which means that 140 Gt CO2 will be captured and fixed while enhancing the recovery rate.3 In short, SC-CO2 fracturing technology can improve the efficiency of shale gas development and reduce carbon emissions (Fig. 1).At present, the core problem limiting this technology is that the viscosity is too low (0.02–0.05 mPa s) to carry the proppant into the formation, and hence, it is necessary to study an excellent thickener. The reported SC-CO2 thickener7–9 containing fluorine has two disadvantages: (1) fluorinated monomers are too expensive to be widely used and (2) fluorine enters the biosphere via water circulation and cannot be metabolized by organisms.10 The thickening mechanism of siloxane thickeners was reported:11–15 (1) the formation of a Lewis acid hydrogen bond between a cosolvent and CO2 and (2) the similar compatibility between the cosolvent and siloxane. The main characteristics of the reported hydrocarbon thickeners16,17 are as follows: (1) low-molecular weight compounds have good solubility, but the thickening effect is poor and (2) under co-solvent conditions, long-chain polymer hydrocarbons are soluble in CO2. Organosilicon thickeners often rely on cosolvents to improve the solubility, and cosolvent causes formation damage.12 Silicone has the characteristics of low glass transition temperature, low binding energy, and good economy, which has great potential for the research and development of SC-CO2 thickeners. In this work, a series of SC-CO2 thickeners were designed and prepared to solve the high cost and high pollution of fluoropolymers and cosolvents. The thickener has excellent solubility, thickening property, heat resistance, and pressure resistance.
A series of SC-CO2 thickeners were designed and prepared by molecular simulation. The chemical structures of the copolymers were characterized by FT-IR, 1H-NMR, and GPC. The solubility of the thickener in SC-CO2 was studied using a visual reactor. The response of the thickener to the apparent viscosity of SC-CO2 under different conditions was studied using a self-designed capillary viscometer. The intermolecular interaction energy, radial distribution function (RDF), and cohesive energy density (CED) of the polymer were calculated to explain its solubility in SC-CO2.
2. Experimental section
2.1 Synthesis and characterization
The materials used in the experiment were octamethylcyclotetrasiloxane (D4, 98%), 1,1,3,3-tetramethyldisiloxane (TMD, 98%), ethylene glycol dimethacrylate (98%), triethylene glycol dimethacrylate (95%), trimethylolpropane trimethacrylate (98%), and H2Cl6Pt·6H2O (99.99%), which were purchased from Aladdin. H2SO4 (98%) was purchased from Sinopharm Chemical Reagent Co., Ltd. Ethylene glycol dimethacrylate, triethylene glycol dimethacrylate, and trimethylolpropane trimethacrylate were washed three times with a 3% NaOH alkali solution to remove MEHQ (p-hydroxyanisole) and then washed three times to remove NaOH. Anhydrous magnesium sulfate was dried, filtered to remove magnesium sulfate, distilled to remove residual alkali, and then refrigerated at low temperatures.First, add 1 g TMD and 50 g D4 to the hydrothermal reactor, and use 3–4 drops of sulfuric acid (90 °C, N2 atmosphere) as a catalyst to prepare the crude product of Si–H terminal chain siloxane by ring-opening polymerization.18 Then, sodium carbonate was added to the crude product to remove the catalyst, and the impurities were removed by vacuum distillation to obtain pure Si–H-terminated polysiloxane. In the third step, 4 g of ethylene glycol dimethacrylate was added to a 250 mL three-necked flask equipped with a thermometer, condenser, and magnetic stirring device, 40 ppm chloroplatinic acid was activated at 70 °C for 2 h, and hydrosilylation19 was reacted for 4 h. To remove chloroplatinic acid, 1 g activated carbon was added to the product, the hydrosilylation reaction was stopped, and the mixture was repeatedly washed with distilled water. Under the vacuum conditions of 370 K and 0.06 MPa, small-molecule compounds and water were removed using a rotating evaporator, and the final product HS-1 was obtained. The Si–H-terminated polysiloxane was reacted with unsaturated acrylate, in turn, to obtain thickeners HS-2 and HS-3. The synthetic route is shown in Fig. 4a.
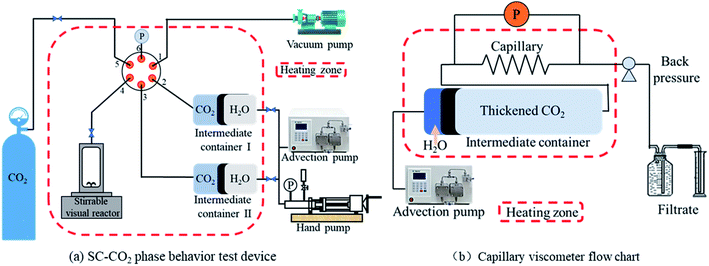
The capillary viscometer (Fig. 2b) consisted of an advection pump, intermediate containers, a differential pressure sensor, and a back-pressure system. In the beginning, the heating area was opened to make the system reach 305.15 K, CO2 gas entered the intermediate container I containing the thickener under the action of the pump, and CO2 was repeatedly injected and pressurized until thickened CO2 reached the supercritical state25 (T > 304.25 K, P > 7.38 MPa). Then, the experiment was carried out at a flow rate of 0.18 mL min−1 (τ = 60 s−1). The back pressure on the end of the system is 8 MPa. When the system was in equilibrium, the differential pressure in the sensor was recorded and the viscosity was calculated using eqn (1). Eqn (1) is generally suitable for laminar fluids:26
 | (1) |
2.2 Materials studio simulation
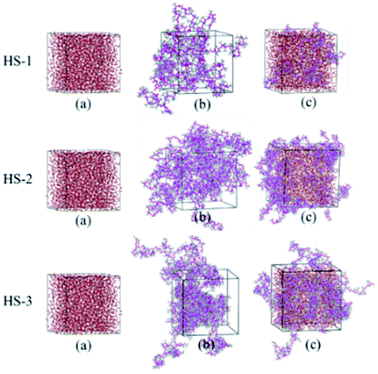
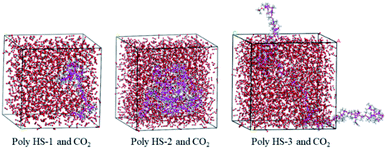
The polymer simulated in this work was named HS-1, HS-2, and HS-3, and a CO2 system with 2000 CO2 molecules, a polymer system with 8 polymer chains, and a polymer with 8 polymer chains 2000 CO2 molecules were established using the Material Studio software; the all-atom molecular model of the CO2 system is shown in Fig. 3.In recent years, molecular simulation technology has been widely used in the research field of CO2 thickeners.9,27 In this work, three kinds of polymer–CO2 boxes (305.15 K, 10 MPa) were constructed with amorphous cells, and through the optimization of the Forcite model and annealing calculation, the dynamic balance system was obtained. The thermostat and barostat were Andersen and Berendsen, respectively. The running time for all the systems was 400 ps, and the trajectories were saved at 1 ps intervals.23,28,29
3. Result and discussion
3.1 Structural characterization of HS series thickeners
The four test samples all contain 1256 cm−1 (Si–CH3), 1054 cm−1 (Si–O),30 and 792 cm−1 (Si–C),31 as shown in Fig. 4. After the hydrosilylation reaction, HS-1, HS-2, and HS-3 showed C![[double bond, length as m-dash]](https://www.rsc.org/images/entities/char_e001.gif) C and C
C and C![[double bond, length as m-dash]](https://www.rsc.org/images/entities/char_e001.gif) O tensile vibration peaks at 1638 cm−1 (ref. 32) and 1736 cm−1,33 which were not in 50
O tensile vibration peaks at 1638 cm−1 (ref. 32) and 1736 cm−1,33 which were not in 50![[thin space (1/6-em)]](https://www.rsc.org/images/entities/char_2009.gif) :
:![[thin space (1/6-em)]](https://www.rsc.org/images/entities/char_2009.gif) 1 Si–H-terminated polysiloxane, and the Si–H stretching vibration peak (2160 cm−1)34 vanished.
1 Si–H-terminated polysiloxane, and the Si–H stretching vibration peak (2160 cm−1)34 vanished.
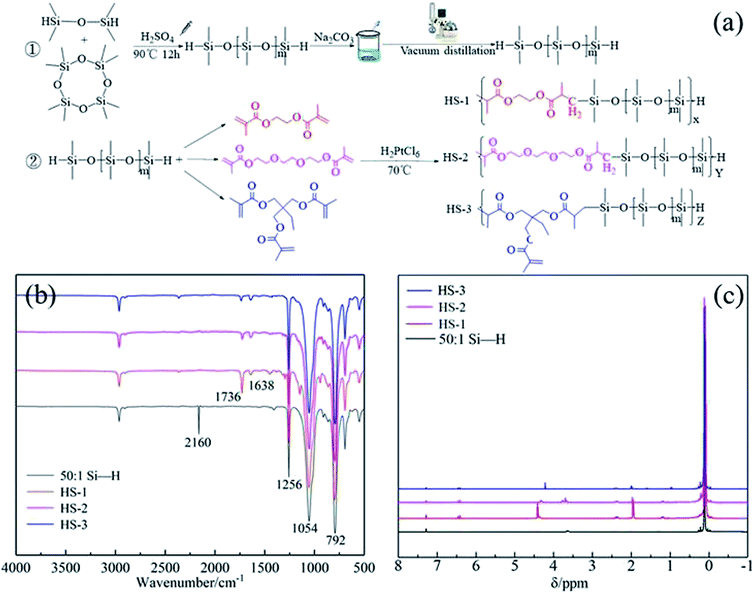 | ||
| Fig. 4 (a) Synthetic route of HS series thickener (b) Infrared spectrum of HS series thickener(c)HS series thickener hydrogen NMR spectrum. | ||
The chemical shifts of the four samples shown in Fig. 4 are detailed in Table 1. The results indicate that: (1) the Si–H peaks at 3.6 ppm in 50![[thin space (1/6-em)]](https://www.rsc.org/images/entities/char_2009.gif) :
:![[thin space (1/6-em)]](https://www.rsc.org/images/entities/char_2009.gif) 1 polysiloxane do not appear in HS series thickeners, (2) C
1 polysiloxane do not appear in HS series thickeners, (2) C![[double bond, length as m-dash]](https://www.rsc.org/images/entities/char_e001.gif) C hydrogen at 6.48–6.50 ppm appears in HS series thickeners. Combining the results of Fig. 5 and Table 1, it was proved that HS series thickeners were successfully prepared.
C hydrogen at 6.48–6.50 ppm appears in HS series thickeners. Combining the results of Fig. 5 and Table 1, it was proved that HS series thickeners were successfully prepared.
| Polymer category | δ/ppm | Types of H |
|---|---|---|
50![[thin space (1/6-em)]](https://www.rsc.org/images/entities/char_2009.gif) : :![[thin space (1/6-em)]](https://www.rsc.org/images/entities/char_2009.gif) 1 Si–H terminated polysiloxane 1 Si–H terminated polysiloxane |
0.17 | Si–CH3 |
| 3.60 | Si–H | |
| 7.28 | CDCl3 | |
| HS-1 | 0.16 | Si–CH3 |
| 1.17 | O![[double bond, length as m-dash]](https://www.rsc.org/images/entities/char_e001.gif) C–CH(CH3)–CH2 C–CH(CH3)–CH2 |
|
| 2.04 | CH2![[double bond, length as m-dash]](https://www.rsc.org/images/entities/char_e001.gif) C(CH3)–C C(CH3)–C![[double bond, length as m-dash]](https://www.rsc.org/images/entities/char_e001.gif) O O |
|
| 2.6 | O![[double bond, length as m-dash]](https://www.rsc.org/images/entities/char_e001.gif) C–CH(CH3)–CH2 C–CH(CH3)–CH2 |
|
| 4.41 | O–CH2–CH2–O | |
| 6.48–6.50 | CH2![[double bond, length as m-dash]](https://www.rsc.org/images/entities/char_e001.gif) C(CH3)–C C(CH3)–C![[double bond, length as m-dash]](https://www.rsc.org/images/entities/char_e001.gif) O O |
|
| 7.26 | CDCl3 | |
| HS-2 | 0.15 | Si–CH3 |
| 1.09–1.18 | O![[double bond, length as m-dash]](https://www.rsc.org/images/entities/char_e001.gif) C–CH(CH3)–CH2 C–CH(CH3)–CH2 |
|
| 2.01 | CH2![[double bond, length as m-dash]](https://www.rsc.org/images/entities/char_e001.gif) C(CH3)–C C(CH3)–C![[double bond, length as m-dash]](https://www.rsc.org/images/entities/char_e001.gif) O O |
|
| 2.4 | O![[double bond, length as m-dash]](https://www.rsc.org/images/entities/char_e001.gif) C–CH(CH3)–CH2 C–CH(CH3)–CH2 |
|
| 3.6–3.8 | CH2–O–CH2–CH2–O–CH2 | |
| 4.38 | O![[double bond, length as m-dash]](https://www.rsc.org/images/entities/char_e001.gif) C–O–CH2 C–O–CH2 |
|
| 6.48–6.50 | CH2![[double bond, length as m-dash]](https://www.rsc.org/images/entities/char_e001.gif) C(CH3)–C C(CH3)–C![[double bond, length as m-dash]](https://www.rsc.org/images/entities/char_e001.gif) O O |
|
| 7.28 | CDCl3 | |
| HS-3 | 0.17 | Si–CH3 |
| 1.14–1.26 | O![[double bond, length as m-dash]](https://www.rsc.org/images/entities/char_e001.gif) C–CH(CH3)–CH2–Si C–CH(CH3)–CH2–Si |
|
| (CH2)3–C–CH2–CH3 | ||
| 1.60 | (CH2)3–C–CH2–CH3 | |
| 2.04 | CH2![[double bond, length as m-dash]](https://www.rsc.org/images/entities/char_e001.gif) C(CH3)–C C(CH3)–C![[double bond, length as m-dash]](https://www.rsc.org/images/entities/char_e001.gif) O O |
|
| 2.4 | O![[double bond, length as m-dash]](https://www.rsc.org/images/entities/char_e001.gif) C–CH(CH3)–CH2 C–CH(CH3)–CH2 |
|
| 3.8–4.03 | (CH2)3–C–CH2–CH3 | |
| 6.48–6.50 | CH2![[double bond, length as m-dash]](https://www.rsc.org/images/entities/char_e001.gif) C(CH3)–C C(CH3)–C![[double bond, length as m-dash]](https://www.rsc.org/images/entities/char_e001.gif) O O |
|
| 7.26 | CDCl3 |
3.2 Molecular weight analysis
The GPC results of Fig. S1 (ESI†) indicate that the degree of polymerization of 50![[thin space (1/6-em)]](https://www.rsc.org/images/entities/char_2009.gif) :
:![[thin space (1/6-em)]](https://www.rsc.org/images/entities/char_2009.gif) 1 Si–H-terminated polysiloxane is 5, and the molecular weights of HS-1, HS-2, and HS-3 show that the degree of polymerization is 5, 15, and 16, respectively. In a supercritical state, low-content HS-1 may have better solubility, and higher molecular weight HS-2 and HS-3 may have better thickening performance.
1 Si–H-terminated polysiloxane is 5, and the molecular weights of HS-1, HS-2, and HS-3 show that the degree of polymerization is 5, 15, and 16, respectively. In a supercritical state, low-content HS-1 may have better solubility, and higher molecular weight HS-2 and HS-3 may have better thickening performance.
3.3 Cloud point
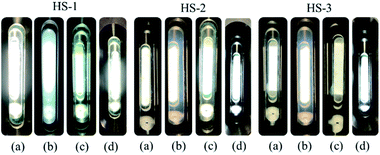
Fig. 5a shows that pure SC-CO2 (298.15 K, 7.48 MPa) in the visualization reactor is transparent. When the visualized reactor system was composed of HS series thickeners and SC-CO2, there were two situations: (1) HS-1 was added to SC-CO2 (298.15 K, 7.48 MPa), and the liquid shows obvious turbidity under white background light and (2) after shaking, SC-CO2 (298.15 K, 7.48 MPa) was thickened by HS-2, and HS-3 appeared slightly turbid. Finally, the visualization reactor was sealed and placed in a 305.15 K oven to stand for 12 h. After shaking, it can be observed that the three thickened SC-CO2 (305.15 K, 7.66 MPa) fluids were all in a clear and bright state (Fig. 5c). Fig. 5c and d are the results of the phase behavior study. The instrument in Fig. 2b was used to study the phase behavior (maintaining 305.15 K as a constant temperature condition). According to the experimental results, the three thickening systems remain clear and translucent when the system state reaches the non-critical state of 305.15 K and 7.32 MPa. The HS thickener prepared for this study has no cloud point of supercritical conditions and is a thickener with excellent solubility in SC-CO2 (no fluoropolymer and co-solvent added).The introduction to multiple aliphatic groups of the thickener molecule is beneficial for enhancing the solubility. The mechanism is that CO2 and lipid groups form hydrogen bonds via the action of Lewis acids and bases,35–37 and the good chain flexibility38,39 of polysiloxane itself also improves the solubility of polymers in SC-CO2.
3.4 Thickening mechanism and performance
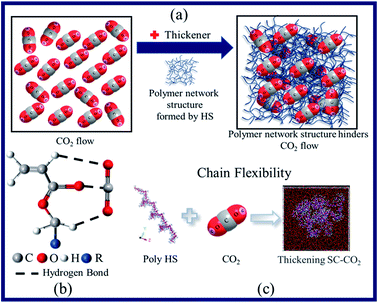 | ||
| Fig. 6 Dissolution and viscosity-increasing mechanisms of SC-CO2 mainly include (a) polymer–polymer action, (b) polymer–CO2 action, and (c) flexibility polymer of a chain. | ||
The mechanism (Fig. 6a and b) involves the following steps: (1) the HS series polymer chains themselves entangle with each other to form a network structure40–42 and (2) the hydrogen bond formed by the aliphatic group and CO2 in the polymerization unit via the action of Lewis acid and base further strengthens the network structure.35–37 When the system temperature increases, the network structure that hinders the flow of CO2 molecules becomes loose, and the macroscopic performance is that the viscosity decreases. The viscosity of the system will drop sharply until the temperature rises enough to break the hydrogen bond. However, it is worth mentioning that the HS-3 thickener exhibits a certain temperature resistance. This is because there are a certain number of side chains in the polymerization unit, which make the reticular structure formed by the HS-3 thickener more stable than those formed by HS-1 and HS-2.
As explained from the thickening mechanism, the tighter the network structure formed by polymer molecular chains and CO2 (Fig. 6a), the greater the flow resistance to SC-CO2, and the macroscopic manifestation shows an increase in apparent viscosity.42 As the pressure increased, the interaction between the electron-donating groups in the polymer and CO2 increased, which promoted the increase in apparent viscosity.43 During the pressurization process, the intermolecular distance gradually decreases, and hydrogen bonds (Fig. 6b) are easier to form.44 The two effects complement each other and thus have a thickening effect.
The mechanism of action is that with the increase in the thickener content of a closed system, the number of polymer molecular chains that can form a network structure and hydrogen bonds42 increases multiple times, and the tighter structure greatly hinders the flow of CO2 molecules. Nevertheless, it takes a lot of energy to destroy the network structure and hydrogen bonds.45 Under the experimental conditions in this article, there was not enough external energy to destroy the structure. Therefore, the CO2 molecules still flowing in the system were captured by the expanding polymer network (Fig. 6a) and macroscopically manifested as an increase in apparent viscosity.
The HS thickener is a functionalized polysiloxane, which has inherently good chain flexibility (Fig. 6c). With the condition of low shear rate, the shear force is not enough to completely destroy the network structure formed by the entanglement with polymer molecular chains, so that the SC-CO2 fluid maintains a higher viscosity at a low shear rate. When the shear rate gradually increases, the network structure is gradually destroyed, resulting in a highly oriented arrangement of polymer molecular chains along the shear direction, which reduces the flow resistance of CO2 (decreases the apparent viscosity).
3.5 Materials studio computational simulation
| Einter = Epolymer–CO2 − (Epolymer + ECO2) | (2) |
The Epolymer–CO2, Epolymer and ECO2 parameters of HS series thickeners are shown in Table 2. From the research data in Table 2, it can be predicted that the solubility of poly HS-2 and poly HS-3 in SC-CO2 was close and stronger than that of poly HS-1.
| System | Epolymer–CO2/kJ mol−1 | Epolymer/kJ mol−1 | ECO2/kJ mol−1 | Einter/kJ mol−1 |
|---|---|---|---|---|
| Poly HS-1 and SC-CO2 | 1157.25 | −1089.06 | 1874.10 | 372.21 |
| Poly HS-2 and SC-CO2 | 640.21 | −3060.89 | 1910.25 | 1790.85 |
| Poly HS-3 and SC-CO2 | 791.42 | −2784.26 | 1880.17 | 1695.51 |
| |Δδ| = |δpolymer–CO2 − δCO2| | (3) |
| System | CED/(J m−3) | δ/(J cm−3)1/2 | |Δδ|/(J cm−3)1/2 |
|---|---|---|---|
| Poly HS-1 and SC-CO2 | 1.78 × 10⁸ | 13.34 | 0.17 |
| Poly HS-2 and SC-CO2 | 1.768 × 10⁸ | 13.29 | 0.22 |
| Poly HS-3 and SC-CO2 | 1.80 × 10⁸ | 13.41 | 0.1 |
| SC-CO2 | 1.825 × 10⁸ | 13.51 | 0 |
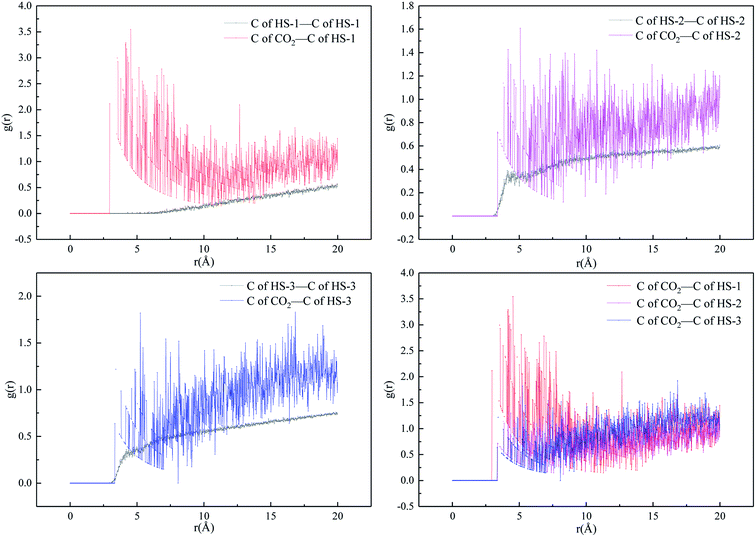
 was taken for analysis. If the RDF value of polymer CO2 is large, it is proved that the HS series thickener is miscible with SC-CO2.28,29,48,52,53
The results shown in Fig. 9 indicate that the RDF values (305.15 K, 10 MPa) of  are generally greater than those of InterCpolymer. In the RDF diagram of HS-1, HS-2, HS-3, and CO2, it can be seen that the three polymers can be dissolved in SC-CO2, and the data show a similar trend. Among them, HS-1 showed a larger peak value of the range of 4–7 Å, which was the optimal solution to simulation calculation. This is because the molecular chain of HS-1 was shorter and the molecular weight was lower, resulting in better solubility.
4. Conclusion
In this study, the viscosity of HS series thickeners was studied using a self-designed capillary viscometer. The calculation results indicated that the HS series thickeners have an excellent dissolving effect on SC-CO2, which provides a new type of feasibility for the design of SC-CO2 thickeners. At first, polysiloxane had excellent chain flexibility to make HS series thickeners better dispersible in SC-CO2. Then, the polymer molecular chains were cross-twisted via polymer–polymer interaction to form a spatial network structure, which trapped CO2 molecules and weakened its fluidity to achieve a thickening effect. Finally, the introduction to multiple lipid groups of the polymerization units of the HS series resulted in (a) excellent solubility and (b) formation of hydrogen bonds between the carbonyl group and CO2 via Lewis acid–base pairing. It was found that 5 wt% (10 MPa, 305.15 K) HS-3 has the best thickening performance, and the viscosity of SC-CO2 increases 151 times, reaching 3.024 mPa s. The HS series thickeners prepared for this study can be dissolved in SC-CO2 without the use of fluoropolymer and co-solvents, which has little damage to the formation and solves the problems of high price and serious pollution by traditional thickeners.Conflicts of interest
There are no conflicts to declare.Acknowledgements
The authors acknowledgment the support of the National Natural Science Foundation of China (U1762212).References
- M. Bui, C. S. Adjiman, A. Bardow, E. J. Anthony, A. Boston, S. Brown, P. S. Fennell, S. Fuss, A. Galindo, L. A. Hackett, J. P. Hallett, H. J. Herzog, G. Jackson, J. Kemper, S. Krevor, G. C. Maitland, M. Matuszewski, I. S. Metcalfe, C. Petit, G. Puxty, J. Reimer, D. M. Reiner, E. S. Rubin, S. A. Scott, N. Shah, B. Smit, J. P. M. Trusler, P. Webley, J. Wilcox and N. Mac Dowell, Energy Environ. Sci., 2018, 11, 1062–1176 RSC.
- V. D. A. Niklas and A. Bardow, Green Chem., 2014, 16, 3272–3280 RSC.
- N. Mac Dowell, P. S. Fennell, N. Shah and G. C. Maitland, Nat. Clim. Change, 2017, 7, 243–249 CrossRef CAS.
- Z. Dai, H. Viswanathan, R. Middleton, F. Pan, W. Ampomah, C. Yang, W. Jia, T. Xiao, S. Y. Lee and B. McPherson, Environ. Sci. Technol., 2016, 50, 7546 CrossRef CAS PubMed.
- C. Hepburn, E. Adlen, J. Beddington, E. A. Carter, S. Fuss, N. Mac Dowell, J. C. Minx, P. Smith and C. K. Williams, Nature, 2019, 575, 87–97 CrossRef CAS.
- M. Godec, Global technology roadmap for CCS in industry Sectoral Assessment CO2 Enhanced Oil Recovery, Advanced Resources International[J]. inc., Arlington, VA, 2011, p. 22203 Search PubMed.
- J. Desimone, Z. Guan and C. Elsbernd, Science, 1992, 257, 945 CrossRef CAS.
- Z. Huang, C. Shi, J. Xu, S. Kilic, R. M. Enick and E. J. Beckman, Macromolecules, 2000, 33, 5437–5442 CrossRef CAS.
- B. Sun, W. Sun, H. Wang, Y. Li, H. Fan, H. Li and X. Chen, J. CO2 Util., 2018, 28, 107–116 CrossRef CAS.
- X. Wang, W. Cheng, Q. Yang, H. Niu and Q. Liu, J. Environ. Sci., 2018, 69(7), 217–226 CrossRef.
- M. J. O'Brien, R. J. Perry, M. D. Doherty, J. J. Lee, A. Dhuwe, E. J. Beckman and R. M. Enick, Energy Fuels, 2016, 30, 5990–5998 CrossRef.
- M. Du, X. Sun, C. Dai, H. Li, T. Wang, Z. Xu, M. Zhao, B. Guan and P. Liu, J. Pet. Sci. Eng., 2018, 166, 369–374 CrossRef CAS.
- Q. Li, Y. Wang, Q. Li, G. Foster and C. Lei, RSC Adv., 2018, 8, 8770–8778 RSC.
- Y. Wang, Q. Li, W. Dong, Q. Li, F. Wang, H. Bai, R. Zhang and A. B. Owusu, RSC Adv., 2018, 8, 39787–39796 RSC.
- Q. Li, Y. Wang, X. Wang, H. Yu, Q. Li, F. Wang, H. Bai and F. Kobina, Energy Sources, Part A, 2019, 41, 368–377 CAS.
- F. M. Llave, T. H. Chung and T. E. Burchfield, SPE Reservoir Eng., 1990, 5, 47–51 CrossRef CAS.
- S. Zhang, Y. She and Y. Gu, J. Chem. Eng. Data, 2011, 56, 1069–1079 CrossRef CAS.
- J. Chojnowski, J. Inorg. Organomet. Polym., 1991, 1, 299–323 CrossRef CAS.
- L. N. Lewis and N. Lewis, J. Am. Chem. Soc., 1986, 108, 7228–7231 CrossRef CAS.
- S. Tarhan, Spectrochim. Acta, Part A, 2020, 241, 118714 CrossRef.
- N. A. Birkin, O. J. Wildig and S. M. Howdle, Polym. Chem., 2013, 4, 3791–3799 RSC.
- E. Girard, T. Tassaing, L. Catherine, J. D. Marty and M. Destarac, Macromolecules, 2012, 45, 9674–9681 CrossRef CAS.
- D. Hu, S. Sun, P. Q. Yuan, L. Zhao and T. Liu, J. Phys. Chem. B, 2017, 119, 3194–3204 CrossRef.
- H. Batzer and S. A. C. Zahir, J. Appl. Polym. Sci., 1975, 19, 585–600 CrossRef CAS.
- S. Cummings, D. Xing, R. Enick, S. Rogers, R. Heenan, I. Grillo and J. Eastoe, Soft Matter, 2012, 8, 7044–7055 RSC.
- A. C. Aycaguer, M. Lev-On and A. M. Winer, Energy Fuels, 2001, 15(2), 303–308 CrossRef CAS.
- A. G. Goicochea and A. Firoozabadi, J. Phys. Chem. C, 2019, 123, 29461–29467 CrossRef CAS.
- D. Hu, Y. Zhang, M. Su, L. Bao, L. Zhao and T. Liu, J. Supercrit. Fluids, 2016, 96–106 CrossRef CAS.
- D. Hu, S. Sun, P. Q. Yuan, L. Zhao and T. Liu, J. Phys. Chem. B, 2015, 119, 12490–12501 CrossRef CAS.
- Q. Li, Y. Wang, Q. Li, G. Foster and C. Lei, RSC Adv., 2018, 8, 8770–8778 RSC.
- B. Altansukh, G. Burmaa, S. Nyamdelger, N. Ariunbolor, A. Shibayama and K. Haga, Int. J. Soc. Mater. Eng. Resour., 2014, 20, 29–34 CrossRef CAS.
- A. Svatoš and A. B. Attygalle, Anal. Chem., 1997, 69(10), 1827–1836 CrossRef.
- R. Gnanasambandam and A. Proctor, Food Chem., 2000, 68, 327–332 CrossRef CAS.
- P. Quintard, G. Ramis, M. Cauchetier, G. Busca and V. Lorenzelli, J. Mol. Struct., 1988, 174, 369–374 CrossRef CAS.
- Y. Gu, T. Kar and S. Scheiner, J. Am. Chem. Soc., 1999, 121, 9411–9422 CrossRef CAS.
- P. Raveendran and S. L. Wallen, J. Am. Chem. Soc., 2002, 124, 12590–12599 CrossRef.
- P. Van Ginderen, W. A. Herrebout and B. J. van der Veken, J. Phys. Chem. A, 2003, 107, 5391–5396 CrossRef CAS.
- J. DeFelice and J. E. G. Lipson, Macromolecules, 2014, 47, 5643–5654 CrossRef CAS.
- F. Rindfleisch, T. P. Dinoia and M. A. McHugh, J. Phys. Chem., 1996, 100, 15581–15587 CrossRef CAS.
- J. H. Bae and C. A. Irani, SPE Advanced Technology Series, 1993, 1, 166–171 CrossRef.
- M. D. Doherty, J. J. Lee, A. Dhuwe, M. J. O'Brien, R. J. Perry, E. J. Beckman and R. M. Enick, Energy Fuels, 2016, 30, 5601–5610 CrossRef CAS.
- X. Luo, S. Wang, Z. Wang, Z. Jing and M. Lv, J. Pet. Sci. Eng., 2015, 133, 410–420 CrossRef CAS.
- S. Kilic, S. Michalik, Y. Wang, J. K. Johnson, R. M. Enick and E. J. Beckman, Ind. Eng. Chem. Res., 2005, 42, 6415–6424 CrossRef.
- K. Trickett, D. Xing, R. Enick, J. Eastoe and M. J. Hollamby, Langmuir, 2010, 26(1), 83–88 CrossRef CAS PubMed.
- T. Tsukahara, Y. Kayaki, T. Ikariya and Y. Ikeda, Angew. Chem., Int. Ed., 2004, 43, 3719–3722 CrossRef CAS PubMed.
- T. Tsukahara, Y. Kayaki, T. Ikariya and Y. Ikeda, Angew. Chem., Int. Ed., 2004, 43, 3719–3722 CrossRef CAS.
- X. Luo, S. Wang, Z. Wang, Z. Jing, M. Lv, Z. Zhai and T. Han, J. Pet. Sci. Eng., 2015, 133, 410–420 CrossRef CAS.
- D. Hu, S. Sun, P. Yuan, L. Zhao and T. Liu, J. Phys. Chem. B, 2015, 119, 3194–3204 CrossRef CAS.
- Y. Marcus, J. Supercrit. Fluids, 2006, 38, 7–12 CrossRef CAS.
- P. Raveendran and S. L. Wallen, J. Am. Chem. Soc., 2002, 124, 7274–7275 CrossRef CAS.
- H. Lee, J. W. Pack, W. Wang, K. J. Thurecht and S. M. Howdle, Macromolecules, 2010, 43, 2276–2282 CrossRef CAS.
- P. Gestoso and J. Brisson, Polymer, 2003, 44, 2321–2329 CrossRef CAS.
- Y. Fu, L. Liao, L. Yang, Y. Lan, L. Mei, Y. Liu and S. Hu, Mol. Simul., 2013, 39, 415–422 CrossRef CAS.
Footnote |
| † Electronic supplementary information (ESI) available. See DOI: 10.1039/d1ra02069b |
| This journal is © The Royal Society of Chemistry 2021 |


