 Open Access Article
Creative Commons Attribution 3.0 Unported Licence
Electrocatalytic and structural properties and computational calculation of PAN-EC-PC-TPAI-I2 gel polymer electrolytes for dye sensitized solar cell application
Faisal I. Chowdhury *ab,
Jahidul Islama,
A. K. Arof*b,
M. U. Khandakerc,
Hossain M. Zabed
 d,
Ibrahim Khalil
 e,
M. Rezaur Rahmanf,
Shahidul M. Islam
 g,
M. Razaul Karimh and
Jamal Uddin
 i
i
aNanotechnology and Renewable Energy Research Laboratory (NRERL), Department of Chemistry, University of Chittagong, Chittagong-4331, Bangladesh. E-mail: faisal@cu.ac.bd; faisal.cubd@yahoo.com
bCenter for Ionics University of Malaya, Department of Physics, University of Malaya, 50603 Kuala Lumpur, Malaysia. E-mail: akarof@um.edu.my
cCenter for Radiation Sciences, Institute for Healthcare Development, Sunway University, 47500 Subang Jaya, Malaysia
dSchool of Food and Biological Engineering, Jiangsu University, Zhenjiang 212013, Jiangsu, China
eNanotechnology and Catalysis Research Centre, Institute for Advanced Studies, University of Malaya, 50603 Kuala Lumpur, Malaysia
fDepartment of Chemical Engineering and Energy Sustainability, Faculty of Engineering, University Malaysia Sarawak, Malaysia
gDepartment of Chemistry, University of Illinois at Chicago, Chicago, USA
hFaculty of Engineering, University of Malaya, 50603 Kuala Lumpur, Malaysia
iCenter for Nanotechnology, Department of Natural Sciences, Coppin State University, Baltimore, MD, USA
First published on 29th June 2021
Abstract
In this study, gel polymer electrolytes (GPEs) were prepared using polyacrylonitrile (PAN) polymer, ethylene carbonate (EC), propylene carbonate (PC) plasticizers and different compositions of tetrapropylammonium iodide (TPAI) salt. Linear sweep voltammetry (LSV) and electrochemical impedance spectroscopy (EIS) measurements were done using non-blocking Pt-electrode symmetric cells. The limiting current (Jlim), apparent diffusion coefficient of triiodide ions  and exchange current were found to be 12.76 mA cm−2, 23.41 × 10⁻⁷ cm2 s−1 and 11.22–14.24 mA cm−2, respectively, for the GPE containing 30% TPAI. These values are the highest among the GPEs with different TPAI contents. To determine the ionic conductivity, the EIS technique was employed with blocking electrodes. The GPE containing 30% TPAI exhibited the lowest bulk impedance, Rb (22 Ω), highest ionic conductivity (3.62 × 10⁻³ S cm−1) and lowest activation energy. Fourier transform infrared (FTIR) spectroscopy and X-ray diffraction (XRD) techniques were utilized for structural characterization. Functional group interactions among PAN, EC, PC and TPAI were studied in the FTIR spectra of the GPEs. An up-shift of the XRD peak indicates the polymer–salt interaction and possible complexation of the cation (TPA+ ion) with the lone pair of electrons containing site –C
![[triple bond, length as m-dash]](https://www.rsc.org/images/entities/char_e002.gif) N at the N atom in the host polymer matrix. On the other hand, computational study shows that TPAI-PAN based GPE possesses the lowest frontier orbital bandgap, which coincided with the enhanced electrochemical and electrocatalytic performance of GPE. The dye-sensitized solar cell (DSSC) fabricated with these GPEs showed that the JSC (19.75 mA cm−2) and VOC (553.8 mV) were the highest among the GPEs and hence the highest efficiency, η (4.76%), was obtained for the same electrolytes.
N at the N atom in the host polymer matrix. On the other hand, computational study shows that TPAI-PAN based GPE possesses the lowest frontier orbital bandgap, which coincided with the enhanced electrochemical and electrocatalytic performance of GPE. The dye-sensitized solar cell (DSSC) fabricated with these GPEs showed that the JSC (19.75 mA cm−2) and VOC (553.8 mV) were the highest among the GPEs and hence the highest efficiency, η (4.76%), was obtained for the same electrolytes.
1. Introduction
One of the important components of dye-sensitized solar cells (DSSCs) is the electrolyte. The conducting polymers (CPs) have been regarded as alternative materials for DSSCs and other electronic devices because of their outstanding electrochemical properties, high electrical conductivity, high tensile strength, good stability and safety, ease of shaping, good processing ability, high flexibility, no spillage and low-costs.1–7 Due to the outstanding benefits of CPs, various types of polymer electrolytes (PEs) have been studied for many years. Nowadays, there are diverse families of conventional polymer electrolytes, such as gel polymer electrolytes, ionic rubber forms of polymer electrolytes and polyelectrolytes.8 There are a variety of traditional polymer based materials on or after synthetic polymers and their blends to biopolymer.8 Some of the well known polymers are polyacrylonitrile (PAN),9–12 polyethylene oxide (PEO),13 polyethylene glycol (PEG),14,15 poly(methyl methacrylate) (PMMA),16,17 poly(ethylene glycol) methyl ether methacrylate (PEGMA),18 poly(vinyl chloride) (PVC),19 poly(vinylidene fluoride) (PVdF)20 and poly(vinylidene fluoride-co-hexafluoropropylene) (PVdF-HFP).21,22 Until now, polysaccharides and modified polysaccharides based materials were in reality for their superior ionic conductivity at room temperature, which includes, for example, chitosan,23,24 cellulose25 and carrageenan.26 Recently, Di Noto et al. reported another two main kinds of hybrid inorganic–organic PEs that are mono-phase and multi-phase PEs.27 Also, various inorganic filler were also reported, such as titania (TiO2), zircronia (ZrO2), carbon-nanotubes (CNT), graphene (Gr) and silica (SiO2).28–32 In spite of these substantial amounts of research works PEs, their application in DSSCs is still limited.The advantage of coordinating polymer and an appropriate salt in the solid-state have been used by researchers.33 Nevertheless, viscous electrolytes can limit ionic transport34 and penetration of the electrolyte into the mesoporous titania photoelectrode.35 The DSSCs fabricated with pure polymer electrolytes show lower values of short-circuit current, fill factor and efficiency when compared to DSSCs assembled with liquid electrolytes. To overcome these shortcomings of solid polymer electrolytes, researchers have considered liquid electrolytes, gel polymer electrolytes or quasi-solid electrolytes for DSSC application for their higher electrical conductivity and excellent stability.36–38 The conventional liquid electrolytes have serious defects, such as electrolyte evaporation, leakages, desorption, photo-degradation of the dye and corrosion of the platinum secondary electrode.39–41 Enormous efforts have been made to find alternatives for the liquid electrolytes, solid, quasi-solid/GPEs and ionic liquid blended electrolytes were studied to replace the liquid electrolytes.42 Also, for sustainable DSSC development, eco-friendly and cost-effective electrolyte and electrode materials are essential.43
Polymer electrolytes have demonstrated advantages over liquid electrolytes, including high tensile strength, better safety, ease of shape based fabrication, high processing ability, intact interfacing properties between electrodes, good flexibility, and no spillage.8,44 Very recent study has demonstrated that PAN, PEO, PVDF, PVC, polyurethane (PU) etc. based PEs have led to develop more efficient and stable DSSCs.45,46 Such a PEO based polymer material, i.e. PMMA, has been utilized to form GPE using different ratios of liquid electrolytes, which resulted improved efficiency (11.32%) in comparison with the available PEO based PEs.47 A PVA based GPE was applied in DSSC (natural dye-sensitized) that showed 2.62% efficiency.48 Buraidah and co-workers reported a high efficient (η = 9.61%) DSSC (N3 dye-sensitized) prepared with functionalized chitosan (phthaloylchitosan) based GPEs.24 Gohel and co-workers combined liquid electrolyte and gelator for enhancing cell performances, as it can increase ionic conductivity with the support of PEO-PMMA polymer hosted in EC/PC/THF plasticizer/solvent salt complexes containing I−/I3− redox shuttle.49 Likewise, Nair et al.50 reported superior ionic conductivity in protic ionic liquids (PILs) doped in acidic medium (i.e. glacial acetic acid) with TBP in GPE. In the twenty-first century, researchers focused again on investigating aqueous systems in DSSCs by replacing organic solvents.51–54 The influential work was reported by O'Regan et al. in 2010 that might be unquestionably the original work for the scientific community, in which they used different ratios of methoxy propionitrile (MPN)-water electrolytes.55,56 In another work on water based DSSC showed enhanced photocurrent densities and photovoltages, which resulted higher efficient solar cells except observing lower fill factors.57
In GPEs, a high amount of organic solvent is trapped in the polymer matrix, resulting in the compensation of solvent leakage and volatilization problems. GPEs have good contact with electrodes,58 higher ionic conductivity than solid polymer electrolytes,59 rationally high photovoltaic performance and better thermal and mechanical stability over liquid electrolytes.60 Classical GPE contains small portions of the low molar mass polar polymer matrix in large amount of organic plasticizer (ethylene carbonate, EC and/or propylene carbonate, PC) with polar aprotic organic solvents (acetonitrile, AN and tetrahydrofuran, THF). The plasticizer lowers the glass transition temperature of the polymer by introducing disorders in the crystalline phase, increasing its segmental mobility and free volume of the system. Even though GPEs have many advantages, their electrical and photovoltaic performance is still far away for considering them in the photovoltaic application commercially due to some limitations. According to scientific reports,61–63 the transportation of charge carriers is hindered by the gel polymer network inside the polymer matrixes and gelators may interact or even react with chemical compounds of the electrolytes.
PAN based electrolytes have also been extensively studied because of their good ionic conductivity, excellent chemical and flame resistance, electrochemical stability.64–67 PAN is one of the most valuable fiber-forming polymers and is extensively used due to its high abrasion resistance, strength and good insect resistance.68 It is used to produce a large variety of products, including ultrafiltration membranes, hollow fibers for reverse osmosis, fibers for textiles, oxidized flame retardant fibers and carbon fiber. However, the conductivity of pristine PAN is low (<10−14 S cm−1) that restricts further applications. Triiodide/iodide redox couple in GPEs is important for the DSSC operation, which is formed by the iodide salt and iodine. The concentration and size of the salt have significant roles in the photovoltaic DSSC performance. It has been observed that the photocurrent drops and the photovoltage rises with increasing radius of the cations.69 This is because the conduction band energy of TiO2 and the associated influence on the electron injection efficiency vary with the cation nature.70 According to reports,71,72 smaller cation (Li+, Na+, Mg2+) speeds up the dye regeneration. Furthermore, researchers have revealed that the cation size of the doping salt plays an important role in the improvement of iodide conductivity. Several researchers have argued that larger cations enhance the iodide ion mobility, resulting in better DSSC performance,73,74 and DSSCs based on GPEs with salts containing larger cations like tetrapropyl ammonium iodide (Pr4NI) and tetrahexyl ammonium iodide (Hex4NI) have been reported.75–77
The dynamics of electro-catalysis of iodide/triiodide redox mediator on cathode or counter electrode is one of the most critical phenomena in DSSC operational mechanism. The counter electrode reduces triiodide (I3−) into iodide (I−) to regenerate the light-absorbing sensitizer after electron injection.77 Optimization of I2 concentration is also important because if the iodine concentration is too high, polyiodide species like I5−, I7− and I9− may also be formed, but in particular, only triiodide seems to be of importance in DSSC electrolytes.78 The limiting current, exchange current and charge transfer resistance are also vital parameters for the DSSCs optimization.79
According to the very recent review article published in 2020 by Teo et al.80 on polyacrylonitrile polymer host based GPEs for DSSCs application, PAN-EC-PC-TPAI-I2 gel polymer electrolytes were reported to be promising for DSSC74,81–88 In this context, PAN-EC-PC-TPAI-I2 gel polymer electrolytes were investigated in the present work, which included various characterizations, such as electrocatalytic performance, detailed vibrational study and XRD analysis. Also, we are reporting the computational calculation (frontier orbitals, HOMO–LUMO energy states, etc.) of the PAN-EC-PC-TPAI-I2 based GPEs systems for the first time. Finally, the prepared GPE with maximum conductivity was applied in DSSC.
2. Experimental
2.1. Materials
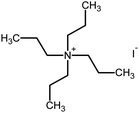
Polyacrylonitrile (PAN), ethylene carbonate (EC), propylene carbonate (PC), quaternary ammonium iodide salt: tetra-propylammonium iodide (TPAI), and iodine (I2) were procured from Aldrich. The purity for all starting materials was greater than 98%. Table 1 shows the chemical structures of PAN, EC, PC and TPAI. Prior to use PAN and TPAI were vacuum dried for 24 h at 50 °C in a vacuum oven. Other materials were used as received. Conducting glass substrates (fluorine doped tin oxide, FTO) with sheet resistance of 10 Ω cm−2, sensitizing N3 dye [cis-bis(isothiocyanato)bis(2,2′-bipyridyl-4,4′-dicarboxylato ruthenium(II)] and platinum catalyst solution (plastisol) were purchased from Solaronix SA, Switzerland. TiO2, P90 (14 nm) and P25 (21 nm) were purchased from AEROXIDE.2.2. Gel polymer electrolyte (GPE) preparation
For the preparation of gel polymer electrolytes, PAN, EC and PC were used as host polymer and plasticizers, whereas I2 was used to form the redox mediator. The GPEs were prepared following the composition PAN![[thin space (1/6-em)]](https://www.rsc.org/images/entities/char_2009.gif) :
:![[thin space (1/6-em)]](https://www.rsc.org/images/entities/char_2009.gif) EC
EC![[thin space (1/6-em)]](https://www.rsc.org/images/entities/char_2009.gif) :
:![[thin space (1/6-em)]](https://www.rsc.org/images/entities/char_2009.gif) PC
PC![[thin space (1/6-em)]](https://www.rsc.org/images/entities/char_2009.gif) :
:![[thin space (1/6-em)]](https://www.rsc.org/images/entities/char_2009.gif) xTPAI
xTPAI![[thin space (1/6-em)]](https://www.rsc.org/images/entities/char_2009.gif) :
:![[thin space (1/6-em)]](https://www.rsc.org/images/entities/char_2009.gif) yI2, where x is 10, 20, 30 and 40 wt% with respect to the PAN/EC/PC mass and y is 10 mol% of TPAI. Table 2 shows the compositions of the GPEs. The masses of PAN, EC and PC were kept at 0.4, 1.5 and 1.5 g, respectively. EC and PC were mixed and stirred in a glass bottle and heated at about 110–120 °C. PAN polymer was then added with continuous stirring and heating. After a homogenous solution was obtained, TPAI salt was added to the solution and stirred. The I2 was added to the mixture to produce I−/I3− redox mediator. The stirring was continued to get a homogenous and gelatinized mixture. The final GPEs were used for characterization and application in DSSCs.
yI2, where x is 10, 20, 30 and 40 wt% with respect to the PAN/EC/PC mass and y is 10 mol% of TPAI. Table 2 shows the compositions of the GPEs. The masses of PAN, EC and PC were kept at 0.4, 1.5 and 1.5 g, respectively. EC and PC were mixed and stirred in a glass bottle and heated at about 110–120 °C. PAN polymer was then added with continuous stirring and heating. After a homogenous solution was obtained, TPAI salt was added to the solution and stirred. The I2 was added to the mixture to produce I−/I3− redox mediator. The stirring was continued to get a homogenous and gelatinized mixture. The final GPEs were used for characterization and application in DSSCs.
| % TPAI | PAN (g) | EC (g) | PC (g) | TPAI (g) | I2 (g) |
|---|---|---|---|---|---|
| 10 | 0.4 | 1.5 | 1.5 | 0.50 | 0.034 |
| 20 | 0.4 | 1.5 | 1.5 | 1.00 | 0.069 |
| 30 | 0.4 | 1.5 | 1.5 | 1.50 | 0.103 |
| 40 | 0.4 | 1.5 | 1.5 | 2.00 | 0.137 |
2.3. Characterization
 . The symmetrical thin-layer dummy cell with 53 μm thickness was used for the measurement of limiting current (steady-state current) densities; the cell was constituted of two platinized counter electrodes separated by the Scotch tape with size of 53 μm.86,87 The applied voltage was swept from −0.6 V to 0.6 V with the slow rate of 10 mV s−1 and
  was determined by measuring the diffusion-limited current, Jlim. The experiment was done in triplicate. The electrochemical reaction at the Pt/electrolyte was on interface due to the application of potential followed by the eqn (1),
| I3− + 2e− ⇌ 3I− | (1) |
 | (2) |
3. Results and discussion
3.1. Linear sweep voltammetry at symmetrical cell: diffusion coefficient of I3−
Linear sweep voltammetry, as well as cyclic voltammetry, is a potential technique to characterize the electrocatalytic activity of electrocatalysts.93 Fig. 3 shows the characteristic linear sweep voltammetry (LSV) curves for the electrolyte systems containing different compositions of TPAI. The current densities attain saturations for both polarities at above 0.3 V. The anodic and cathodic limiting current plateaus were relatively similar, which indicates the steady-state equilibrium conditions. It was noted that the limiting current for triiodide ions acts as iodide concentration, which showed greater concentration compare with I2.94 Hence, limiting current densities (Jlim) can only be used to determine the apparent diffusion coefficient of triiodide, , according to the following relation:
 | (3) |
The Jlim and  values for TPAI containing GPE systems are tabulated in Table 4. The value of
  increased with the increased I2 content and it was highest at 5.5 × 10⁻⁷ cm2 s−1 for 0.051 (g) I2 containing electrolyte with TPAI = 30 wt%. The values of
  decreased if more I2 was added. This is because excessive ions can hinder ion diffusion. Similar behaviour was also observed for the conductivity of these electrolytes. However, more I2 can produce more I3− ions, which may cause ion aggregation and/or micellization and results in a lower diffusion rate of I3− ions. In addition, more salt provides more ions in the electrolyte, which may reduce the volume of free space, causing lower diffusion.
3.2. Exchange current density, J0
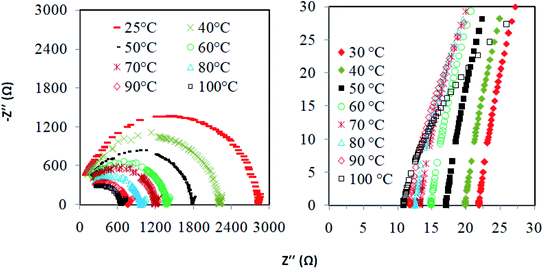
For EIS experiments, the electrolyte composition used corresponds to the electrolyte composition for the DSSC. The EIS measurements have been performed using symmetric cells fabricated with two identical Pt–electrodes95 under conditions that closely simulate the DSSC since adsorption of the electrolyte components on Pt could modify the kinetics of the I−/I3− reaction. The Rct associated with the equilibrium of eqn (1) is a measurement of the electro-catalytic activity for the tri-iodide (I3−)/iodide (I−) redox reaction.For all the four investigated GPEs, the Nyquist plots showed two semicircles: the left one was for the higher frequency region and the right one was for the lower frequency region. The high frequency intercept along the real axis represents the ohmic series resistance (Rs).93 The semicircle in the region of high frequency corresponds to the charge-transfer process (Rct) of electrolyte/electrode interface, whereas the semicircle represents the low frequency region. It was due to the Nernst diffusion process of triiodide ions.96 As shown in Fig. 3 and Table 3, it can be observed that Rs value was the smallest for 30% TPAI GPE because of its superior electrical conductivity, which revealed the improvement of DSSCs performance. Furthermore, the charge-transfer resistance Rct values for the 10%, 20%, 30% and 40% TPAI containing GPEs were calculated to be 10.00, 9.20, 3.80 and 5.10 Ω, respectively (Table 4). The smallest Rct (3.80 Ω) value indicates that the 30% TPAI GPE had a superior electrocatalytic activity compared to other GPEs.97
 , charge-transfer resistance (Rct) and exchange current density (J0) of GPEs containing different composition of iodine. J0,EIS and J0,Tafel have been calculated from EIS and Tafel polarization curves, respectively
| TPAI | Rb/ohm | Conductivity, σ (S cm−1) | Activation energy, Ea (eV) |
|---|---|---|---|
| 0% | 2900 | 2.74 × 10⁻⁵ | 19.94 |
| 10% | 42.0 | 1.89 × 10⁻³ | 11.73 |
| 20% | 36.0 | 2.21 × 10⁻³ | 11.11 |
| 30% | 22.0 | 3.62 × 10⁻³ | 10.09 |
| 40% | 30.0 | 3.26 × 10⁻³ | 11.12 |
The exchange current density, J0, i.e., the equal cathodic and anodic currents normalized to the projected electrode area at equilibrium was calculated from Rct by the following equation:
 | (4) |
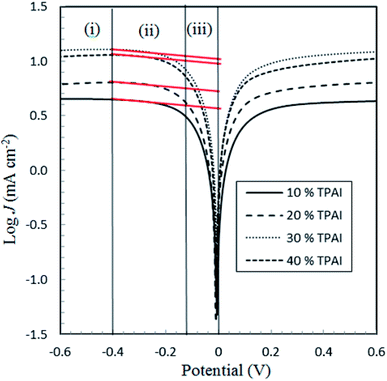
From the LSV measurements, the exchange current density, J0, has also been estimated using the Tafel polarization technique. The linear sweep voltammetry (LSV) curves obtained from symmetrical cells were converted to logarithmic current–voltage (log![[thin space (1/6-em)]](https://www.rsc.org/images/entities/char_2009.gif) J–V) Tafel polarization curves (Fig. 1).98 Tafel curves had three zones: (1) polarization region (V < 120 mV), (2) Tafel zone (120 mV < 400 mV) and (3) diffusion zone (V > 400 mV),98 which shown in Fig. 4. J0 was obtained by extrapolating the anodic or cathodic curves in its Tafel zone and the cross point at 0 V, which is displayed in Table 3. The current exchange densities estimated from LSV were closer to those obtained from EIS measurement and show a similar variational trend. The values showed an increase with an increase in TPAI concentration. At 30% TPAI containing GPEs, the J0 value was the highest, indicating the best current/charge transferring ability, as well as the minimum over potential among the GPEs. The fast consumption of I3− i.e. high exchange current being the source of less energy loss resulting in good electrode–electrolyte catalytic activity and better cell performance because the electro-catalytic reduction of triiodide ions (I3−) on the surface of a CE is a rate-determining step in a DSSC.99–101 The GPE with 30% TPAI had the optimum I2 composition, confirming the best I−/I3− electro-catalytic performance on Pt CE, which was dramatically reduced if more iodine was added in to the system. It was due to the formation of poly-iodides and ion aggregation (Fig. 2).102
J–V) Tafel polarization curves (Fig. 1).98 Tafel curves had three zones: (1) polarization region (V < 120 mV), (2) Tafel zone (120 mV < 400 mV) and (3) diffusion zone (V > 400 mV),98 which shown in Fig. 4. J0 was obtained by extrapolating the anodic or cathodic curves in its Tafel zone and the cross point at 0 V, which is displayed in Table 3. The current exchange densities estimated from LSV were closer to those obtained from EIS measurement and show a similar variational trend. The values showed an increase with an increase in TPAI concentration. At 30% TPAI containing GPEs, the J0 value was the highest, indicating the best current/charge transferring ability, as well as the minimum over potential among the GPEs. The fast consumption of I3− i.e. high exchange current being the source of less energy loss resulting in good electrode–electrolyte catalytic activity and better cell performance because the electro-catalytic reduction of triiodide ions (I3−) on the surface of a CE is a rate-determining step in a DSSC.99–101 The GPE with 30% TPAI had the optimum I2 composition, confirming the best I−/I3− electro-catalytic performance on Pt CE, which was dramatically reduced if more iodine was added in to the system. It was due to the formation of poly-iodides and ion aggregation (Fig. 2).102
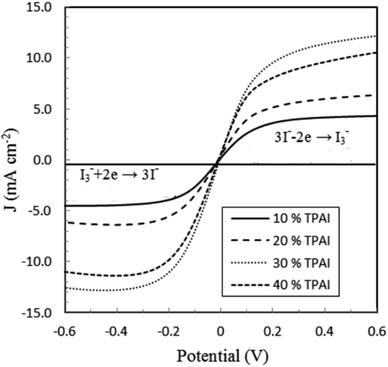 | ||
| Fig. 1 Linear sweep voltammograms (LSV) of GPEs at varying concentration of TBAI with Pt ultramicroelectrode. Scan rate: 10 mV s−1. | ||
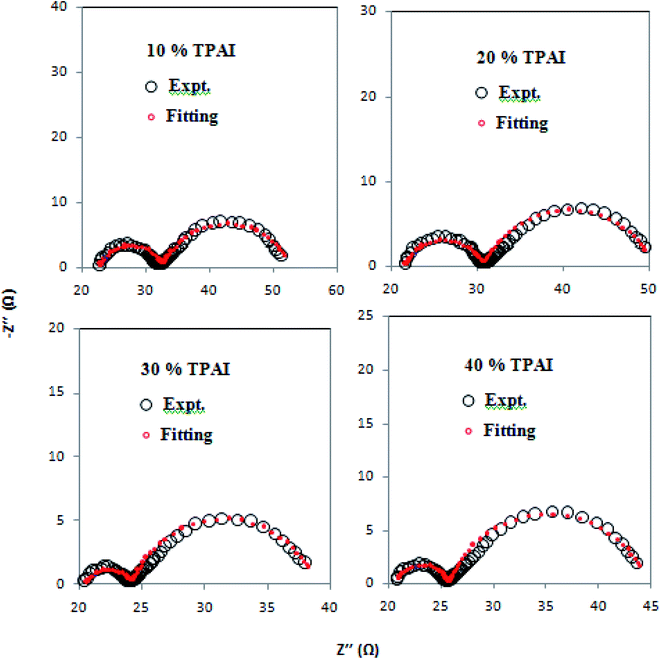 | ||
| Fig. 3 Nyquist plots of the dummy cells were fabricated with two identical Pt-ultramicroelectrodes with different percentages of TPAI salt containing GPEs. | ||
3.3. Ionic conductivity measurements
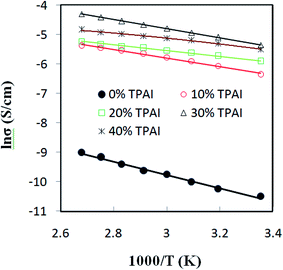
Fig. 4 presents the Nyquist plots of imaginary impedance versus real impedance for PAN-EC-PC-TPAI-I2 GPEs with a varying weight percentage of TPAI (0% and 30%) at different temperatures. For 0 wt% TPAI, the Nyquist plots take the form of a semicircle and GPE with TPAI salt showed only a spike in their Nyquist plots. The occurrence of spike in the complex impedance plots may be ascribed to the accumulation of charges at the electrolyte–electrode (blocking electrode) interface, which is commonly described as the double layer capacitive effect (Cdl).102 From the Nyquist plots, the bulk resistance, Rb, was estimated and used to calculate ionic conductivity (σ) of the GPEs. Table 4 exhibits the thickness, t, Rb and σ for the GPEs. It was evident that the bulk impedance decreased with the increased percentage of TPAI salt, showing the lowest value of 22 Ω at 30% TPAI containing GPE. Consequently, σ increased with the increase in TPAI concentration and reached the highest value of 3.62 × 10⁻³ S cm−1 at 30% TPAI and then decreased with further addition of salt. It can be interpreted considering that in the initial stage the conductivity increases due to the addition of more ions in the polymer matrix until it reaches a maximum and after that ion recombination dominates all other processes favorable for conductivity.103Fig. 5 shows ln![[thin space (1/6-em)]](https://www.rsc.org/images/entities/char_2009.gif) σ versus 1000/T for the GPEs containing different percentages of TPAI. The later relation follows the Arrhenius equation of the following form:
σ versus 1000/T for the GPEs containing different percentages of TPAI. The later relation follows the Arrhenius equation of the following form:
 | (5) |
3.4. FTIR spectrophotometric analysis
FTIR spectrum of pure PAN is presented in Fig. 6 and the peaks assignments are shown in Table 5. For the pure PAN, the distinguishably sharp peak at 2244 cm−1 corresponds to –C![[triple bond, length as m-dash]](https://www.rsc.org/images/entities/char_e002.gif) N functional group stretching vibration.104–106 The C–H asymmetrical stretching vibration mode of –CH2– groups in PAN was observed at 2937 cm−1 as a broad peak in the spectrum.107–110 Another sharp peak at 1454 cm−1 represented the C–H bending of –CH2– groups in PAN.105,107,108 The combined vibration of C–H bending and wagging in CH and –CH2– groups was assigned at 1358 cm−1.111,112 A broad peak at 1073 cm−1 was assigned for the skeletal vibration, C–C symmetrical stretching of C–C
N functional group stretching vibration.104–106 The C–H asymmetrical stretching vibration mode of –CH2– groups in PAN was observed at 2937 cm−1 as a broad peak in the spectrum.107–110 Another sharp peak at 1454 cm−1 represented the C–H bending of –CH2– groups in PAN.105,107,108 The combined vibration of C–H bending and wagging in CH and –CH2– groups was assigned at 1358 cm−1.111,112 A broad peak at 1073 cm−1 was assigned for the skeletal vibration, C–C symmetrical stretching of C–C![[triple bond, length as m-dash]](https://www.rsc.org/images/entities/char_e002.gif) N in PAN polymer.111,113 A peak at 1621 cm−1 was allocated for O–H bending of absorbed water.114
N in PAN polymer.111,113 A peak at 1621 cm−1 was allocated for O–H bending of absorbed water.114
| Component | Wavenumber (cm−1) | Assignments | Literature |
|---|---|---|---|
| PAN | 2937 | C–H asymmetrical stretching of –CH2– groups | 107–110 |
| 2244 | C![[triple bond, length as m-dash]](https://www.rsc.org/images/entities/char_e002.gif) N stretching of –C N stretching of –C![[triple bond, length as m-dash]](https://www.rsc.org/images/entities/char_e002.gif) N groups N groups |
104–106 | |
| 1621 | O–H bending of the absorbed water | 114 | |
| 1454 | C–H bending of –CH2– groups | 105, 107 and 108 | |
| 1358 | C–H bending of CH groups + C–H wagging of –CH2–groups | 111 and 112 | |
| 1073 | C–C symmetrical stretching of C–CN | 111 and 113 | |
| EC | 2931 | CH2 stretching | 115 |
| 1866 | C![[double bond, length as m-dash]](https://www.rsc.org/images/entities/char_e001.gif) O stretching O stretching |
64 and 115–117 | |
| 1484 | CH2 scissoring/CH2 bending | 115 and 116 | |
| 1420 | CH2 wagging | 64 and 115 | |
| 1392 | CH2 wagging | 64 and 115 | |
| 1218 | CH2 twisting | 115 | |
| 1218 | CH2 twisting | 115 | |
| 1158 | CH2 twisting/skeletal stretching | 115 and 116 | |
| 1071 | Ring stretching/ring breathing | 64 and 115 | |
| 970 | Ring stretching/skeletal stretching | 64 and 115 | |
| 891 | Ring breathing | 64 and 115 | |
| 770 | CH2 rocking | 115 | |
| 714 | C![[double bond, length as m-dash]](https://www.rsc.org/images/entities/char_e001.gif) O bending/ring bending O bending/ring bending |
115 and 118 | |
| PC | 2931 | CH2 stretching | 115 |
| 1781 | C![[double bond, length as m-dash]](https://www.rsc.org/images/entities/char_e001.gif) O stretching O stretching |
64, 116, 117, 119 and 120 | |
| 1485 | CH2 scissoring/CH2 bending | 116 | |
| 1388 | CH2 wagging | 64 | |
| 1175 | CH2 twisting/skeletal stretching | 116 | |
| 1117 | COC asymmetrical vibration | 121 | |
| 1071 | Ring stretching/ring breathing | 64 | |
| 1045 | (CO3)2− symmetric stretching vibration | 122 | |
| 970 | Ring stretching/skeletal stretching | 116 | |
| 891 | Ring breathing | 64 | |
| 775 | CH2 rocking | 115 | |
| 710 | C![[double bond, length as m-dash]](https://www.rsc.org/images/entities/char_e001.gif) O bending/ring bending O bending/ring bending |
115 and 118 | |
| GPEs | 2964 | CH2 asymmetrical stretching vibrations (up-shifting from 2937 cm−1) | |
| 1789 | C![[double bond, length as m-dash]](https://www.rsc.org/images/entities/char_e001.gif) O stretching (up-shifted from 1866 cm−1) O stretching (up-shifted from 1866 cm−1) |
||
| 1772 | C![[double bond, length as m-dash]](https://www.rsc.org/images/entities/char_e001.gif) O stretching (down-shifted from 1781 cm−1) O stretching (down-shifted from 1781 cm−1) |
||
| 1480 | CH2 scissoring/CH2 bending (down-shifted from 1485 cm−1) | ||
| 1389 | CH2 wagging (down-shifted from 1392 cm−1) | ||
| 1354 | C–H bending of CH groups + C–H wagging of –CH2– groups (down-shifted from 1358 cm−1) | ||
| 1159 | CH2 twisting/skeletal stretching (down-shifted from 1178 cm−1) | ||
| 1118 | C–C–C bending (up-shifted from 1109 cm−1) | ||
| 1051 | C–C symmetrical stretching of C–CN (down-shifted from 1073 cm−1) |
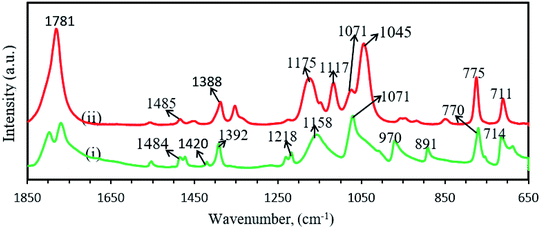
Fig. 7 shows the FTIR spectra of ethylene carbonate (EC) and propylene carbonate (PC) and corresponding peak vibrations are depicted in Table 5. The IR spectrum of EC contains a number of different modes of CH2 vibrations at different wave-numbers, such as stretching at 2931 cm−1,115 scissoring/bending at 1484 cm−1,115,116 wagging 1420 and 1392 cm−1,64,115 twisting at 1218 cm−1,115 twisting/skeletal stretching at 1158 cm−1.115,116 The small peak at 1866 cm−1 was assigned for C![[double bond, length as m-dash]](https://www.rsc.org/images/entities/char_e001.gif) O stretching vibration.64,115–118 The peaks at 1071, 970 and 891 cm−1 were designated for ring stretching/ring breathing, ring stretching/skeletal stretching and ring breathing, respectively.64,115 Rocking of CH2 and bending/ring bending of C
O stretching vibration.64,115–118 The peaks at 1071, 970 and 891 cm−1 were designated for ring stretching/ring breathing, ring stretching/skeletal stretching and ring breathing, respectively.64,115 Rocking of CH2 and bending/ring bending of C![[double bond, length as m-dash]](https://www.rsc.org/images/entities/char_e001.gif) O were observed at 770 and 714 cm−1, respectively.115,118 The FTIR peaks of PC (Fig. 5) were nearly same as EC, except C
O were observed at 770 and 714 cm−1, respectively.115,118 The FTIR peaks of PC (Fig. 5) were nearly same as EC, except C![[double bond, length as m-dash]](https://www.rsc.org/images/entities/char_e001.gif) O stretching vibration at 1781 cm−1 (ref. 64, 116, 117, 119 and 120) and COC asymmetrical vibration at 1117 cm−1.121 The sharp peak at 1045 cm−1 was identified as (CO3)2− symmetric stretching vibration.122
O stretching vibration at 1781 cm−1 (ref. 64, 116, 117, 119 and 120) and COC asymmetrical vibration at 1117 cm−1.121 The sharp peak at 1045 cm−1 was identified as (CO3)2− symmetric stretching vibration.122
Fig. 8 shows the FTIR spectra for PAN, EC, PC, TPAI and 10%, 20%, 30% and 40% TPAI containing GPEs. In GPEs, the original peak 2937 cm−1 for CH2 asymmetrical stretching vibrations downshifts from 2964 cm−1, 1485 for CH2 scissoring/CH2 bending downshifts to 1480 cm−1, 1392 for CH2 wagging up-shifts to 1389 cm−1 and CH2 twisting/skeletal stretching downshifts from 1178 to 1159 cm−1. The C![[double bond, length as m-dash]](https://www.rsc.org/images/entities/char_e001.gif) O stretching mode of vibration at 1866 and 1781 cm−1 shifts to 1789 and 1772 cm−1, respectively. Furthermore, C–H bending (CH groups) and wagging (–CH2–) mode of vibration downshift from 1358 to 1354 cm−1. Similarly, C–C–C bending up-shift from 1109 to 1118 cm−1 and C–C symmetrical stretching of C–CN downshifts from 1073 to 1051 cm−1.
O stretching mode of vibration at 1866 and 1781 cm−1 shifts to 1789 and 1772 cm−1, respectively. Furthermore, C–H bending (CH groups) and wagging (–CH2–) mode of vibration downshift from 1358 to 1354 cm−1. Similarly, C–C–C bending up-shift from 1109 to 1118 cm−1 and C–C symmetrical stretching of C–CN downshifts from 1073 to 1051 cm−1.
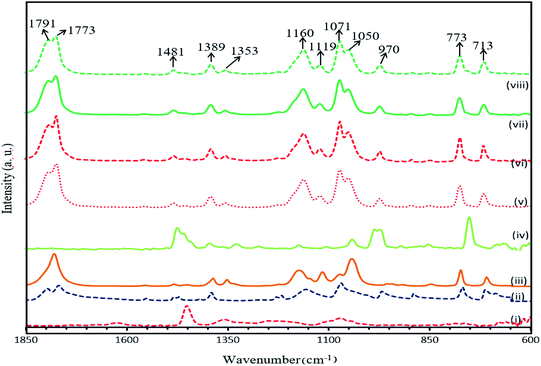 | ||
| Fig. 8 FTIR spectra of (i) PAN, (ii) EC, (iii) PC, (iv) TPAI, (v) 10% TPAI, (vi) 20% TPAI, (vii) 30% TPAI, (viii) 40% TPAI. | ||
3.5. XRD analysis
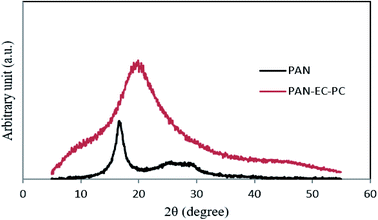
To perform the structural characteristics of GPEs with different percentages of TPAI, X-ray diffraction studies were carried out. Fig. 9 exhibits the X-ray diffraction patterns of (i) PAN and (ii) PAN-EC-PC-0% TPAI GPE, respectively. Fig. 10 shows XRD pattern of PAN-EC-PC-xTPAI-I2 GPEs where x stands for 10%, 20%, 30% and 40%. Based on the equatorial reflections in diffraction patterns of PAN,123,124 it can be concluded that PAN had only two-dimensional order without periodicity along the chain axis. Therefore, PAN is a paracrystalline or laterally ordered polymer. PAN crystals usually show two diffraction peaks at 2θ ≈ 17 and 29°.125 According to the literature, orthorhombic lattice describes the crystal structure of PAN whereas dry PAN has hexagonal lattice.126–128 The diffraction patterns were also indexed as (010) and (300) at 2θ ≈ 17 and 29°, respectively, on the basis of hexagonal packing of PAN molecules.129,130 However, the XRD pattern of the pure PAN has semi-crystalline structure and the crystalline peak at 2θ ≈ 17° corresponds to orthorhombic (110) reflection.131–133 The addition of salt (TPAI) into PAN matrix results in a significant reform of XRD pattern observed in terms of (1) a systematic shifting and enlargement of the main peak (2θ ≈ 17°) of pure PAN toward a higher angle (2θ ≈ 20°) in PAN-EC-PC GPE and (2) generation of new peaks at 2θ ≈ 10° and 20° for 10%, 20%, 30% and 40% TPAI containing GPEs, which shown in Fig. 10. There was an up-shifting of XRD peak due to the increase in d-spacing of the polymer matrix, which is the evidence for polymer–salt interaction and complexation of cation (TPA+ ion) with lone pair electron containing site (–CN) in the host polymer matrix. Furthermore, the addition of TPAI containing long propyl chain (CH3–CH2–CH2–) prevents polymer chain reorganization causing significant disorder in the polymer chains that promotes the interaction between them. TPA+ ions may break the regular arrangement of PAN polymer backbone and aggregate through non-polar hydrophobic chain initiated micellization, which severely disturbs the order of crystalline phase of polymer causing development of amorphousness in the GPEs. Furthermore, microcrystalline arrangements create body centered cubic (BCC), Im3m structure in GPE on dye-TiO2 surface that may contain nanochannels promoting migration/conduction of ion results enhanced ionic conductivity.134,135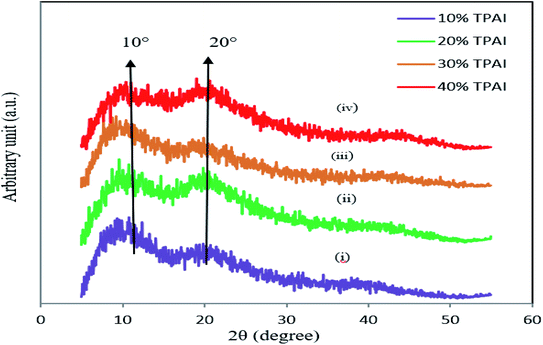 | ||
| Fig. 10 XRD pattern of (i) PAN-EC-PC-10% TPAI-I2, (ii) PAN-EC-PC-20% TPAI-I2, (iii) PAN-EC-PC-30% TPAI-I2 and (iv) PAN-EC-PC-40% TPAI-I2 GPEs. | ||
3.6. Computational study
A good understanding on the optimized structure with band gap of HOMO and LUMO energy levels is pivotal for the successful application of an electrolyte in a solar cell. Hence, structural optimization and band gap energies of PAN, PAN (one), TPAI-only, TPAI-PAN, and TPAI-PAN-one-only compounds are carried out by using B3LYP/6-31G (d,p) parameters. The optimized structures of these compounds are shown in Fig. 11, and from Fig. 12 the band gap energies of the frontier orbitals are 9.655, 9.008, 7.937, 7.035 and 6.612 eV for the compounds PAN, PAN-one, TPAI only, TPAI-PAN-one-only and TPAI-PAN, respectively.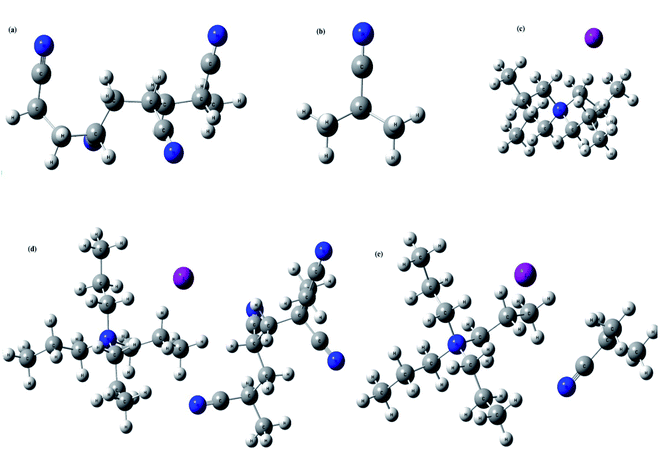 | ||
| Fig. 11 Optimized structures of, (a) PAN, (b) PAN-one, (c) TPAI only, (d) TPAI-PAN, and (e) TPAI-PAN-one. | ||
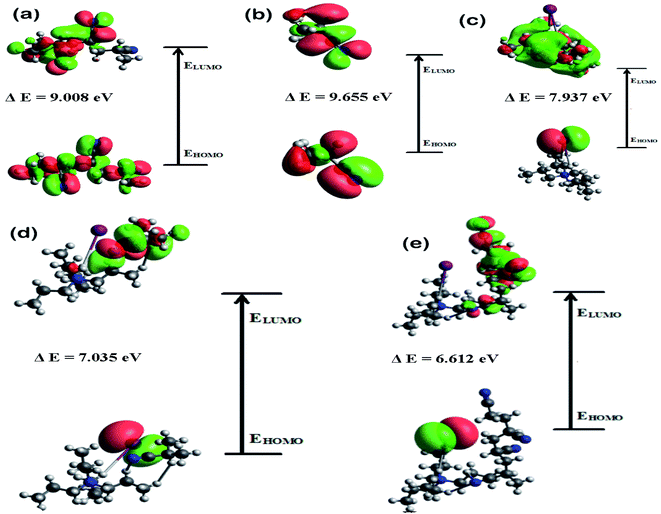 | ||
| Fig. 12 HOMO–LUMO band gap energies of, (a) PAN, (b) PAN-one, (c) TPAI-only, (d) TPAI-PAN-one only, and (e) TPAI-PAN. | ||
Several parameters associated with the intra-molecular charge carrying ability, especially band gap energy of the frontier orbitals.136 Narrowing the band gap stimulates fast charge transfer rate. From Fig. 12, individual components PAN, PAN-one and TPAI-only show broader band gap than the mixers of TPAI-PAN and TPAI-PAN-one only, which involved with the red shifting of absorption spectra. Besides, the combination of TPAI-PAN exhibits a narrower frontier orbitals band gap (i.e., 6.612 eV) than that of the PAN-TPAI-one-only (i.e., 7.035 eV). Thus, TPAI-PAN has a higher intra-molecular charge transfer ability than TPAI-PAN-one-only electrolyte. From the computational study, in GPE the combination of PAN with 30% TPAI will be the promising electrolytic combination.
3.7. DSSC efficiency
The DSSCs with the optimized GPEs were fabricated having the cell structure TiO2/N3 dye/GPE/Pt and tested. Following the similar trend of conductivity versus TPAI concentration, JSC, as well as efficiency (η) of DSSC, increases with the addition of TPAI in the GPEs attaining the maximum of JSC (19.75 mA cm−2) and η (4.76%) for the 30 wt% TPAI, respectively and then, decrease with further addition of TPAI. The VOC was also highest (553.8 mV) for 30 wt% TPAI containing GPE.4. Conclusion
The EIS, LSV, FTIR and XRD techniques have been utilized for the characterization of the prepared GPEs. EIS studies showed that the GPE containing 30% TPAI had the lowest bulk impedance and highest ionic conductivity (3.62 × 10⁻³ S cm−1). Temperature-dependent ionic conductivity study confirmed that all GPEs obeyed the Arrhenius rule. The 30% TPAI containing GPE exhibited the lowest activation energy. estimated from the LSV experiments showed that the triiodide diffusion coefficient,
  was maximum with 23.41 × 10⁻⁷ cm2 s−1 at 0.051 g I2 and 30 wt% TPAI containing electrolyte, which is similar with conductivity results. Exchange current densities (J0) have been calculated from EIS and LSV measurements, which are reasonably equal to each other. The J0 is highest for 30% TPAI GPE, which indicated the superiority among the other GPEs. Shifting of FTIR peaks in the GPEs indicates the interaction between PAN and EC/PC. An up-shifting of XRD peak and gradual reduction in intensity followed by diminishing of the peak intensity on continued addition of TPAI in GPEs is evident of the polymer–salt interaction. On the other side, TPAI-PAN based GPE possesses lowest Frontier orbital band gap, indicating the enhanced conductivity leads to maximum efficiency. The DSSC showed the maximum JSC (19.75 mA cm−2) and VOC (553.8 mV) JSC and hence highest efficiency η (4.76%) for the 30 wt% TPAI containing GPE.
Conflicts of interest
There are no conflicts to declare.Acknowledgements
We acknowledge the project “Development of Gel Polymer Electrolytes and their structural, electrochemical and electrocatalytic characterizations for Dye-sensitized solar cells application” financed by the University Grants Commission (UGC), People's Republic of Bangladesh, in the year 2018.References
- S. Tan, J. Zhai, B. Xue, M. Wan, Q. Meng, Y. Li, L. Jiang and D. Zhu, Langmuir, 2004, 20(7), 2934–2937 CrossRef CAS PubMed.
- A. F. Nogueira, C. Longo and M. A. De Paoli, Coord. Chem. Rev., 2004, 248(13–14), 1455–1468 CrossRef CAS.
- V. C. Nogueira, C. Longo, A. F. Nogueira, M. A. Soto-Oviedo and M.-A. De Paoli, J. Photochem. Photobiol., A, 2006, 181, 226–232 CrossRef CAS.
- J. E. Benedetti, M. A. de Paoli and A. F. Nogueira, Chem. Commun., 2008, 9, 1121–1123 RSC.
- J. N. de Freitas, A. de Souza Gonçalves, M.-A. De Paoli, J. R. Durrant and A. F. Nogueira, Electrochim. Acta, 2008, 53, 7166–7172 CrossRef.
- A. R. S. Priya, A. Subramania, Y. S. Jung and K. J. Kim, Langmuir, 2008, 24, 9816–9819 CrossRef CAS PubMed.
- A. Chamaani, N. Chawla, M. Safa and B. El-Zahab, Electrochim. Acta, 2017, 235, 56–63 CrossRef CAS.
- M. S. Su'ait, M. Y. A. Rahman and A. Ahmad, Sol. Energy, 2015, 115, 452–470 CrossRef.
- D. K. Shah, Y.-H. Son, H.-R. Lee, M. S. Akhtar, C. Y. Kim and O.-B. Yang, Chem. Phys. Lett., 2020, 754, 137756 CrossRef.
- F. I. Chowdhury, M. H. Buraidah, A. K. Arof, B.-E. Mellander and I. M. Noor, Sol. Energy, 2020, 196, 379–388 CrossRef CAS.
- F. I. Chowdhury, I. Khalil, M. U. Khandaker, M. M. Rabbani, J. Uddin and A. K. Arof, Ionics, 2020, 1–10 Search PubMed.
- F. I. Chowdhury, M. H. Buraidah, A. K. Arof, J. Islam, M. R. Rahman and J. Uddin, J. Appl. Sci. Process Eng., 2021, 8, 750–764 CrossRef.
- S. Venkatesan, I.-P. Liu, C.-M. T. Shan, H. Teng and Y.-L. Lee, Chem. Eng. J., 2020, 394, 124954 CrossRef CAS.
- J. H. Ri, J. Jin, J. Xu, T. Peng and K. Il Ryu, Electrochim. Acta, 2016, 201, 251–259 CrossRef CAS.
- D. A. Chalkias, N. E. Verykokkos, E. Kollia, A. Petala, V. Kostopoulos and G. C. Papanicolaou, Sol. Energy, 2021, 222, 35–47 CrossRef CAS.
- U. H. A. Azeez, A. Gunasekaran, A. Sorrentino, A. Syed, N. Marraiki and S. Anandan, Polym. Bull., 2021, 1–14 Search PubMed.
- D.-T. Nguyen, T. Iwai and K. Taguchi, Energy Rep., 2020, 6, 872–876 CrossRef.
- P. Karthika and S. Ganesan, RSC Adv., 2020, 10, 14768–14777 RSC.
- F. H. Muhammad and T. Winie, Optik, 2020, 208, 164558 CrossRef CAS.
- F. I. Chowdhury, M. U. Khandaker, Y. M. Amin, M. Z. Kufian and H. J. Woo, Ionics, 2017, 23(2), 275–284 CrossRef CAS.
- V. Elayappan, V. Murugadoss, Z. Fei, P. J. Dyson and S. Angaiah, Eng. Sci., 2020, 10, 78–84 CAS.
- B.-C. Xiao and L.-Y. Lin, J. Colloid Interface Sci., 2020, 571, 126–133 CrossRef CAS PubMed.
- E. Praveen, I. J. Peter, A. M. Kumar, K. Ramachandran and K. Jayakumar, Mater. Lett., 2020, 276, 128202 CrossRef CAS.
- M. H. Buraidah, S. Shah, L. P. Teo, F. I. Chowdhury, M. A. Careem, I. Albinsson, B.-E. Mellander and A. K. Arof, Electrochim. Acta, 2017, 245, 846–853 CrossRef CAS.
- V. Selvanathan, R. Yahya, M. H. Ruslan, K. Sopian, N. Amin, M. Nour, H. Sindi, M. Rawa and M. Akhtaruzzaman, Polymers, 2020, 12, 516 CrossRef CAS PubMed.
- A. J. Palamba, N. Sari, A. W. M. Diah and S. Saehana, in Journal of Physics: Conference Series, IOP Publishing, 2021, vol. 1763, p. 12090 Search PubMed.
- V. Di Noto, N. Boaretto, E. Negro and G. Pace, J. Power Sources, 2010, 195, 7734–7742 CrossRef CAS.
- V. P. Hoang Huy, S. So and J. Hur, Nanomaterials, 2021, 11, 614 CrossRef PubMed.
- S. M. Lim, J. Moon, G. H. Choi, U. C. Baek, J. M. Lim, J. T. Park and J. H. Kim, Nanomaterials, 2019, 9, 1418 CrossRef CAS PubMed.
- K. Prabakaran, A. K. Palai, S. Mohanty and S. K. Nayak, RSC Adv., 2015, 5, 66563–66574 RSC.
- S. Yuan, Q. Tang, B. Hu, C. Ma, J. Duan and B. He, J. Mater. Chem. A, 2014, 2, 2814–2821 RSC.
- J. H. Kim, M.-S. Kang, Y. J. Kim, J. Won, N.-G. Park and Y. S. Kang, Chem. Commun., 2004, 14, 1662–1663 RSC.
- M. Imperiyka, A. Ahmad, S. A. Hanifah and F. Bella, Phys. B, 2014, 450, 151–154 CrossRef CAS.
- A. D. S. Goņalves, M. R. Davolos, N. Masaki, S. Yanagida, S. Mori and A. F. Nogueira, J. Appl. Phys., 2009, 106, 10803–10807 Search PubMed.
- J. N. de Freitas, A. F. Nogueira and M.-A. De Paoli, J. Mater. Chem., 2009, 19, 5279–5294 RSC.
- Q. Li, X. Chen, Q. Tang, H. Cai, Y. Qin, B. He, M. Li, S. Jin and Z. Liu, J. Power Sources, 2014, 248, 923–930 CrossRef CAS.
- Z. Lan, J. Wu, J. Lin and M. Huang, C. R. Chim., 2010, 13, 1401–1405 CrossRef CAS.
- N. Chawla, A. Chamaani, M. Safa and B. El-Zahab, J. Electrochem. Soc., 2017, 164, A6303–A6307 CrossRef CAS.
- M. Vittadello, D. I. Waxman, P. J. Sideris, Z. Gan, K. Vezzù, E. Negro, A. Safari, S. G. Greenbaum and V. Di Noto, Electrochim. Acta, 2011, 57, 112–122 CrossRef CAS.
- H. L. Hsu, C. F. Tien, Y. T. Yang and J. Leu, Electrochim. Acta, 2013, 91, 208–213 CrossRef CAS.
- N. Tiautit, C. Puratane, S. Panpinit and S. Saengsuwan, Energy Procedia, 2014, 56, 378–385 CrossRef CAS.
- N. M. Saidi, N. K. Farhana, S. Ramesh and K. Ramesh, Sol. Energy, 2021, 216, 111–119 CrossRef CAS.
- N. Mariotti, M. Bonomo, L. Fagiolari, N. Barbero, C. Gerbaldi, F. Bella and C. Barolo, Green Chem., 2020, 22, 7168–7218 RSC.
- D. C. Bharati, H. Kumar and A. L. Saroj, Mater. Res. Express, 2020, 6, 125360 CrossRef.
- A. Allaoui, S. Bai, H. Cheng and J. Bai, Compos. Sci. Technol., 2002, 62, 1993–1998 CrossRef CAS.
- J. M. Abisharani, R. Dineshkumar, S. Devikala, M. Arthanareeswari and S. Ganesan, Mater. Res. Express, 2020, 7, 25507 CrossRef CAS.
- S. A. Abrol, C. Bhargava and P. K. Sharma, Mater. Res. Express, 2020, 7, 106202 CrossRef CAS.
- H. C. Hassan, Z. H. Z. Abidin, F. I. Chowdhury and A. K. Arof, Int. J. Photoenergy, 2016, 3685210 Search PubMed.
- K. Gohel, D. K. Kanchan, H. K. Machhi, S. S. Soni and C. Maheshwaran, Mater. Res. Express, 2020, 7, 25301 CAS.
- M. G. Nair, S. R. Mohapatra, M.-R. Garda, B. Patanair, A. Saiter-Fourcin and S. Thomas, Mater. Res. Express, 2020, 7, 64005 CrossRef CAS.
- L. Fagiolari, M. Bonomo, A. Cognetti, G. Meligrana, C. Gerbaldi, C. Barolo and F. Bella, ChemSusChem, 2020, 13(24), 6562–6573 CrossRef CAS PubMed.
- F. Bella, L. Porcarelli, D. Mantione, C. Gerbaldi, C. Barolo, M. Grätzel and D. Mecerreyes, Chem. Sci., 2020, 11, 1485–1493 RSC.
- S. Galliano, F. Bella, M. Bonomo, F. Giordano, M. Grätzel, G. Viscardi, A. Hagfeldt, C. Gerbaldi and C. Barolo, Sol. RRL, 2021, 2000823 CrossRef.
- S. Galliano, F. Bella, M. Bonomo, G. Viscardi, C. Gerbaldi, G. Boschloo and C. Barolo, Nanomaterials, 2020, 10, 1585 CrossRef CAS PubMed.
- C. Law, S. C. Pathirana, X. Li, A. Y. Anderson, P. R. F. Barnes, A. Listorti, T. H. Ghaddar and B. C. O′Regan, Adv. Mater., 2010, 22, 4505–4509 CrossRef CAS.
- F. Bella, C. Gerbaldi, C. Barolo and M. Grätzel, Chem. Soc. Rev., 2015, 44, 3431–3473 RSC.
- K. Zhu, S.-R. Jang and A. J. Frank, Energy Environ. Sci., 2012, 5, 9492–9495 RSC.
- M. H. Khanmirzaei, S. Ramesh and K. Ramesh, Sci. Rep., 2015, 5, 18056 CrossRef CAS.
- P. Hu, J. Chai, Y. Duan, Z. Liu, G. Cui and L. Chen, J. Mater. Chem. A, 2016, 4, 10070–10083 RSC.
- Y. Wang, Sol. Energy Mater. Sol. Cells, 2009, 93, 1167–1175 CrossRef CAS.
- H. K. Jun, M. A. Careem and A. K. Arof, Renewable Sustainable Energy Rev., 2013, 22, 148–167 CrossRef CAS.
- G. D. Sharma, D. Daphnomili, P. A. Angaridis, S. Biswas and A. G. Coutsolelos, Electrochim. Acta, 2013, 102, 459–465 CrossRef CAS.
- S. J. Lim, Y. S. Kang and D.-W. Kim, Electrochim. Acta, 2011, 56, 2031–2035 CrossRef CAS.
- B. Huang, Z. Wang, G. Li, H. Huang, R. Xue, L. Chen and F. Wang, Solid State Ionics, 1996, 85, 79–84 CrossRef CAS.
- M. Patel, K. G. Chandrappa and A. J. Bhattacharyya, Electrochim. Acta, 2008, 54, 209–215 CrossRef CAS.
- S. S. Sekhon, N. Arora and S. A. Agnihotry, Solid State Ionics, 2000, 136, 1201–1204 CrossRef.
- A. Subramania, N. T. K. Sundaram and G. V. Kumar, J. Power Sources, 2006, 153, 177–182 CrossRef CAS.
- J. Y. Song, Y. Y. Wang and C. C. Wan, J. Power Sources, 1999, 77, 183–197 CrossRef CAS.
- D. F. Watson and G. J. Meyer, Coord. Chem. Rev., 2004, 248, 1391–1406 CrossRef CAS.
- Y. Liu, A. Hagfeldt, X. R. Xiao and S. E. Lindquist, Sol. Energy Mater. Sol. Cells, 1998, 55, 267–281 CrossRef CAS.
- S. Pelet, J.-E. Moser and M. Grätzel, J. Phys. Chem. B, 2000, 104, 1791–1795 CrossRef CAS.
- K. Zhu, N. Kopidakis, N. R. Neale, J. Van De Lagemaat and A. J. Frank, J. Phys. Chem. B, 2006, 110, 25174–25180 CrossRef CAS.
- T. M. W. J. Bandara, T. Svensson, M. A. K. L. Dissanayake, M. Furlani, W. J. M. J. S. R. Jayasundara, P. S. L. Fernando, I. Albinsson and B. E. Mellander, J. Natl. Sci. Found. Sri Lanka, 2013, 41, 175–184 CrossRef CAS.
- O. A. Ileperuma, M. A. K. L. Dissanayake and S. Somasundaram, Electrochim. Acta, 2002, 47, 2801–2807 CrossRef CAS.
- M. Dissanayake, L. Bandara, R. S. P. Bokalawala, P. Jayathilaka, O. A. Ileperuma and S. Somasundaram, Mater. Res. Bull., 2002, 37, 867–874 CrossRef CAS.
- A. Joseph, M. M. Xavier, G. Zyła, P. R. Nair, A. S. Padmanabhan and S. Mathew, RSC Adv., 2017, 7, 16623–16636 RSC.
- N. Papageorgiou, Coord. Chem. Rev., 2004, 248, 1421–1446 CrossRef CAS.
- G. Boschloo and A. Hagfeldt, Acc. Chem. Res., 2009, 42, 1819–1826 CrossRef CAS PubMed.
- M. H. Buraidah, S. Shah, L. P. Teo, F. I. Chowdhury, M. A. Careem, I. Albinsson, B. E. Mellander and A. K. Arof, Electrochim. Acta, 2017, 245, 846–853 CrossRef CAS.
- L. P. Teo, M. H. Buraidah and A. K. Arof, Ionics, 2020, 1–24 Search PubMed.
- O. A. Ileperuma, M. Dissanayake, S. Somasunderam and L. Bandara, Sol. Energy Mater. Sol. Cells, 2004, 84, 117–124 CrossRef CAS.
- M. Dissanayake, C. A. Thotawatthage, G. K. R. Senadeera, T. Bandara, W. Jayasundera and B.-E. Mellander, J. Photochem. Photobiol., A, 2012, 246, 29–35 CrossRef CAS.
- T. M. W. J. Bandara, W. J. M. J. S. R. Jayasundara, M. A. K. L. Dissanayake, M. Furlani, I. Albinsson and B. E. Mellandera, Electrochim. Acta, 2013, 109, 609–616 CrossRef CAS.
- G. R. A. Kumara, C. Kehelpannala, C. S. K. Ranasinghe, E. N. Jayaweera, R. M. G. Rajapakse and O. A. Ileperuma, Chem. Lett., 2014, 43, 681–683 CrossRef CAS.
- H. C. Hassan, Z. H. Z. Abidin, M. A. Careem and A. K. Arof, High Perform. Polym., 2014, 26, 647–652 CrossRef.
- E. N. Jayaweera, C. S. K. Ranasinghe, G. R. A. Kumara, W. Wanninayake, K. G. C. Senarathne, K. Tennakone, R. M. G. Rajapakse and O. A. Ileperuma, Electrochim. Acta, 2015, 152, 360–367 CrossRef CAS.
- T. Bandara, W. Jayasundara, H. Fernado, M. Dissanayake, L. A. A. De Silva, I. Albinsson, M. Furlani and B.-E. Mellander, J. Appl. Electrochem., 2015, 45, 289–298 CrossRef CAS.
- W. Wanninayake, K. Premaratne, G. R. A. Kumara and R. M. G. Rajapakse, Electrochim. Acta, 2016, 191, 1037–1043 CrossRef CAS.
- ASTM G106-89(2015), Standard Practice for Verification of Algorithm and Equipment for Electrochemical Impedance Measurements, ASTM International, West Conshohocken, PA, 2015, http://www.astm.org Search PubMed.
- ASTM E168-16, Standard Practices for General Techniques of Infrared Quantitative Analysis, ASTM International, West Conshohocken, PA, 2016, http://www.astm.org Search PubMed.
- ASTM E1252-98(2021), Standard Practice for General Techniques for Obtaining Infrared Spectra for Qualitative Analysis, ASTM International, West Conshohocken, PA, 2021, http://www.astm.org Search PubMed.
- ASTM D5380-93(2021), Standard Test Method for Identification of Crystalline Pigments and Extenders in Paint by X-Ray Diffraction Analysis, ASTM International, West Conshohocken, PA, 2021, http://www.astm.org Search PubMed.
- M. Wu, X. Lin, L. Wang, W. Guo, Y. Wang, J. Xiao, A. Hagfeldt and T. Ma, J. Phys. Chem. C, 2011, 115, 22598–22602 CrossRef CAS.
- N. Papageorgiou, Y. Athanassov, M. Armand, P. Bonhote, H. Pettersson, A. Azam and M. Grätzel, J. Electrochem. Soc., 1996, 143, 3099–3108 CrossRef CAS.
- S. Sakurai, Y. Kawamata, M. Takahashi and K. Kobayashi, J. Oleo Sci., 2011, 646, 639–646 CrossRef.
- R. Cruz, D. A. P. Tanaka and A. Mendes, Sol. Energy, 2012, 86, 716–724 CrossRef CAS.
- M. Wu, Y. Wang, X. Lin, N. Yu, L. Wang, L. Wang, A. Hagfeldt and T. Ma, Phys. Chem. Chem. Phys., 2011, 13, 19298–19301 RSC.
- M. Chatti, J. L. Gardiner, M. Fournier, B. Johannessen, T. Williams, T. R. Gengenbach, N. Pai, C. Nguyen, D. R. MacFarlane, R. K. Hocking and A. N. Simonov, Electrochemical methods fundamentals and Applications, 2019, vol. 22, 5, pp. 457–465 Search PubMed.
- Q. Tai and X. Z. Zhao, J. Mater. Chem. A, 2014, 2, 13207–13218 RSC.
- S. Yun, A. Hagfeldt and T. Ma, Adv. Mater., 2014, 26, 6210–6237 CrossRef CAS.
- B. C. O'Regan and J. R. Durrant, Acc. Chem. Res., 2009, 42, 1799–1808 CrossRef.
- A. Agresti, S. Pescetelli, E. Gatto, M. Venanzi and A. Di Carlo, J. Power Sources, 2015, 287, 87–95 CrossRef CAS.
- Z. Yang, H. Peng, W. Wang and T. Liu, J. Appl. Polym. Sci., 2010, 116, 2658–2667 CAS.
- N. U. Nguyen-Thai and S. C. Hong, Macromolecules, 2013, 46, 5882–5889 CrossRef CAS.
- S. Cetiner, H. Karakas, R. Ciobanu, M. Olariu, N. U. Kaya, C. Unsal, F. Kalaoglu and A. S. Sarac, Synth. Met., 2010, 160, 1189–1196 CrossRef CAS.
- T. Degradation and P. Chromatography, Society, 1990, 2460–2465 Search PubMed.
- M. S. A. Rahaman, A. F. Ismail and A. Mustafa, Polym. Degrad. Stab., 2007, 92, 1421–1432 CrossRef CAS.
- D. K. Sharma, J. Shen and F. Li, RSC Adv., 2014, 4, 39110–39117 RSC.
- D. Qian, L. Ye, M. Zhang, Y. Liang, L. Li, Y. Huang, X. Guo, S. Zhang, Z. Tan and J. Hou, Macromolecules, 2012, 45, 9611–9617 CrossRef CAS.
- X. Liu, T. Zhou, Y. Liu, A. Zhang, C. Yuan and W. Zhang, RSC Adv., 2015, 5, 10231–10242 RSC.
- S. Hamideh Mortazavi, S. Pilehvar, M. Ghoranneviss, M. T. Hosseinnejad, S. Zargham, A. A. Mirarefi and A. Y. Mirarefi, Appl. Phys. A: Mater. Sci. Process., 2013, 113, 703–712 CrossRef CAS.
- A. Ju, S. Guang and H. Xu, Carbon, 2013, 54, 323–335 CrossRef CAS.
- H. Kakida, K. Tashiro and M. Kobayashi, Polym. J., 1996, 28, 30–34 CrossRef CAS.
- W. Z. Li, P. Y. Wu, S. J. Li and Y. L. Yang, Acta Chim. Sin., 2004, 62, 1641–1644 CAS.
- C. L. Angell, Trans. Faraday Soc., 1956, 52, 1178–1183 RSC.
- M. Masia, M. Probst and R. Key, J. Phys. Chem. B, 2004, 108, 2016–2027 CrossRef CAS.
- G. Fini, P. Mirone and B. Fortunato, J. Chem. Soc., Faraday Trans. 2, 1973, 69, 1243–1248 RSC.
- S. Chintapalli and R. Frech, Solid State Ionics, 1996, 86–88, 341–346 CrossRef CAS.
- B. Zhang, Y. Zhou, X. Li, X. Ren, H. Nian, Y. Shen and Q. Yun, Spectrochim. Acta, Part A, 2014, 122, 59–64 CrossRef CAS.
- S. Sopeña, G. Fiorani, C. Martín and A. W. Kleij, ChemSusChem, 2015, 8, 3248–3254 CrossRef PubMed.
- N. M. Logacheva, V. E. Baulin, A. Y. Tsivadze, E. N. Pyatova, I. S. Ivanova, Y. A. Velikodny and V. V. Chernyshev, Dalton Trans., 2009, 2482–2489 RSC.
- Q. Tao, B. J. Reddy, H. He, R. L. Frost, P. Yuan and J. Zhu, Mater. Chem. Phys., 2008, 112, 869–875 CrossRef CAS.
- C. R. Bohn, J. R. Schaefgen and W. O. Statton, J. Polym. Sci., 1961, 55, 531–549 CrossRef CAS.
- J. S. Tsai and C. H. Lin, J. Appl. Polym. Sci., 1991, 42, 3039–3044 CrossRef CAS.
- I. R. Herbert, A. Tipping and Z. Bashir, J. Polym. Sci., Part B: Polym. Phys., 1993, 31, 1459–1470 CrossRef CAS.
- H. Yamazaki, S. Kajita and K. Kamide, Polym. J., 1987, 19, 995–998 CrossRef CAS.
- B. G. Colvin and P. Storr, Eur. Polym. J., 1974, 10, 337–340 CrossRef CAS.
- L. Tan, H. Chen, D. Pan and N. Pan, Eur. Polym. J., 2009, 45, 1617–1624 CrossRef CAS.
- Z. Bashir, Polymer, 1992, 33, 4304–4313 CrossRef CAS.
- Z. Bashir, J. Mater. Sci. Lett., 1993, 12, 1526–1528 CAS.
- D. Sawai, M. Miyamoto, T. Kanamoto and M. Ito, J. Polym. Sci., Part B: Polym. Phys., 2000, 38, 2571–2579 CrossRef CAS.
- Z. Zhang, L. Zhang, S. Wang, W. Chen and Y. Lei, Polymer, 2001, 42, 8315–8318 CrossRef CAS.
- S. Rajendran, R. Kannan and O. Mahendran, Mater. Lett., 2001, 48, 331–335 CrossRef CAS.
- K. K. Sonigara, H. K. Machhi, J. V. Vaghasiya, A. Gibaud, S. C. Tan and S. S. Soni, Small, 2018, 14, 1800842 CrossRef PubMed.
- K. K. Sonigara, J. V. Vaghasiya, H. K. Machhi, J. Prasad, A. Gibaud and S. S. Soni, ACS Appl. Energy Mater., 2018, 1, 3665–3673 CrossRef CAS.
- R. A. Costa, E. S. A. Junior, J. D. A. Bezerra, J. M. Mar, E. S. Lima, M. L. B. Pinheiro, D. V. C. Mendonça, G. B. P. Lopes, A. D. S. Branches and K. M. T. Oliveira, J. Chem., 2019, 2019, 18–22 Search PubMed.
| This journal is © The Royal Society of Chemistry 2021 |


