 Open Access Article
An integrated approach for structural characterization of Gui Ling Ji by traveling wave ion mobility mass spectrometry and molecular network†
Yuhao Zhang‡
 a,
Huibo Lei‡a,
Jianfei Taobc,
Wenlin Yuan
 b,
Weidong Zhang
 *ab and
Ji Ye*b
aInstitute of Interdisciplinary Integrative Medicine Research, Shanghai University of Traditional Chinese Medicine, Shanghai, 201203, China. E-mail: wdzhangy@hotmail.com; Tel: +86 021 81871244
bCollege of Pharmacy, The Second Military Medical University, Shanghai 200433, China. E-mail: catheline620@163.com; Tel: +86 021 81871248
cPharmacy Department, Shanghai Yang Si Hospital, Shanghai, 200126, China
First published on 27th April 2021
Abstract
Gui Ling Ji (GLJ), an ancient reputable traditional Chinese medicine (TCM) formula prescription, has been applied for the treatment of oligospermia and asthenospermia in clinical practice. However, its inherent compounds have not yet been systematically elucidated, which hampers developing standards or guidelines for quality evaluation and even the understanding of pharmacological effects. In this study, an integrated approach has been established for comprehensive structural characterization of GLJ. Mass spectrometry datasets of GLJ and each of the single herb medicines in this prescription have been developed by dynamic exclusion fast data-dependent acquisition and high-definition data-independent acquisition modes on ultra-high-performance liquid chromatography coupled with travelling wave ion mobility quadrupole time-of-flight mass spectrometry (UPLC-TWIMS-QTOF-MS). A global natural product social molecular networking (GNPS) platform was then applied for the visualization of chemical space of GLJ and further for the high throughput identification of the targeted or untargeted compounds due to the support of data-transmitting from each single herbal medicine to the formula GLJ. Moreover, drift time, predicted CCS, and diagnostic fragment ions were induced for annotating isomer compounds. Consequently, based on molecular network and library hits, a total of 257 compounds from GLJ, which were classified into 4 structural types, were positively or tentatively characterized. Among them, 20 potential new compounds were detected and 30 pairs of isomers were comprehensively distinguished. The established strategy was effective for attribution, classification, recognition of various constituents, and also was valuable for integrating large amounts of disordered MS/MS data and mining trace compounds in other complex chemical or biochemical systems.
Introduction
Traditional Chinese medicine (TCM) formulas have been acknowledged for preventing and curing diseases for thousands of years in China.1 The principal medicines and the other adjuvant ones in TCM were combined to assist the effects, reduce the side effects, or facilitate the components' delivery, resulting in the complexity and diversity of structure information on inherent chemical components.2 Structural characterization of chemical compounds in TCM formulas is still facing the challenges due to the overlapping chromatographic peaks, diverse structures, and minor trace compounds, which hampers the understanding of pharmaceutical actions in clinical usage, discovering the potential leading compounds and constructing standards or guidelines for quality evaluation.3Recently, ultra-high-performance liquid chromatography coupled with various types of mass spectrometers, such as QTOF-MS and Orbitrap-MS et al., have been accepted as powerful tools for the separation and identification of numerous and complicated chemical compositions in TCM formula due to the high-resolution capacity, reasonable detection range and high sensitivity.4 Aiming to improve the efficiency and accuracy for the structural elucidation of compounds in complex system, some attempts have been made in fields of data acquisition modes and statistical analysis methods. With regards to data acquisition, various scanning modes, including data-independent acquisition, data-dependent acquisition and ion mobility acquisition could be a support for randomly obtain MS/MS information, whereas neutral loss/precursor ion scanning is helpful for target detecting the homolog-focus profiles. However, high throughput screening of precursor-to-product ions in one run time period from a complex signal background is still a challenge due to the interference of high abundance of major ions, which might influence the acquisition of fragmentation ions of the co-eluting minor ones. Thus, for obtaining a large amount of the inherent multiple components, dynamic exclusion-based fast data dependent acquisition (DE-DDA) was applied to improve MS/MS coverage and efficiency, and simplify the data by increasing the selectivity. Moreover, the optimization of the data processing strategies is also important for annotating compounds.5–7 Basically, it relies on traditional experience-based of data mining or commercial processing software, which is time-consuming, laborious, and prone to errors and omissions. Considering theses shortages, it is urgently need to establish a global analysis method for unifying of the comprehensive structure results of TCM formula and discovering the unknown components intuitively and rapidly. Global natural products social molecular networking (GNPS) is an open-access knowledge platform for community wide organization and sharing of raw, processed or identified tandem mass spectrometry data,8 which provides the ability to create molecular network from MS/MS data against itself and identify them against public available databases. With the aid of GNPS, thousands of molecules can be systematically compared and classified based on structural similarity and enable the dereplication of natural products in a high throughput manner.9,10 By integrated minor trace compounds acquisition method, molecular network has become an accelerator for auto-deconvolution of data and interpretation.
In addition, clarifying the isomers effectively and accurately is also a difficult point in the study of TCM chemistry owing to the lack of standards, no characteristic diagnostic ions, and few literature reports. To remove this blockage, new dimensions of separation for LC-MS technology have been extensively developed to increase the coverage of ions.11 It is worth noting that traveling wave ion mobility mass spectrometry (TWIMS) could divide isomers by their shape, charge, yielding a physical property called collision cross sections (CCS) and a high related value of the drift time when passing through the neutral buffer gas in the mobility tube.12 CCS has a high degree of reproducibility across instruments and laboratories, but unfortunately, this property is limited by the available experimental reference CCS values.13 Various CCS prediction methods, such as prediction based on machine learning14–16 and calculation of quantum chemistry,17 has emerged for obtaining reliable CCS values. Those methods reveal the certain shortcomings on a limited number of structural type and complicated prediction process. Recently, an unsupervised clustering based on molecular quantum numbers ML based CCS prediction has been developed for identifying the diversity structural chemical compounds.13 The advantage lies in a wide range of predicting CCS values of the targeted or untargeted compounds under the simple operation on website. A novel drift time-predicted CCS method was introduced and applied to distinguish isomers, which could be determined under the principle of Mason–Schamp equation,18 and is expected as a supplementary for conventional methods.
Gui Ling Ji (GLJ), a classic TCM prescription recorded in the 2015 edition of the Chinese Pharmacopoeia, was consists of 28 flavors, including Panax ginseng C. A. Mey. (PG), Asparagus cochinchinensis (Lour.) Merr. (AC), Impatiens balsamina L. (IB), Glycyrrhiza uralensis Fisch. (GU), Achyranthes bidentata Bl. (AB), Psoralea corylifolia Linn. (PC), Epimedium brevicornu Maxim. (EB), Eugenia caryophyllata Thunb. (EC), Eucommia ulmoides Oliv. (EU), Hippocampus kuda Bleeker (HK), Cervus nippon Temminck (CN), Manis pentadactyla Linnaeus (MP), Cistanche tubulosa Y. C. Ma (CT), Aconitum carmichaeli Debx. (ACD), Rehmannia glutinosa (Gaetn.) Libosch. ex Fisch. et Mey. (RG), Lycium barbarum L. (LB), Cuscuta chinensis Lam. (CC), Cynomorium songaricum Rupr. (CS), Amomum villosum Lour. (AV) etc. It has notable curative effectiveness on strengthening body, tonifying qi, and enhancing appetite.19 Modern pharmacological studies and clinical data indicate that it has significant effects on anti-aging and is particularly useful during the treatment of male disorders such as premature ejaculation, erectile dysfunction, and oligozoospermia.20–22 Previously, Zhao et al. has summarized the qualitative and quantitative analysis method for determining one or several compounds in GLJ.23 To the best of our knowledge, no systematic structural characterization of compounds in GLJ has been studied previously.
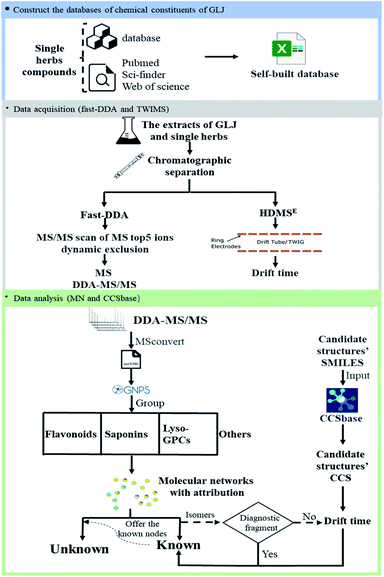
In this present study, a comprehensive method is proposed and applied to the characterization of multiple types of components and the differentiation of isomers in GLJ. The method is carried out by the following steps as shown in Fig. 1: (1) construct a self-built chemical database of GLJ by searching the literature and online-databases. (2) MS/MS spectrum data of GLJ and each single medicine were collected by DE-DDA, and drift time data of GLJ were collected by high definition MS (HDMSE) mode. (3) Untargeted data organization by GNPS is used for rapid attribution, structural classification, and identification and the drift time-predicted CCS method is used to differentiate between isomers. This is the first time that global chemical composition of GLJ has been studied, and the results are beneficial for the elucidating the pharmacological basis of GLJ's efficacy in treating oligozoospermia and further for quality control analysis.
Experimental
Materials and methods
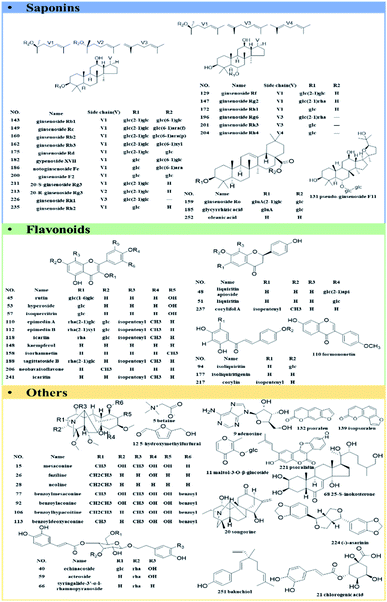
A total of 61 authentic compounds, which have been recorded in phytochemical separation of medicines in GLJ, were purchased from the National Institute for the Control of Pharmaceutical and Biological Products (Beijing, China) and Shanghai Yuanye Biotechnology Co., Ltd. (Shanghai, China) as reference standards (the purity ≥ 98%). The structural information was displayed in Fig. 2. All medicinal materials and GLJ capsules (Lot Number: 20151108) were generously provided by GuangYuYuan Chinese Herbal Medicine Co., Ltd. (Shanxi, China). Acetonitrile (LC-MS grade), formic acid (LC-MS grade) and water (LC-MS grade) were purchased from Fisher Scientific Company (Fair Lawn, NJ, USA). Methanol (analytical grade) was obtained from Runjie Tech Co. (Shanghai, China). LC-MS-grade leucine enkephalin was obtained from Sigma-Aldrich (MO, USA).Sample preparation
The stock solutions of 61 reference compounds with known concentrations (about 1 mg mL−1) were prepared in methanol individually, and were stored at 4 °C before analysis. Measure 300 μL of each stock solution in a 10 mL volumetric flask, dilute with methanol to the volume to produce a mixture solution containing about 30 μg of each per mL as the reference solution. Remove the outer layer of GLJ capsule and grind the contents to fine power. 1.0 g of fine powder was accurately weighed and ultrasonicate (power 300 W, frequency 40 kHz) at 25 °C for 1 hour in 40 mL of methanol. The test solution was produced by diluting the supernatant with methanol. All the solutions were stored at 4 °C and the supernatant was centrifuged at 13![[thin space (1/6-em)]](https://www.rsc.org/images/entities/char_2009.gif) 000 rpm for 10 min before injecting to LC-MS analysis.
000 rpm for 10 min before injecting to LC-MS analysis.
UPLC-TWIMS-QTOF-MS analysis conditions
The chromatographic separation of GLJ was carried out using a Waters Acquity UPLC I-class system (Waters, Milford, MA, USA), equipped with a binary pump, an auto-sampler, a degasser and a thermostarted column compartment. The separation of GLJ sample was performed on an Agilent Zorbax Eclipse Plus C18 column (2.1 mm × 150 mm, 1.8 μm, 95 Å, Agilent Corp, Santa Clara, CA, USA), with the column temperature maintained at 35 °C. The mobile phase was consisted of 0.05% formic acid (v/v, A) and acetonitrile (B), the flow rate was 0.3 mL min−1 and the gradient elution program was optimized as follows: 0–5 min, 5–5% B; 5–10 min, 5–12% B; 10–12 min, 12–12% B; 12–50 min, 12–70% B; 50–65 min, 70–100% B; 65–68 min, 100–100% B. The inject volume was set to 1 μL.The optimization of mass spectrometry parameters is important for yielding a comparatively high MS and MS/MS responses for the compounds in complex components. Mass spectrometry detection was performed on SYNAPT G2-Si HDMS system, equipped with an electrospray ionization (ESI) source (Waters Corp., Manchester, UK). Data acquisition was progressed in both of positive and negative ionization modes through fast-DDA manner and HDMSE, respectively. In order to obtain better ionization efficiency, the parameters of mass spectrometry detection mode, spray voltage, capillary voltage, capillary temperature, and scanning range were examined. Both positive ion mode and negative ion mode were conducted to the structural characterization of various types of compounds in GLJ. Mass spectrometry conditions were finally set as follows: dry gas flow rate, 800 L h−1; dry gas temperature, 400 °C; ion source temperature, 120 °C; capillary voltage, 3.0 kV in positive ion mode and 2.5 kV in negative ion mode; cone voltage, 40 V, source offset, 80 V; cone gas flow, 50 L h−1. The parameters in fast-DDA mode were set as follows: mass scan range, m/z 50–1500 Da; MS and MS/MS scan rate, 0.2 s; maximum number of ions for MS/MS from a single MS scan, 5; dynamic peak exclusion, which enables real time exclusion of masses from MS/MS, is on; the acquire and then exclude time, 6 s; MS/MS collision energies, 10–40 V for low mass collision energy and 40–120 V for high mass collision energy; TWIMS data was acquired using HDMSE mode. The parameters of the traveling-wave ion mobility spectrum were set as follows: the buffer gas is nitrogen gas with a flow rate of 25 mL min−1, the wave velocity is 650 m s−1, and the pulse height is 15 V. Calibration of CCS value was performed using a solution of polyalanine. Real-time data were calibrated using an external reference (LockSpray™) by the constant infusion of a leucine-enkephalin solution, with the lock masses at m/z 556.2771 in positive ion mode and m/z 554.2615 in negative ion mode, respectively, at a flow rate of 5 μL min−1. Data acquisition were obtained by MassLynx 4.1.
Database construction of GLJ
The databases of compounds from each of single medicines in GLJ were built by searching literatures and online databases, such as TCMID, TCMSP, Sci-finder, PubChem, and Web of Science. As a result, a chemical composition UNIFI database, including name, chemical structure, molecular formula, characteristic fragment ions and source, was established, which provided reference information for characterizing the chemical composition of GLJ.Data analysis
where k is a constant related to an electron charge, the state charge of the analyte ion, the Boltzmann constant, the temperature, and the drift gas pressure, et al. td is the drift time, μ is the reduced mass of the ion and neutral given by (mneutral × mion)/(mneutral + mion), where mneutral and mion are the molecular masses of the drift gas and analyte ion, respectively. B is correction factor originated from the nonlinear and time-varying electric field present in the traveling wave IMS separation device. The structure relationship of the candidate isomers was hence distinguished by the equation that the greater the predicted CCS value of a compound, the longer the measured drift time it would be.
Results and discussion
Target characterization of multiple type compounds in GLJ
Owing to the high similarity fragment ions in MS2 of the homogeneous structures, the same class compounds were easily to be aggregated in the same cluster of molecular networks. The same precursor ions in MS1 and similar product ions in MS2 were also apt to generating the colourful nodes in molecular network. For each node, it contains no less than two colours, representing the herbal medicine source or sources of the compound in TCM formula. Therefore, based on these similar secondary spectrums, a global molecular network of GLJ and its each individual medicine was created (Fig. 3). The molecular network map in negative ion mode was consists of 1302 precursor ions, including 81 clusters (nodes ≥ 2) and 680 single nodes, whereas in positive ion mode contained 1296 precursor ions, including 79 clusters (nodes ≥ 2) and 801 single nodes. According to the established strategy, a total of 257 compounds were detected and assigned in GLJ, of which 237 compounds were tentatively identified by screening the self-built databases. 61 of them were definitively confirmed by the analysis of standard compounds. Besides, 20 potential novel compounds, including 12 saponins and 8 flavonoids, were detected and putatively clarified with the help of the identified neighbourhood nodes in molecular network. The representative base peak chromatograms (BPCs) of GLJ are shown in Fig. 4. The detailed information, including peak number, retention times (RT), formulas, adduct ions, accurate molecular ions, mass measurement error, fragment ions, compound names and original sources, are shown in Table S1.†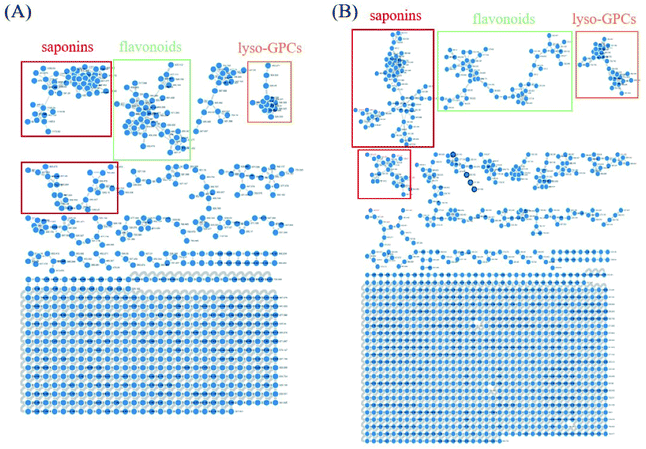 | ||
| Fig. 3 Molecular networks and major categories of chemical components from GLJ in negative (A) and positive (B) ion modes. | ||
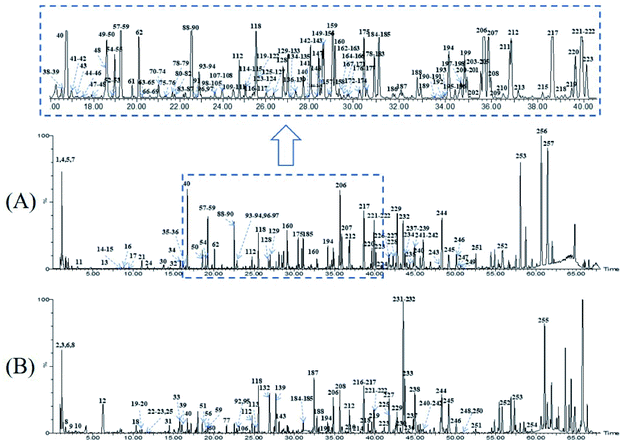 | ||
| Fig. 4 The representative base peak chromatograms (BPCs) of GLJ both in negative (A) and positive (B) ion modes. | ||
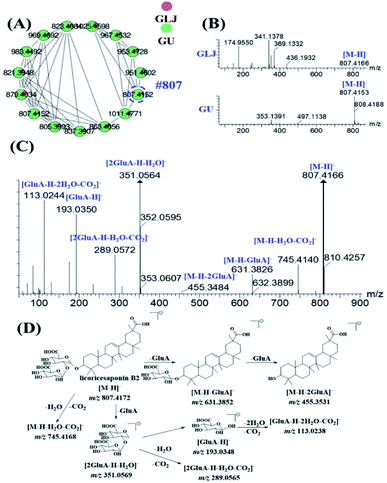
Saponins are one of the major types of components in GLJ and they can be divided into triterpenoid and steroid according to their aglycones. High mass spectrometry responses were exhibited in negative ion mode, thus it was applied for generating molecular network for structural classification and identification. Based on MS/MS spectra results of GLJ and the related herbal medicines, three saponin clusters were easily aggregated and the chemical structures of the spectral nodes were constructed due to the similar sapogenins from one herbal source. According to the literatures,24–27 protopanaxatriol (PPT)-type and protopanaxadiol (PPD)-type ginsenosides could generate the diagnostic product ions at m/z 391.2854 and m/z 375.2905, respectively. Typical fragment ion at m/z 351.0569 [2× glucuronic acid (GluA) − H2O − H]−, 193.0348 [GluA − H]− and 113.0238 [GluA − CO2 − 2H2O − H]− were highly characteristic for oleanane type saponins originated from GU. Moreover, these three high characteristic product ions were considered as one of most important factors in clustering. Take the structural illustration procedure of peak 185 (#821) as an example. It showed a [M − H]− ion at m/z 821.3948 in the full mass spectra scans, and the molecular formula was C42H62O16 with mass error of −1.46 ppm. As shown in Fig. S1,† a series of fragment ions at m/z 759.3976, 645.3641 and 469.3331 correspond to the neutral losses of a molecular of H2O and CO2, GluA and 2× GluA, respectively, which implied this compound belongs to oleanane type. Two diagnostic fragment ions at m/z 351.0569 and 193.0353 correspond to [2× GluA − H2O − H]− and [GluA − H]−, indicated the presence of glucuronic acid. Based on the MS/MS data of in the literature,24–26 peak 185 was identified as glycyrrhizic acid, and was further confirmed by comparison with the MS/MS spectra and retention time with the standard compound. Similarly, peak 124, 125, 164, 166, 167, 169, 192, 195 and 198 were identified as licoricesaponin A3, uralsaponin X, licoricesaponin G2, licoricesaponin D3, licoricesaponin E2, yunganoside L1, licoricesaponin J2, licoricesaponin C2 and licoricesaponin B2, respectively.24,28
MS2 spectra of minor compounds in the node were obtained by DE-DDA method. Together with the high-quality MS2 spectra of each single herb, the minor compounds in GLJ were successfully characterized. As shown in Fig. 5B, peak 198 (#807) presented low abundance precursor ion and few product ions in GLJ, affecting its structural elucidation. Taking advantages of molecular network, the origination herbal medicine of GU was simultaneously traced, which have yielded better quality MS/MS data (Fig. 5C) due to the high abundance of precursor ion response. Thus, due to the data-transmitting from herbal medicines to TCM formula, peak 198 can be easily identified as licoricesaponin B2 (Fig. 5D). Totally 10 oleanane-type triterpenoid saponins were identified from Fig. 5A by consulting relevant literatures and summarizing the fragmentation regularity. In addition, characterization of flavonoids, lyso-GPCs and others were described in detail in the ESI.†
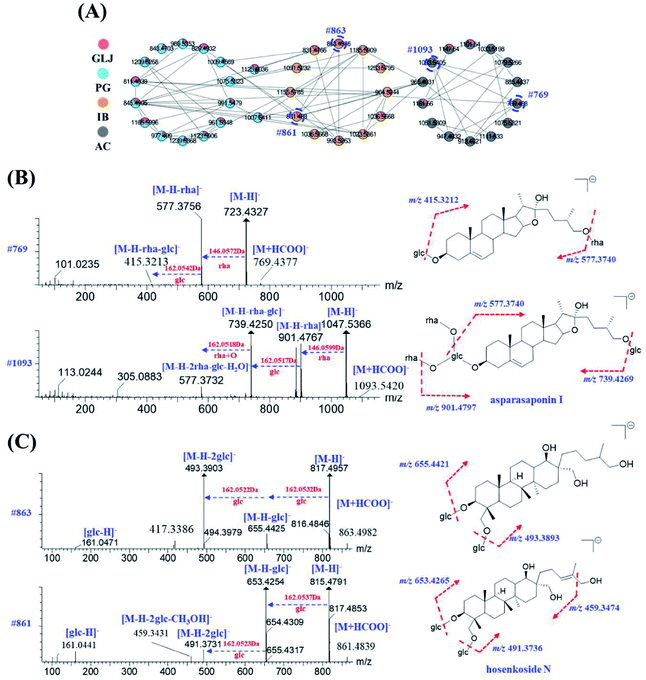
The same class of known compounds in molecular network is useful for identifying and clustering the features of similar structures on GNPS platform. Saponins and flavonoids are readily aggregated into corresponding molecular network clusters due to their structural similarities. With known compounds as a starting point, saponins and flavonoids derivatives with sugars and other residues in adjacent were subsequently elucidated by neutral losses or the diagnostic fragment ions. For example, peak 234 (#769) was not assigned as a known compound by matching with public and self-built database, but the color of this node indicated its origination of AC directly. In the grey nodes of Fig. 6A, peak 134 (#1093), showing molecular formula of C51H84O22 ([M + HCOO]−) with mass error of 2.83 ppm, has been identified as asparasaponin I by searching with the GNPS databases with its cosine score greater than 0.9 (as shown in Fig. 6B). It could produce a series of fragment ions at m/z 901.4767, 885.4818, 739.4250, 577.3732 (Fig. 6B and Table S1†), which were corresponded to the neutral losses of rhamnose, glucose, rhamnose + glucose, and 2× rhamnose + glucose + H2O, respectively. The fragment ion at m/z 577.3732 is considered as the diagnostic glycosidic fragment ion of asparasaponin I, namely sarsasapogenin-3-glucose. This typical fragment ion has also been seen on MS/MS spectra of peak 234 (#769), molecular formula of C39H64O12 ([M + HCOO]−) with mass error of 0.65 ppm, suggesting the elimination of a molecular of 146.0571 Da (rhamnose). Besides, fragment ion at m/z 415.3213 may be formed by a neutral loss of 162.0528 Da (glucose) from diagnostic ion at m/z 577.3756 (Fig. 6B), which also supported that fragment ion at m/z 577.3756 corresponds to sarsasapogenin-3-glucose. A series of product ions at m/z 161.0454/143.0349/113.0261/101.0235 verify the presence of glucose and rhamnose (Table S1†). In addition, no diagnostic ion of disaccharide at m/z 221.0653 was observed. The results strongly suggested that peak 234 could be presumed as the rhamnose and glucose products with different linkage positions. According to the previously reported literatures,29–31 C3 position and C22 position of the sarsasapogenin saponin is more apt to having the linkage of sugar chains to form saponins rather than other positions. Thus, peak 234 was presumed to be sarsasapogenin-3-glucose-22-rhamnose.
The molecular network of flavonoid glycosides from EB was clustered in Fig. S2.† With the function of node-to-node connection in colours and cosine score, the chemical compounds were deduced on the basis of their MS/MS spectrum. Taking peak 202 (#657, tR = 35.324 min, m/z 657.2181) as an example for structure illustration, the molecular formula was initially deduced as C33H38O14, with mass error at 1.18 ppm. According to the MS/MS spectrum, an abundant product ion at m/z 513.1769 was generated by the elimination of a unit of C6H8O4 (dideoxyfuranose, 144.0423 Da), which was consistence with adjacent known peak 199 of icariside II (C27H30O10, m/z 513.1761). Moreover, the same diagnostic fragment ions at m/z 367.1177/366.1114/352.0934/323.0913/279.0289 (Table S1†) were produced for both of peaks 199 and 202, indicating that they were the characteristic anhydroicaritin glycosides in EB.32 Besides, fragment ions at m/z 513.1769 and 367.1177 of peak 202 were corresponded to the consecutively losses of dideoxyfuranose (144.0412 Da) and rhamnose (146.0592 Da), demonstrating that dideoxyfuranose has a close linkage to rhamnose at C-3 position. Thus, the possible structure of peak 202 might be anhydroicaritin-3-O-rhamnose-dideoxyfuranose.
Apart from the identical diagnostic product ions, some similar fragmentation behaviours could be speculated on their MS/MS spectrum, which were helpful for deducing the untargeted compounds from the known ones in molecular network. Starting from node #861 (peak 64), its adjacent node #863 (peak 41) was taken as an example for the structural characterization. Both of them were assigned as saponins in IB. Peak 64, with molecular formula of C42H72O15 ([M + HCOO]−) with mass error of 2.67 ppm, has been characterized as hosenkoside N by comparison their product ions with the publication before.33 Fragment ions at m/z 653.4254 and 491.3731 were an indicative of successively neutral losses of glucose from the quasi-molecular ion [M − H]− at m/z 815.4791 (Fig. 6C). On the other hand, peak 41 has shown molecular formula of C42H74O15 ([M + HCOO]−) with mass error of 2.84 ppm, and it was assigned as an unknown compound by searching with the UNIFI software and online databases. Next, as MS/MS spectrum data shown in Fig. 6C, most fragment ions of m/z 863.4986 were 2.0156 Da more than those corresponding product ions of m/z 861.4835, indicating that sapogenin of peak 41 was presumed to be the hydrogenated product of hosenkoside N or its isomers. Besides, peak 64 glycoside exhibits a neutral loss of CH3OH (32.0262 Da) due to the ethylene bond in side chain, resulting in the presence of fragment ions at m/z 459.3431. However, peak 41 does not exhibit the same neutral loss, suggesting that the hydrogenation may be taken place in the side chain of aglycones. Owing to the limitation of our knowledge, the substituted hydroxyl positions of glucoses could not be distinguished. Thus, we tentatively presumed it as hydrogenated product of hosenkoside N or its isomers.
Structural characterization of untargeted compounds demonstrated that the proposed systematic speculation and recognition method based on adjacent known compounds, diagnostic ions, and fragmentation behaviours were effective and useful. Meanwhile, the combination of diagnostic fragment ions and molecular network has been exhibited as a time-saving, powerful and promising technique for the effective classification and elucidation of various types of potential new compounds. Even though, their structures should be confirmed by NMR spectrum analysis of their corresponding monomer.
Ion mobility and CCS prediction for isomers annotation
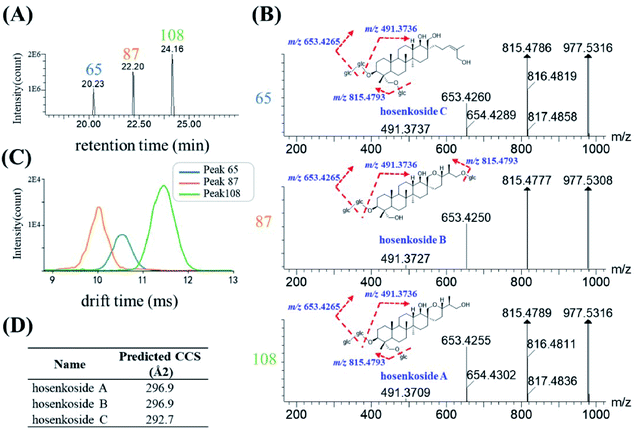
Herbal medicines often contained various type of isomers, which might exhibit diverse pharmacological activities and play indispensable role during the clinical usage. The high similarity MS/MS spectrum and co-eluting peaks often bring challenges for the structural characterization of isomers. Here, based on the conventional RT and mass-to-charge ratios, a new dimension of drift time-predict CCS method was implied as a supplementary of diagnostic product ions method, for differentiating isomers. Ultimately, 30 species of isomers, related to 78 compounds, were tentatively assigned, and identified. 27 isomers were confirmed by corresponding reference substances. Specific information of retention time, drift time, predicted CCS and diagnostic ion was shown in Table S2.†Since the drift time-predicted CCS is a machine-learning method, structures in high similarity might influence the accuracy of the predicted CCS values. For those isomers, the actual CCS values or the relative CCS values could be re-evaluated on the basis of polarity of compounds. To some extent, isomers of the same structural can also be distinguished. The saponins in IB were used as an example for the identification of various high similarity CCS values of isomers. As shown in Fig. 7A, three chromatographic peaks, with RT at 20.35 min (peak 65), 22.38 min (peak 87) and 24.16 min (peak 108) respectively, were extracted in accordance with the quasi-molecular ion at m/z 1023.5361 (C48H82O20, [M + HCOO]−). After searching with the UNIFI software and literature,33 #1023 was presumed to be hosenkoside A, hosenkoside B and hosenkoside C. However, their structures are too similar to produce characteristic diagnostic ions (Fig. 7B). According to drift time-predicted CCS method, the CCS values of those candidate compounds were predicted to be 296.9 Å2 for both of hosenkoside A and hosenkoside B, 292.7 Å2 for hosenkoside C by CCSbase (Fig. 7D and Table S2†). Fig. 7C implied the drift times of peak 65, 87 and 108 were 10.55 ms, 10.13 ms and 11.45 ms, respectively. It is estimated that the larger the CCS value, the greater the drift time. Thus, peak 87 was initially identified as hosenkoside C. The same CCS predicted values of hosenkoside A and B phenomenon was resulted in the isomers of substitute sugar chain at C-26 or C-28. According to previous publication,33 it has referred that hosenkoside B has much high polarity than that of hosenkoside A. Thus, peak 65 and 108 were tentatively identified as hosenkoside B and hosenkoside A, respectively. Moreover, the drift time provided by TWIMS of hosenkoside B is less than that of hosenkoside A, indicating the actual CCS value of hosenkoside B should be smaller than that of hosenkoside A. Based on aforementioned results, the CCS values of the corresponding types of baccharane glycosides are presumed to be ranked as follows: hosenkol C < hosenkol B < hosenkol A. This drift time-predicted CCS method have also been applied for identifying various types of baccharane glycosides isomers, including #861 and #993 (as shown in Table S2†).
Conclusion
In this study, an integrated approach based on UPLC-TWIMS-QTOF-MS and molecular network was developed and applied for comprehensively aggregation of structure types and chemical compounds identification in a TCM formula GLJ. Totally 257 compounds, mainly belonging to saponins, flavonoids and lyso-GPCs, were unambiguously or tentatively identified. This is the first report on the composition analysis of GLJ. The established DE-DDA acquisition method has dramatically increased the peak coverage and selectivity of MS/MS fragmentation, especially for minor ingredients. 20 potential new compounds were also rapidly discovered and highlighted by the combination of diagnostic fragment ions and molecular network. Moreover, according to TWIMS data acquisition and drift time-predicted CCS data analysis method, 30 pairs of isomers has been efficiently and accurately distinguished by using HDMSE mode. This study revealed that the proposed method is suitable for the discovery and identification of known, unknown compounds and isomers of GLJ, and the results were valuable for its quantitative analysis. Furthermore, this work may serve as a practical paradigmatic example and set up guidance for global rapid characterization and classification of diverse types of constituents in many other complex matrixes.Conflicts of interest
The authors declare that they have no conflict of interest.Acknowledgements
The work was supported by Professor of Chang Jiang Scholars Program, NSFC (81520108030, 21472238), National Major Science and Technology Projects of China (2019ZX09201005-007-003, 2019ZX09201004-003-010), Shanghai Engineering Research Center for the Preparation of Bioactive Natural Products (16DZ2280200), the Scientific Foundation of Shanghai China (13401900103, 13401900101), the National Key Research and Development Program of China (2017YFC1700200). We also specially thank the developers of GNPS and CCSbase for supplying the open-source data analysis platform free.References
- F. Cheung, Nature, 2011, 480, S82–S83 CrossRef CAS PubMed.
- J. Liu, J. Liu, F. Shen, Z. Qin, M. Jiang, J. Zhu, Z. Wang, J. Zhou, Y. Fu, X. Chen, C. Huang, W. Xiao, C. Zheng and Y. Wang, Sci. Rep., 2018, 8, 380 CrossRef.
- X. Qiao, X. H. Lin, S. Ji, Z. X. Zhang, T. Bo, D. A. Guo and M. Ye, Anal. Chem., 2016, 88, 703–710 CrossRef CAS PubMed.
- C. Wang, J. Zhang, C. Wu and Z. Wang, J. Chromatogr. A, 2017, 1518, 59–69 CrossRef CAS PubMed.
- X. Wang, Q. Peng, P. Li, Q. Zhang, X. Ding, W. Zhang and L. Zhang, Anal. Chim. Acta, 2016, 940, 84–91 CrossRef CAS.
- T. K. Dier, K. Egele, V. Fossog, R. Hempelmann and D. A. Volmer, Anal. Chem., 2016, 88, 1328–1335 CrossRef CAS PubMed.
- T. F. Cheng, Y. H. Zhang, J. Ye, H. Z. Jin and W. D. Zhang, J. Pharm. Biomed. Anal., 2020, 184, 113197 CrossRef CAS PubMed.
- M. Wang, J. J. Carver, V. V. Phelan, L. M. Sanchez, N. Garg, Y. Peng, D. D. Nguyen and J. Watrous, Nat. Biotechnol., 2016, 34, 828–837 CrossRef CAS PubMed.
- Q. Lyu, T. H. Kuo, C. Sun, K. Chen, C. C. Hsu and X. Li, Food Chem., 2019, 282, 9–17 CrossRef PubMed.
- H. Pan, H. Zhou, S. Miao, J. Cao, J. Liu, L. Lan, Q. Hu, X. Mao and S. Ji, J. Chromatogr. A, 2020, 1613, 460674 CrossRef CAS PubMed.
- M. Fenclova, M. Stranska-Zachariasova, F. Benes, A. Novakova, P. Jonatova, V. Kren, L. Vitek and J. Hajslova, Anal. Bioanal. Chem., 2020, 412, 819–832 CrossRef CAS PubMed.
- E. Deschamps, I. Schmitz-Afonso, A. Schaumann, E. Dé, C. Loutelier-Bourhis, S. Alexandre and C. Afonso, Anal. Bioanal. Chem., 2019, 411, 8123–8131 CrossRef CAS PubMed.
- D. H. Ross, J. H. Cho and L. Xu, Anal. Chem., 2020, 92, 4548–4557 CrossRef CAS PubMed.
- Z. Zhou, J. Tu, X. Xiong, X. Shen and Z. J. Zhu, Anal. Chem., 2017, 89, 9559–9566 CrossRef CAS PubMed.
- Z. Zhou, X. Shen, J. Tu and Z. J. Zhu, Anal. Chem., 2016, 88, 11084–11091 CrossRef CAS PubMed.
- P. L. Plante, É. Francovic-Fontaine, J. C. May, J. A. McLean, E. S. Baker, F. Laviolette, M. Marchand and J. Corbeil, Anal. Chem., 2019, 91, 5191–5199 CrossRef CAS.
- S. M. Colby, D. G. Thomas, J. R. Nunez, D. J. Baxter, K. R. Glaesemann, J. M. Brown, M. A. Pirrung, N. Govind, J. G. Teeguarden, T. O. Metz and R. S. Renslow, Anal. Chem., 2019, 91, 4346–4356 CrossRef CAS.
- A. Ahmed, Y. J. Cho, M. H. No, J. Koh, N. Tomczyk, K. Giles, J. S. Yoo and S. Kim, Anal. Chem., 2011, 83, 77–83 CrossRef CAS PubMed.
- National Pharmacopoeia Committee, Pharmacopoeia of Peoples Republic of China, 2020, Part 1 Search PubMed.
- S. J. Zhao, X. Z. Zhao, H. L. Liu, X. X. Gao and X. M. Qin, Chin. Tradit. Herb. Drugs, 2018, 49, 5352–5357 Search PubMed.
- N. Y. Liu, H. Pei, M. X. Liu, L. T. Liu, C. G. Fu, H. Li and K. J. Chen, Chin. J. Integr. Med., 2020, 26, 577–582 CrossRef CAS PubMed.
- J. K. Liu, H. Kabuto, M. Hiramatsu and A. Mori, Acta Med. Okayama, 1991, 45, 217–222 CAS.
- X. Z. Zhao, S. J. Zhao, J. S. Tian, X. X. Gao and G. H. Du, Chin. Tradit. Herb. Drugs, 2017, 48, 1424–1431 Search PubMed.
- Z. Li, T. Liu, J. Liao, N. Ai, X. Fan and Y. Cheng, J. Sep. Sci., 2017, 40, 1254–1265 CrossRef CAS PubMed.
- J. Zhou, H. Cai, S. Tu, Y. Duan, K. Pei, Y. Xu, J. Liu, M. Niu, Y. Zhang, L. Shen and Q. Zhou, Molecules, 2018, 23, 3128 CrossRef PubMed.
- Y. Fu, M. Shan, M. Hu, Y. Jiang, P. Chen, Y. Chi, S. Yu, L. Zhang, Q. Wu, F. Zhang and Z. Mao, J. Pharm. Biomed. Anal., 2019, 174, 595–607 CrossRef CAS PubMed.
- C. L. Yao, H. Q. Pan, H. Wang, S. Yao, W. Z. Yang, J. J. Hou, Q. H. Jin, W. Y. Wu and D. A. Guo, J. Chromatogr. A, 2018, 1538, 34–44 CrossRef CAS PubMed.
- X. Qiao, Q. Wang, W. Song, Y. Qian, Y. Xiao, R. An, D. A. Guo and M. Ye, J. Chromatogr. A, 2016, 1438, 198–204 CrossRef CAS PubMed.
- T. Sidiq, A. Khajuria, P. Suden, S. Singh, N. K. Satti, K. A. Suri, V. K. Srinivas, E. Krishna and R. K. Johri, Immunol. Lett., 2011, 135, 129–135 CrossRef CAS PubMed.
- C. Onlom, N. Nuengchamnong, W. Phrompittayarat, W. Putalun, N. Waranuch and K. Ingkaninan, Nat. Prod. Commun., 2017, 12, 7–10 Search PubMed.
- P. Y. Hayes, A. H. Jahidin, R. Lehmann, K. Penman, W. Kitching and J. J. De Voss, Phytochemistry, 2008, 69, 796–804 CrossRef CAS PubMed.
- H. Y. Zhao, J. H. Sun, M. X. Fan, L. Fan, L. Zhou, Z. Li, J. Han, B. R. Wang and D. A. Guo, J. Chromatogr. A, 2008, 1190, 157–181 CrossRef CAS PubMed.
- Y. Fu, W. Gao, J. J. Yu, J. Chen, H. J. Li and P. Li, J. Pharm. Biomed. Anal., 2012, 64–65, 64–71 CrossRef CAS PubMed.
- J. Liu, H. Gan, T. Li, J. Wang, G. Du, Y. An, X. Yan and C. Geng, Biomed. Chromatogr., 2020, 34, e4856 CAS.
- L. Zhang, Q. L. Zhou and X. W. Yang, J. Sep. Sci., 2018, 41, 1039–1049 CrossRef CAS PubMed.
- Y. J. Li, H. L. Wei, L. W. Qi, J. Chen, M. T. Ren and P. Li, Rapid Commun. Mass Spectrom., 2010, 24, 2975–2985 CrossRef CAS PubMed.
Footnotes |
| † Electronic supplementary information (ESI) available. See DOI: 10.1039/d1ra01834e |
| ‡ These authors contributed equally to this work. |
| This journal is © The Royal Society of Chemistry 2021 |

