
 Open Access Article
 This Open Access Article is licensed under a Creative Commons Attribution-Non Commercial 3.0 Unported Licence
Exploring color tunable emission characteristics of Eu3+-doped La2(MoO4)3 phosphors in the glass–ceramic form†
Manjulata Sahu a,
Nimai Phatak*b and
M. K. Saxenaa
a,
Nimai Phatak*b and
M. K. Saxenaa
aRadioanalytical Chemistry Division, Bhabha Atomic Research Centre, Mumbai 400 085, India
bRadiochemistry Division, Bhabha Atomic Research Centre, Mumbai 400 085, India. E-mail: nimai@barc.gov.in; nmpathak4@gmail.com; Fax: +91-22-25405151; Tel: +91-22-25590715
First published on 12th May 2021
Abstract
The glass–ceramic form of phosphor materials can overcome the many serious issues of phosphor/silicone composite in commercial phosphor-converted LEDs and are considered as new-generation color converters. In this report, we have shown a novel approach of developing inorganic red phosphor [Eu3+:La2(MoO4)3] in the glass–ceramic form based on lanthanum molybdate system. The ceramic form of the compound was found to have a glass transition temperature of 1002 °C, as confirmed by TGA and DSC studies. Further, XRD, FTIR and Raman studies also confirmed that the compounds prepared at 1050 °C are in glass–ceramic form, while those prepared at 750 °C are in ceramic form. Photoluminescence studies showed that both the ceramic and glass–ceramic forms of the phosphor are red color-emitting materials. However, the glass–ceramic forms have better color purity and more radiation transition probabilities. Further, the decay kinetics of both ceramic and glass–ceramic forms confirmed that only those Eu3+ ions which exist in the grain boundaries of the ceramics go inside the glass network structure upon heating the compound at or above the glass transition temperature. On the other hand, Eu3+ ions which exist at the La-site in the bulk of the particles are retained in the ceramic form in the glass–ceramic mixture.
1 Introduction
Exhaustive efforts are being made by scientific communities to develop many novel lanthanide-activated phosphors with superior photostability, enhanced color purity, high quantum efficiency, flexibility in choosing the excitation wavelengths and long fluorescence life time1 for a wide range of applications starting from white light LEDs (WLEDs) to health and medical field. While developing such phosphor materials, doping trivalent lanthanide ions in various hosts is the most preferred strategy due to their sharp emission peaks which arise as a result of electronic transition among 4f orbitals and covering the entire visible to near infrared regions.2–4 Such lanthanide-doped phosphors, which are being used in phosphor-converted LEDs also have high color purity with relatively long lifetime values and result in high quantum yield. At present, the white light in commercial WLEDs is achieved by a combination of Ce:YAG yellow phosphor and blue LED. However, the lack of a red component renders such generated white light with various drawbacks such as high correlated color temperature (CCT > 5500 K) and low color rendering index. Another approach is the combination of blue, green and red phosphors with high color purity with the UV-LED chip. Therefore, the development of more colored pure red phosphors for application in WLEDs possesses high significance. Among the various red-light-emitting phosphors, the best suited red phosphors are those, which contain Eu3+ ions as activators, which results in highly intense red emission and higher quantum efficiency.5,6 Such kind of phosphors give rise to narrow and intense emissions between 605 and 630 nm, and high color purity over other phosphors.7 Therefore, Eu3+ ion is the most favored candidate among the lanthanides to develop red phosphors for its application in generating warm white light with suitable color temperature and high color rendering index.Host lattices made up of d-block transition metals generally possess a very strong excitation band due to charge transfer mechanism, which facilitate efficient energy transfer from host matrix to Eu3+. The compounds of molybdenum have high photochemical and thermal stability and, hence, they are chosen as suitable matrices for incorporating rare earth ions.8 In this context, a thermally and chemically stable molybdate host lattice with an intense wide Mo6+–O2− charge transfer band, which favors NUV excitation, is of particular interest.9 Specifically, La2(MoO4)3 is a suitable host matrix to produce red/green or blue luminescence by replacing La3+ ions with appropriate rare-earth ions of similar ionic radii. Two types of transitions are there in case of lanthanide ions: 4f–4f transitions which are laporte forbidden and represented by sharp emission peaks and 4f–5d charge transfer transitions which are allowed and broad in nature.10–12 Among the lanthanides, the Eu3+ ion is well studied as a red-emitting activator ion due to 5D0 → 7FJ (J = 0, 1, 2, 3, 4) emission transitions with predominant 5D0 → 7F2 transition, which falls in the red region of the visible spectrum.13–15 The excitation and emission spectra of Eu3+ ions give information on the local structure of the ions and their site symmetry. The presence of peaks due to 5D0 → 7F0 transition along with electric dipole (ED) 5D0 → 7F2 transition and magnetic dipole (MD) 5D0 → 7F1 transition gives a lot more information about the lattice site symmetry, especially the local environment in the first co-ordination shell of the dopant ion. The electric dipole 5D0 → 7F2 transition is highly sensitive to the local structure and useful in this context. We have recently demonstrated that by tuning the relative intensity of the ED and MD transition due to change in the local structure, the emission can be tuned between red and orange color.16,17 In addition, the doping of impurity ions such as Bi3+, phosphate, sulphate and vanadate ions also influences Eu3+ ion emissions due to energy transfer or change in the local crystal structure.14,15 Therefore, a structure–property relationship will not only help to optimize the emission properties for a better performance of phosphor materials, but also give a lot of information about the local structure at atomic scale, which is otherwise difficult to get from studies like XRD. Further, various Judd–Ofelt (JO) parameters, viz., ΩJ (J = 2, 4), non-radiative emission rates (ANR), radiative lifetimes (τR) and non-radiative lifetimes (τNR) demonstrated for many Eu3+-doped phosphors by our group earlier will give additional information about the photophysics of the Eu3+ ion and the local structure.7
Most of the commercial WLEDs in the market are composed of an InGaN-based blue LED chip and a Y3Al5O12:Ce3+ (YAG:Ce3+) yellow phosphor. The yellow phosphor is embedded within organic binders or silicone resins. Such organic resins offer a better mixing with the ceramic phosphor powders to form a paste, which can be easily mounted on top of the blue LED chip. However, such resins have weak UV, thermal and chemical stability, which turns their color into brown or yellow. This deteriorates the color quality of the LED in the long term.18 Further, the viscosity of the organic resin also results in an inhomogeneous distribution of phosphor powders within the paste. This results in a blurring behavior of the LED light. In order to overcome these inherent problems of organic resins, various transparent inorganic color converters have been proposed such as phosphor–glass–ceramics or phosphor–glass composites, wherein the phosphor is embedded in the glass matrix.19 Such all-inorganic luminescent glass ceramics (GC) with excellent physical/chemical stability, which can overcome the aforementioned serious issues of phosphor/silicone composite, are gaining importance in recent years, and they are considered as new-generation color converters with high longevity. Thus, GC matrix can be the best host for the development of both down-conversion and up-conversion phosphor materials.20 Therefore, research in the direction of developing glass–ceramic composite-based phosphor materials is highly promising.
Recently, there have been many works reported on the luminescence behavior of Eu3+ ions in molybdates and tungstates. The good color purity of R2(MoO4)3 (R = rare earth elements) as red-light-emitting materials for display and solid-state lighting applications has been studied by various groups.21–30 Zhang et al. have reported the luminescence behaviour of hydrothermally synthesized nanocrystals of Eu3+-doped lanthanum molybdate (will be referred to as Eu-LMO).31 Yi et al. have synthesized Yb/Er co-doped LMO nanocrystals, which show upconversion properties.32 However, it is worth mentioning here that all these nanocrystals possess various surface defects and they may play a major role in determining the emission characteristics of the Eu3+ ion. For example, due to the presence of many defects and impurities (such as OH–) at the surface of the particle, the local structure surrounding Eu3+ ions existing on the surface of the particle will be different than that of those existing inside the bulk of the particles. Further, such defect centers may provide many non-radiative pathways to the excited state of the Eu3+ ion and, hence, there will be a direct impact on the emission characteristics. The best way to avoid such defect centers is to anneal the compound at a higher temperature so that the defect centers are reduced and also the crystal size becomes a bit larger so that more Eu3+ ions go to the bulk of the particle. This will increase the lifetime value of the Eu3+ ions and also the radiative emission. Further, if we vary the concentration of the Eu3+ ions, there will be a change in the ratio of Eu3+ ions present on the surface to that in the bulk, which will also change the emission characteristics.
As far as we know, a systematic study in these directions is not available in the literature, as that carried out in this present study on Eu3+-doped La2(MoO4)3 or Eu-LMO compound synthesized by complex polymerization reaction. Most importantly, all the listed systems are based on ceramic powder. It will be highly advantageous if we can transform the ceramic phosphor powder into a glass form so that it will behave as a glass–ceramic composite and can overcome all the aforementioned issues of organic resins in commercial phosphors. Such a glass–ceramic phosphor composite can be used directly in combination with blue LEDs.18,19 Although most of the rare-earth molybdates have well-characterized crystalline and magnetic structures, there is not enough report on the preparation and structural information of glass–ceramic-based molybdate systems. Although MoO3 is a good conditional network former, it is not able to form a glass by itself even with rapid cooling rates. However, a few reports have shown that molybdate systems containing rare-earth oxides have a tendency to form glass wherein the rare earth ions act as modifiers.33–36 This is the first report wherein using various spectroscopic techniques we have shown that the LMO matrix undergoes a glass transition at 1002 °C and beyond this temperature the compound is composed of both the ceramic and glass form, making a GC composite. Interestingly, the advantage of such a system is that we do not need to embed the ceramic phosphor in a glass matrix, as suggested by another group.19 Rather, the same material will have a ceramic form of the phosphor embedded in the glass matrix formed by the MoO3. Further, the emission properties of the Eu3+ ion and its decay kinetics in the glass–ceramic form and a detail understanding about how such Eu3+ or La3+ ions present in the grain-boundaries and in the bulk of the particles are coming into the glass network will be highly promising areas of research. Through this report, we have given a detailed information about the tunable emission properties and decay kinetics of Eu3+ ion in the glass–ceramic form, the role of La3+ or Eu3+ ions in the glass–forming network and a comparison of the phosphor characteristics of the GC form to that of the ceramic form for the first time. In addition, the impact of the defect structure on the optical properties and calculation of various Judd–Ofelt (JO) parameters of both ceramic and glass–ceramic forms have also been reported. Such a comprehensive report will be highly beneficial for the future development of new-generation GC-based color converters, which are a potential alternative to the present phosphor/silicone composite being used in commercial LEDs.
2 Experimental and instrumentation
2.1. Synthesis
La2(MoO4)3 was synthesized by the complex polymerization method. The starting materials used were La2O3 (99.99%, Rare Earth Development Division, BARC) and MoO3 (99.5%, M s−1 Alfa Aesar). The complexing agent used in the process of synthesis was citric acid (99.7%, M s−1 Chemco fine chemicals, Mumbai). Ethylene glycol (99.0%, M s−1 Thomas Baker, Mumbai) was used for polyesterification to stabilize the metal complex. Initially, the as-received La2O3 was dissolved in specpure nitric acid and the exact concentration of lanthanum in the solution was assayed using Inductively Coupled Plasma Mass Spectrometry (ICPMS). The required quantity of MoO3 was added to citric acid solution and kept on a hot plate at 80 °C upon constant stirring. Initially, the solution was turbid. But, upon the addition of ammonia solution a clear solution was obtained at pH ∼6.5. Then, the required volume of lanthanum solution was added to the above solution. The amount of citric acid taken was that needed to maintain a fuel to oxidant ratio of 1.0. After mixing, ethylene glycol was added to the clear solution with La and Mo. The weight ratio of citric acid and ethylene glycol was 6![[thin space (1/6-em)]](https://www.rsc.org/images/entities/char_2009.gif) :4. The solutions were stirred for 20–30 minutes at 80 °C. Then, upon constant evaporation, a transparent polymeric gel was formed. Subsequently, the gel was burnt by increasing the temperature of the hot plate to 500 °C. A part of the foamy carbonaceous precursor was ground and kept at 750 °C for 6 h and the rest was kept at 1050 °C for 16 h in open air. The heating rate used was 5 K min−1 and cooling was not controlled, it followed the natural cooling of the furnace. For convenience, the samples heated at 750 °C and 1050 °C are designated as LMO-750 and LMO-1050, respectively, from this point onwards in the manuscript. Various Eu3+-doped samples such as 0.1 mol% Eu3+-doped LMO (Eu0.1-LMO), 0.5 mol% Eu3+-doped LMO (Eu0.5-LMO), 1.0 mol% Eu3+-doped LMO (Eu1.0-LMO), 2.0 mol% Eu3+-doped LMO (Eu2.0-LMO), 3.0 mol% Eu3+-doped LMO (Eu3.0-LMO) and 5.0 mol% Eu3+-doped LMO (Eu5.0-LMO) were prepared following a similar procedure like that of LMO after adding an appropriate amount of Eu3+ nitrate solution to the Lanthanum nitrate solution. All these Eu-LMO compounds were heated at 750 °C for 6 h (will be referred to as Eu-LMO-750) and at 1050 °C for 16 h (will be referred to as Eu-LMO-1050) in open air. The LMO-750 compound was obtained in the powder form, while LMO-1050 was obtained in the glass form after rapid cooling.
:4. The solutions were stirred for 20–30 minutes at 80 °C. Then, upon constant evaporation, a transparent polymeric gel was formed. Subsequently, the gel was burnt by increasing the temperature of the hot plate to 500 °C. A part of the foamy carbonaceous precursor was ground and kept at 750 °C for 6 h and the rest was kept at 1050 °C for 16 h in open air. The heating rate used was 5 K min−1 and cooling was not controlled, it followed the natural cooling of the furnace. For convenience, the samples heated at 750 °C and 1050 °C are designated as LMO-750 and LMO-1050, respectively, from this point onwards in the manuscript. Various Eu3+-doped samples such as 0.1 mol% Eu3+-doped LMO (Eu0.1-LMO), 0.5 mol% Eu3+-doped LMO (Eu0.5-LMO), 1.0 mol% Eu3+-doped LMO (Eu1.0-LMO), 2.0 mol% Eu3+-doped LMO (Eu2.0-LMO), 3.0 mol% Eu3+-doped LMO (Eu3.0-LMO) and 5.0 mol% Eu3+-doped LMO (Eu5.0-LMO) were prepared following a similar procedure like that of LMO after adding an appropriate amount of Eu3+ nitrate solution to the Lanthanum nitrate solution. All these Eu-LMO compounds were heated at 750 °C for 6 h (will be referred to as Eu-LMO-750) and at 1050 °C for 16 h (will be referred to as Eu-LMO-1050) in open air. The LMO-750 compound was obtained in the powder form, while LMO-1050 was obtained in the glass form after rapid cooling.
The instrumentation details for various studies have been provided in the ESI.†
3 Results and discussions
3.1. Phase purity and morphology study: X-ray diffraction (XRD) and scanning electron microscope (SEM) study
The synthesis of LMO was carried out at 750 °C and 1050 °C to arrive at the ceramic and glass–ceramic form, respectively. The purity and crystallographic structure of LMO-750 and LMO-1050 were investigated by XRD, as shown in Fig. 1. All the sharp peaks in the pattern of LMO-750 and LMO-1050 match with the reported pattern with PCPDF file no: 70-1382 and 45-0407, respectively. The peaks of LMO-750 and LMO-1050 are identified to be of monoclinic structure. Interestingly, the XRD pattern of the LMO-1050 compound appears to be broad. A similar observation is also made for the Eu3+-doped compounds, and the XRD patterns are given in the ESI (Fig. S1†). This indicates that at 1050 °C, the compound also possesses an amorphous glass form along with the crystalline form which results in the broadening of the XRD patterns. To further confirm that there is the formation of the amorphous glass form, thermogravimetric analysis (TGA) and differential scanning calorimetry (DSC) were carried out. | ||
| Fig. 1 XRD patterns of LMO-750 and LMO-1050. | ||
Fig. 2a and b is the SEM micrographs of LMO-1050, which shows some agglomerated structure wherein the ceramic form is embedded in the glass matrix. Upon magnification in Fig. 2b, it can be seen that it has a pretzel type of morphology.
 | ||
| Fig. 2 SEM micrographs of LMO-1050 (a and b) at different magnifications. | ||
3.2. Thermogravimetric analysis (TGA) and differential scanning calorimetry (DSC)
Fig. 3 shows the thermogram of LMO-750 in the temperature range of 30–1400 °C obtained from TGA and DSC. The sample is found to melt at 1002 °C and to lose weight starting at ∼1284 °C. As no peak is observed in the heat flow rate vs. temperature curve before melting, it can be concluded that LMO exists as a single phase below the melting temperature of 1002 °C. As observed from XRD study that for the LMO-1050 compound the patterns are similar but are broad in nature, it can be concluded that the compound is transformed into glass form after the melting temperature of 1002 °C.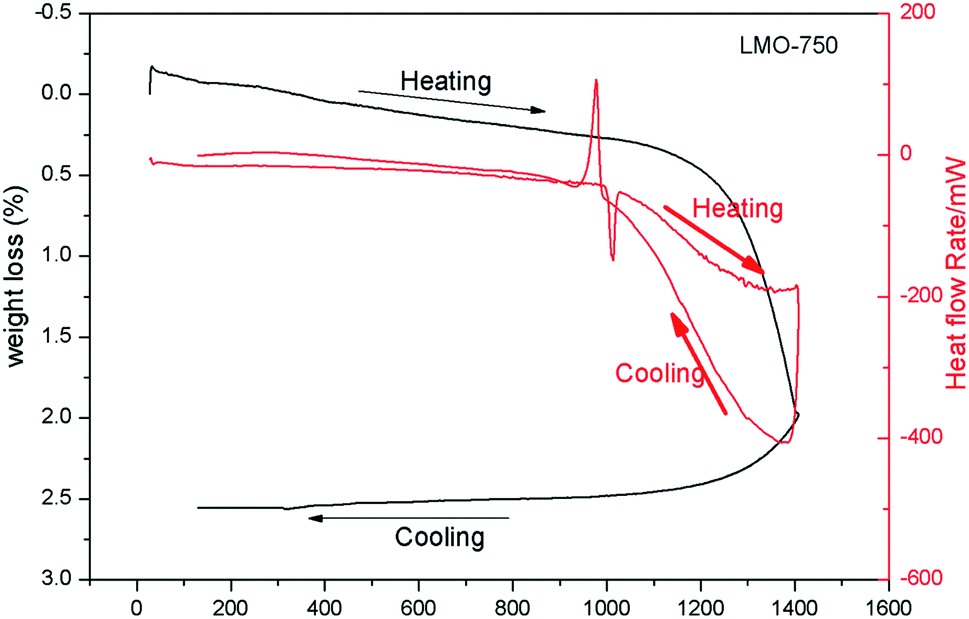 | ||
| Fig. 3 TGA (black) and DSC (red) spectra of LMO-750. | ||
3.3. Raman and Fourier-transform infrared (FTIR) spectroscopy
Raman spectroscopy is an invaluable technique to study the structural variations at the microstructure level. Fig. 4 shows the Raman spectrum of LMO-750 and LMO-1050. A typical signature of tetrahedral MoO42− in the form of two prominent Raman bands is observed in the region of 130–458 cm−1 and 698–1050 cm−1, as observed in the case of scheelite BaMoO4 and SrMoO4.30 The sharp Raman bands in the region 698–1050 cm−1 are attributed to symmetric (s–nstr) and asymmetric stretching (a–nstr) vibrational modes, while those in the range 130–458 cm−1 are generally assigned to the asymmetric and symmetric bending vibrational modes of MoO42− tetrahedra.37 It can be seen that Raman bands are highly broadened for LMO-1050 compared to that of LMO-750. This can be explained on the basis of the glass–ceramic nature of the compound at this annealing temperature. In amorphous compounds the distribution of formula units with different bond angles and lengths produces a distribution of states of slightly varying vibrational energies, which results in the broadening of the Raman bands. | ||
| Fig. 4 Raman spectra of LMO-750 and LMO-1050. | ||
The FTIR spectra of both LMO-750 and LMO-1050 are presented in Fig. 5, and both the compounds show similar splitting patterns which are assigned to the characteristic stretching vibrations of MoO42− clusters in the region 400–1000 cm−1. The first absorption peak at ∼690 cm−1 is found to be broadening at high temperature. The multiple splitting bands in the region below 912 cm−1 are assigned to the stretching vibrations of the MoO42− cluster. A strong absorption peak in the region of 800 cm−1 corresponds to the anti-symmetric stretching of Mo–O bonds.38 It can be seen that the FTIR spectra are also broadened when LMO is heated at a higher temperature viz. LMO-1050, and the explanation is the same as that for the Raman study, i.e. the formation of the amorphous phase.
 | ||
| Fig. 5 FTIR spectra of LMO-750 and LMO-1050. | ||
3.4. Photoluminescence spectroscopy
Fig. 6 represents the photoluminescence excitation spectra of Eu-LMO-750 and Eu-LMO-1050. The spectra are composed of broad bands in the 200–320 nm regions and many sharp transitions in the 350–450 nm regions. The broad band in the region 200–320 nm can be attributed to the charge transfer band (CTB). This broad CTB may arise due to three different processes: (i) host absorption by the transfer of electron from the O2− ligand to Mo6+, (ii) charge transfer of electron from the 4f state of Eu3+ to Mo6+ and (iii) electron transfer from the filled 2p orbitals of O2− anions to the vacant 4f orbitals of Eu3+.39 Due to the higher charge associated with Mo6+, the CTB in the lower wavelength region is attributed to O2− ligand to Mo6+ charge transfer transition, while in the higher wavelength region i.e. the 270–300 nm region it is due to O2− ligand to Eu3+ charge transfer transition.7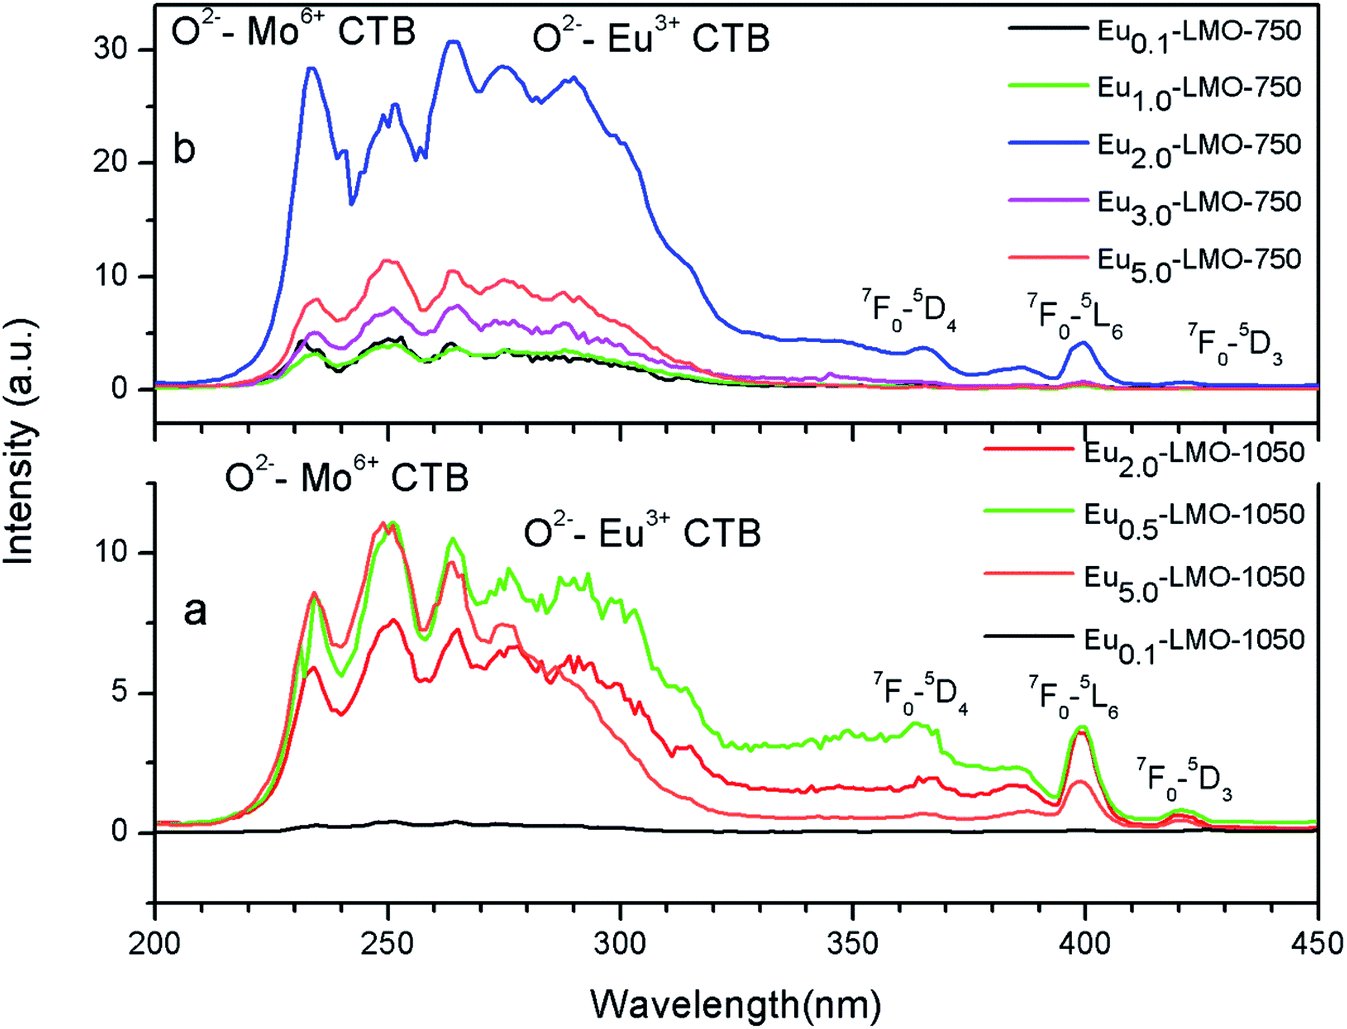 | ||
| Fig. 6 Excitation spectra of various Eu-LMO-750 and Eu-LMO-1050 samples at 620 nm emission wavelength. | ||
The sharp peaks in the region 300–450 nm represent intra-configurational f–f transition of Eu3+. The (7F0 → 5L6) at 398 nm is the most intense and the less intense peaks are observed at 365 nm (7F0 → 5D4), 380 nm (7F0 → 5G2, 5G3), and 421 nm (7F0 → 5D3). This indicates that ultra-violet (UV), near-UV, UV B (UVB), and blue laser diodes/LEDs can be used as effective pumping sources for red emission from Eu3+ ions. The allowed charge transfer transitions are found to be intense as compared to the forbidden f–f transitions.
The emission spectrum of LMO is provided in the ESI (Fig. S2†), which shows a strong broad host emission band consisting of various peaks due various electronic transitions arising from the MoO4 moiety and various oxygen vacancies. The emission spectra of various Eu-LMO-750 and Eu-LMO-1050 samples are shown in Fig. 7, wherein four transitions are observed due to the Eu3+ ion, viz. 5D0 → 7F1 (593 nm), 5D0 → 7F2 (617 nm), 5D0 → 7F3 (656 nm) and 5D0 → 7F4 (704 nm). The transition 5D0 → 7F1 (593 nm) is magnetically allowed and is known as magnetic dipole transition (MDT) and it is not affected much by the local environment around the Eu3+ ion. But, the transition 5D0 → 7F2 (617 nm) is electrically allowed electric dipole transition (EDT) and is extremely sensitive to the local environment surrounding the Eu3+ ion like symmetry and the local structure.7 At an asymmetric environment, the EDT becomes an allowed one due to relaxation of the selection rule. It can be found that for both Eu-LMO-750 and Eu-LMO-1050 samples the highest intensity is observed for 2.0 mol% Eu3+-doped compounds and beyond 2.0 mol% of Eu3+ ion concentration the intensity decays due to concentration quenching, wherein the excitation energy is lost in terms of multi-polar interactions due to the shorter gap among the Eu3+ ions than the critical distance.40 It is interesting to see that the 5D0–7F4 is more intense in case of Eu-LMO-750 compared to that in Eu-LMO-1050. Such changes in the 5D0–7F4 line are associated when there is a change in structural order–disorder in the compound, and a high intense 5D0–7F4 line is always associated with a crystal structure without any inversion symmetry.41–44 Thus, a low intensity of the 5D0–7F4 line suggests the fact that upon heating the crystal structure becomes more symmetric. The ratio of the integral emission intensity of the EDT and MDT, also called as the asymmetry factor (A), measures the extent of local structural distortion surrounding the europium ion, as reported in our earlier cases.7 The fact that the EDT is more intense compared to the MDT in the present case indicates that Eu3+ exists in an asymmetric environment. In the present study, for both the Eu-LMO-750 and Eu-LMO-1050 samples, the EDT is much more intense than the MDT, which infers that the Eu3+ at the La3+ site does not have an inversion symmetry. Further, the asymmetry ratio i.e. EDT/MDT for the 2 mol% Eu3+-doped Eu2.0-LMO-750 sample is found to be 11.5, while that for the same doping level Eu2.0-LMO-1050 is found to be 8.86. This decrease in A value is directly related to change in the surrounding local structure of Eu3+ ions, upon heating the LMO-750 compound the surrounding local structure especially in the first co-ordination shell of Eu3+ ions must have become less distorted. Now, defect in the form of lattice vacancies or elemental impurity surrounding the Eu3+ ion will play the main role of inducing an asymmetric environment at a lattice site. Defect centers such as many oxygen vacancies are generally annealed upon sintering the compound at a higher temperature in open air atmosphere. Further, the surface defect density is also reduced upon thermal treatment of the compounds due to decrease in surface area. The fact that the asymmetry ratio decreases upon thermal annealing is due to the disappearance of such defect centers surrounding the Eu3+ ion. Such defect centers may also create a different co-coordinating sphere for the Eu3+ ion and, hence, a change in the decay kinetics will be observed, because any such changes will have an immediate impact on the excited state of the Eu3+ ions. Further, since the Eu-LMO-1050 compound is glass–ceramic in nature, it might be possible that some of the Eu3+ ions which exist in the grain boundaries in the crystalline ceramic form and thereby possess a large asymmetric surrounding may get a new coordination in the glass form wherein the surrounding is less asymmetric in nature. Now, before investigating the photoluminescence lifetime values of various Eu3+ ions present in different environments, let us see the color coordinates of the respective samples (both ceramic and glass–ceramic forms) for their application as phosphor materials.
 | ||
| Fig. 7 Emission spectra of various Eu-LMO-750 and Eu-LMO-1050 samples at CTB (290 nm) excitation wavelength. | ||
In order to evaluate the colorimetric performance of the phosphor materials, the CIE chromaticity coordinates were evaluated both for the ceramic (Eu-LMO-750) and glass–ceramic (Eu-LMO-1050) forms. The values of the x and y coordinates of the compounds are represented by the star and circle marks in the CIE diagram in Fig. 8. It can be observed that while the undoped LMO is near the white-light-emitting materials, the Eu-doped LMO compounds are red-emitting phosphor materials. It can also be seen that with increasing concentration of Eu3+ ions, the Eu-LMO compounds are becoming more and more reddish in nature. This is purely due to the increase in the intensity of the red line 5D0–7F2 compared to the orange line 5D0–7F1. Further, in many cases, the compound heated at a higher temperature i.e. the glass–ceramic form is found to be more red pure than the crystalline form. For instance, the Eu0.03-LMO-1050 (CIE color coordinates x, y = 0.63, 0.32) and Eu0.02-LMO-1050 (CIE color coordinates x, y = 0.62, 0.32) compounds are more reddish than the Eu0.03-LMO-750 (CIE color coordinates x, y = 0.59, 0.30) and Eu0.02-LMO-750 (CIE color coordinates x, y = 0.60, 0.31) compounds. Another best way to check whether there is an improvement in phosphor characteristics in the glass–ceramic forms is to calculate their color purities.
 | ||
| Fig. 8 CIE diagram of different Eu-LMO-750 and Eu-LMO-1050 samples. | ||
The color purity of the samples was calculated following eqn (1):7
 | (1) |
 | (2) |
 | ||
| Fig. 9 Decay profiles of various Eu-LMOs at CTB excitation. | ||
The relative percentage of a specific lifetime was also calculated following the formula
 | (3) |
The two different lifetimes obtained for different Eu3+-doped compounds are given in Table 1. The presence of two lifetime values for all the compounds suggests that Eu3+ ions exist in two different environments. It can be seen that for all the compounds the short-lived component has a major contribution compared to the long-lived component. It is observed that upon thermal annealing both the lifetime values are changed, which indicates a change in the local surrounding of the Eu3+ ion. Interestingly, the lifetime value of the long-lived component has been found to increase when the compounds are heated at a higher temperature i.e. 1050 °C in most of the cases, except in the 0.1 mol% Eu3+-doped compound. On the contrary, the short-lived component is found to be less affected by such thermal annealing. Therefore, there must be a change in the surrounding local structure of the long-lived Eu3+ component. Due to the fact that the ionic radii of Eu3+ and La3+ ions are very close and Eu3+ ions are bigger than Mo6+ ions, Eu3+ ions are mostly favorable to go to the La-site. Since there are no charge differences at the La-site, we believe that the newly formed defect centers due to charge imbalance will be minimum surrounding such lattice sites and only those defects which are intrinsic in nature and present in the as-prepared samples (such as oxygen vacancies) will have an impact on the excited state of the Eu3+ ion. Therefore, the long-lived component is due to Eu3+ ions existing in the La-lattice sites and far from such defect centers. On the other hand, the short-lived component must be due to some other origin such as Eu3+ ions existing in the La-sites which are close to the grain boundaries or on the surface of the particles. In such cases the Eu3+ ions will not have a saturated co-ordination number and many other defect centers may be present close to the Eu3+ ions, which may provide non-radiative pathways and, hence, the lifetime value will be less. Therefore, the short-lived component is due to Eu3+ ions present in the grain boundaries or on the surface of the particles. With increase in sintering temperature, the compound has a tendency to form a glass at around 1002 °C, wherein all the grain boundaries will be lost and the Eu3+ ions which exist in such a place will be in a different asymmetric glass network. On the other hand, the other Eu3+ ions which are placed in the La-site in the bulk of the ceramic particle will still be in the ceramic form, and, since the surrounding defect centers are getting annealed, the excited state will be a more stable one. Therefore, the long-lived component of the glass–ceramic form represents the Eu3+ ions in the ceramic form, while the short-lived component represents those in the glass form. Hence, it can be concluded that upon thermal annealing the long-lived Eu3+ component in the ceramic form retains its local structure, while the short-lived component in the grain boundaries or on the surface of the particle becomes a part of the glass network. Since Eu3+ and La3+ ions have similar charges and close ionic radii, the La3+ ions present on the grain boundaries will also follow a similar trend.
| Compound | Short-lived component (μs) | Long-lived component (μs) |
|---|---|---|
| Eu0.1-LMO-750 | 497.51 (72%) | 774.55 (28%) |
| Eu0.1-LMO-1050 | 380.93 (40%) | 575.10 (60%) |
| Eu1.0-LMO-750 | 475.72 (78%) | 754.70 (22%) |
| Eu1.0-LMO-1050 | 515.12 (81%) | 1357.05 (19%) |
| Eu3.0-LMO-750 | 497.56 (85%) | 918.81 (15%) |
| Eu3.0-LMO-1050 | 506.65 (80%) | 1218.99 (20%) |
| Eu5.0-LMO-750 | 486.93 (66%) | 783.44 (34%) |
| Eu5.0-LMO-1050 | 479.70 (76%) | 1175.41 (24%) |
| Compound | AR (s−1) |
|---|---|
| Eu0.1-LMO-750 | 115.89 |
| Eu0.1-LMO-1050 | 115.22 |
| Eu1.0-LMO-750 | 127.31 |
| Eu1.0-LMO-1050 | 132.16 |
| Eu2.0-LMO-750 | 176.73 |
| Eu2.0-LMO-1050 | 178.69 |
| Eu3.0-LMO-750 | 172.95 |
| Eu3.0-LMO-1050 | 174.75 |
| Eu5.0-LMO-750 | 179.61 |
| Eu5.0-LMO-1050 | 186.34 |
4 Conclusion
Various Eu-LMOs were prepared both in ceramic and glass–ceramic forms by annealing at different temperatures. XRD, Raman, and FTIR studies confirmed that the Eu-LMO-1050 compound is in the glass–ceramic form while the Eu-LMO-750 is in the ceramic form. TGA and DSC studies confirmed that there is a glass transition temperature at 1002 °C. It was observed that for LMO-1050 the peaks in the XRD, FTIR and Raman spectra are broad in nature due to the amorphous nature of the glass form. Photoluminescence studies showed that the glass–ceramic form has more red color purity and radiation transition probability than the ceramic form and, hence, more suitable for application as phosphor material. Photoluminescence lifetime studies revealed that there are two different lifetime components, both in the ceramic and glass–ceramic form. The long-lived Eu3+ component in the ceramic form was found to retain its structure, while the short-lived component was found to get into the glass network.Author contributions
The contribution of the authors to this work is as follows.Manjulata Sahu: resources, preparation of compounds, characterization of the compounds using XRD, FTIR, SEM and Raman and writing the relevant part.
Nimai Pathak: conceptualization, methodology, supervision, visualization, photoluminescence and XRD investigation, data analysis of all the experiments, writing initial draft, reviewing and editing.
M.K Saxena: resources.
Conflicts of interest
Authors declare that there is no conflict of interest associated with this work.Acknowledgements
The authors thank Dr P. K. Pujari, Director, Radiochemistry and Isotope group for his encouragement and help during the course of this project. The authors are thankful to Dr K. Krishnan and Mr S. Muhammed, Fuel chemistry Division for helping in obtaining the results of XRD. Authors are also thankful to Dr A. K. Sahu, Advanced Materials Division for getting the SEM pictures. Thanks are also due to Dr D. Jain, Chemistry Division for Raman spectra and Mr Bal Govind Vats, Fuel Chemistry Division for FTIR. The work is funded by our institute that is BARC, Mumbai.References
- X. Qin, X. Liu, W. Huang, M. Bettinelli and X. Liu, Chem. Rev., 2017, 117(5), 4488–4527 CrossRef CAS PubMed.
- S. Wang, J. Xu, J. Wang, K. Y. Wang, S. Dang, S. Song, D. Liu and C. Wang, J. Mater. Chem. C, 2017, 5, 6620–6628 RSC.
- X. Zhang and M. Gong, Ind. Eng. Chem. Res., 2015, 54, 7632–7639 CrossRef CAS.
- J. Yang, L. Zhou, L. Yuan, X. Zhou, B. Hu, X. Zhang and S. Hu, New J. Chem., 2016, 40, 7350–7358 RSC.
- P. Du and J. S. Yu, J. Lumin., 2016, 179, 451 CrossRef CAS.
- R. S. Yadav, R. K. Dutta, M. Kumar and A. C. Pandey, J. Lumin., 2009, 129, 1078 CrossRef CAS.
- (a) N. Pathak, S. Mukherjee, B. P. Mandal, A. K. Yadav, S. N. Jha and D. Bhattacharyya, Mater. Adv., 2020, 1, 2380–2394 RSC; (b) N. Pathak, P. S. Ghosh, S. Mukherjee and B. P. Mandal, RSC Adv., 2020, 10, 31070–31086 RSC; (c) P. Das, N. Pathak, B. Sanyal, S. Dash and R. M. Kadam, J. Alloys Compd., 2019, 810, 151906 CrossRef CAS; (d) P. Das, N. Pathak, P. Modak and B. Modak, J. Hazard. Mater., 2021, 411, 125025 CrossRef CAS; (e) N. Pathak, S. Mukherjee, D. Das, D. Dutta, S. Dash and R. M. Kadam, J. Mater. Chem. C, 2020, 8, 7149–7161 RSC; (f) S. Mukherjee, N. Pathak, D. Das and D. Dutta, RSC Adv., 2021, 11, 5815–5831 RSC; (g) D. Hebbar, K. S. Choudhari, N. Pathak, S. A. Shivashankar and S. D. Kulkarni, J. Alloys Compd., 2018, 768, 676–685 CrossRef; (h) K. Sanyal, N. Pathak, A. K. Yadav, B. Kanrar, R. M. Kadam, S. N. Jha, D. Bhattacharya and N. L. Misra, Dalton Trans., 2016, 45, 7650–7664 RSC; (i) S. K. Gupta, P. S. Ghosh, N. Pathak and R. M. Kadam, RSC Adv., 2016, 6, 42923–42932 RSC; (j) D. Hebbar, K. S. Choudhari, N. Pathak, S. A. Shivashankar and S. D. Kulkarni, Mater. Res. Bull., 2019, 119, 110544 CrossRef; (k) S. K. Gupta, N. Pathak and R. M. Kadam, J. Lumin., 2016, 169, 106–114 CrossRef CAS.
- P. Kumar and B. K. Gupta, RSC Adv., 2015, 5, 24729–24736 RSC.
- M. Pawlikowska, M. Piątkowska and E. Tomaszewicz, J. Therm. Anal. Calorim., 2017, 130, 69–76 CrossRef CAS.
- G. Anjaiah, S. K. Nayab Rasool and P. Kistaiah, J. Lumin., 2015, 159, 110–118 CrossRef CAS.
- X. Liu, C. Li, Z. Quan, Z. Cheng and J. Lin, J. Phys. Chem. C, 2007, 111, 16601–16607 CrossRef CAS.
- X. Liu, Y. Lü, C. Chen, S. Luo, Y. Zeng, X. Zhang, M. Shang, C. Li and J. Lin, J. Phys. Chem. C, 2014, 118, 27516–27524 CrossRef CAS.
- K. P. F. Siqueira, P. P. Lima, R. A. S. Ferreira, L. D. Carlos, E. M. Bittar, F. M. Matinaga, R. Paniago, K. Krambrock, R. L. Moreira and A. Dias, J. Phys. Chem. C, 2015, 119, 17825–17835 CrossRef CAS.
- Y. R. Parauha, R. S. Yadav and S. J. Dhoble, Opt. Laser Technol., 2020, 124, 105974 CrossRef CAS.
- E. Rai, R. S. Yadav, D. Kumar, A. K. Singh, V. Janardhan, F. Shyam and B. Rai, Spectrochim. Acta, Part A, 2020, 243, 118787 CrossRef CAS PubMed.
- R. Phatak, N. Pathak, S. Muhammed, S. K. Sali and A. Das, ChemPlusChem, 2018, 83, 1144–1152 CrossRef CAS PubMed.
- R. Phatak, N. Pathak, S. Muhammed, A. Das and S. K. Sali, J. Am. Ceram. Soc., 2020, 103, 2617–2629 CrossRef CAS.
- W. J. Chung and Y. H. Nam, ECS J. Solid State Sci. Technol., 2020, 9, 016010 CrossRef.
- D. Zhang, W. Xiao, C. Liu, X. Liu, J. Ren, B. Xu and J. Qiu, Nat. Commun., 2020, 11, 2805 CrossRef CAS.
- L. Lei, X. Dai, Y. Cheng, Y. Wang, Z. Xiao and S. Xu, J. Mater. Chem. C, 2019, 7, 3342–3350 RSC.
- N. Zhang, W. Bu, Y. Xu, D. Jiang and J. J. Shi, J. Phys. Chem. C, 2007, 111, 5014–5019 CrossRef CAS.
- X. X. Wang, Y. L. Xian, G. Wang, J. X. Shi, Q. Su and M. L. Gong, Opt. Mater., 2007, 30, 521–526 CrossRef CAS.
- X. X. Wang, J. Wang, J. X. Shi, Q. Su and M. L. Gong, Mater. Res. Bull., 2007, 42, 1669–1673 CrossRef CAS.
- X. Zhao, X. Wang, B. Chen, Q. Meng, B. Yan and W. Di, Opt. Mater., 2007, 29, 1680–1684 CrossRef CAS.
- S. F. Wang, K. K. Rao, Y. R. Wang, Y. F. Hsu, S. H. Chen and Y. C. Lu, J. Am. Ceram. Soc., 2009, 92, 1732–1738 CrossRef CAS.
- Y. Tian, X. Qi, X. Wu, R. Hua and B. Chen, J. Phys. Chem. C, 2009, 113, 10767–10772 CrossRef CAS.
- J. Wan, L. Cheng, J. Sun, H. Zhong, X. Li, W. Lu, Y. Tian, H. Lin and B. Chen, J. Alloys Compd., 2010, 496, 331–334 CrossRef CAS.
- X. He, M. Guan, Z. Li, T. Shang, N. Lian and Q. Zhou, J. Rare Earths, 2010, 28, 878–882 CrossRef CAS.
- S. Abtmeyer, R. Pązik, R. J. Wiglusz, M. Małecka, G. A. Seisenbaeva and V. G. Kessler, Inorg. Chem., 2014, 53, 943–951 CrossRef CAS PubMed.
- A. Katelnikovas, J. Plewa, S. Sakirzanovas, D. Dutczak, D. Enseling, F. Baur, H. Winkler, A. Kareiva and T. Jüstel, J. Mater. Chem., 2012, 22, 22126–22134 RSC.
- N. Zhang, W. Bu, Y. Xu, D. Jiang and J. Shi, J. Phys. Chem. C, 2007, 111, 5014–5019 CrossRef CAS.
- G. Yi, B. Sun, F. Yang, D. Chen, Y. Zhou and J. Cheng, Chem. Mater., 2002, 14, 2910–2914 CrossRef CAS.
- M. Fabian, E. Svab and K. Krezhov, J. Phys.: Conf. Ser., 2016, 746, 012068 CrossRef.
- L. Alexandrov, R. Iordanova, Y. Dimitriev, K. Hamda, J. Ide and M. Milanova, Adv. Mater. Res., 2008, 37, 39–40 Search PubMed.
- L. Alexandrov, R. Iordanova and Y. Dimitriev, J. Non-Cryst. Solids, 2009, 355, 2023 CrossRef.
- L. Alexandrov, T. Komatsu, R. Iordanova and Y. Dimitriev, J. Phys. Chem. Solids, 2011, 72, 263 CrossRef.
- Y. Zhou and B. Yan, CrystEngComm, 2013, 15, 5694–5702 RSC.
- Y. Zhang and M. Yu, RSC Adv., 2016, 6, 76652 RSC.
- M. Keskar, S. K. Gupta, R. Phatak, S. Kannan and V. Natarajan, J. Photochem. Photobiol., A, 2015, 311, 59 CrossRef CAS.
- Monika, R. S. Yadav, A. Rai and S. B. Rai., Sci. Rep., 2021, 11, 4148 CrossRef CAS PubMed.
- L. C. Thompson and S. C. Kuo, Inorg. Chim. Acta, 1988, 149, 305–306 CrossRef CAS.
- G. Blasse, Inorg. Chim. Acta, 1988, 142, 153–154 CrossRef CAS.
- F. Chi, X. Wei, S. Zhou, Y. Chen, C. Duan and M. Yin, Inorg. Chem. Front., 2018, 5, 1288–1293 RSC.
- M. Bettinelli, A. Speghini, F. Piccinelli, A. N. C. Neto and O. L. Malta, J. Lumin., 2011, 31, 1026–1028 CrossRef.
Footnote |
| † Electronic supplementary information (ESI) available. See DOI: 10.1039/d1ra01715b |
| This journal is © The Royal Society of Chemistry 2021 |