
 Open Access Article
 This Open Access Article is licensed under a Creative Commons Attribution-Non Commercial 3.0 Unported Licence
Ultrasensitive biosensing platform based on luminescence quenching ability of fullerenol quantum dots†
Hui Li abcde,
Hua Pangab,
Liangxiao Zhangace,
Jin Maoac,
Wen Zhangac,
Jun Jiangac,
Peiwu Li*abcde and
Qi Zhang*abcde
abcde,
Hua Pangab,
Liangxiao Zhangace,
Jin Maoac,
Wen Zhangac,
Jun Jiangac,
Peiwu Li*abcde and
Qi Zhang*abcde
aOil Crops Research Institute, Chinese Academy of Agricultural Sciences, Wuhan 430062, China. E-mail: peiwuli@oilcrops.cn; zhangqi521x@126.com; Tel: +86-27-8681-2943 Tel: +86-27-8671-1839
bKey Laboratory of Biology and Genetic Improvement of Oil Crops, Ministry of Agriculture, Wuhan 430062, China
cNational Reference Laboratory for Agricultural Testing (Biotoxin), Wuhan 430062, China
dKey Laboratory of Detection for Mycotoxins, Ministry of Agriculture, Wuhan 430062, China
eLaboratory of Quality and Safety Risk Assessment for Oilseed Products (Wuhan), Ministry of Agriculture, Wuhan 430062, China
First published on 1st June 2021
Abstract
An ultrasensitive biosensing platform for DNA and ochratoxin A (OTA) detection is constructed based on the luminescence quenching ability of fullerenol quantum dots (FOQDs) for the first time. As the surface of FOQDs is largely covered by hydroxyl groups, stable colloidal suspension of FOQDS in aqueous solution can be obtained, which is very advantageous for application in biosensing compared to nano-C60. FOQDs can effectively quench the fluorescence of dyes with different emission wavelengths that are tagged to bioprobes to an extent of more than 87% in aqueous buffer solution through a PET mechanism. Moreover, the nonspecific quenching of the fluorescent dyes (not bound to bioprobes) caused by FOQDs is negligible, so the background signal is extremely low which is beneficial for improving the detection sensitivity. Based on the π–π stacking interaction between FOQDs and bioprobes, such as single-stranded (ss) DNA and aptamers, a nucleic acid assay with a detection of limit of 15 pM and a highly sensitive OTA assay with a detection limit of 5 pg mL−1 in grape juice samples are developed through the simple “mix and measure” protocol based on luminescence quenching-and-recovery. This is the first demonstration of constructing biosensors utilizing the luminescence quenching ability of FOQDs through a PET mechanism, and the pronounced assay performance implies the promising potential of FOQDs in biosensing.
Carbon nanostructures, such as two-dimensional graphene and its derivatives,1–5 one-dimensional carbon nanotubes (CNTs)6–9 and zero-dimensional carbon dots10–17 have attracted increasing attention in biosensing and biological related studies due to their unique electronic and optical properties. In the last decade, the luminescence quenching ability of carbon nanostructures has been extensively studied and various kinds of biosensing platforms have been constructed accordingly,18–21 with which the single-stranded DNA (ssDNA) or polypeptide probes are generally assembled onto carbon nanostructures via π–π stacking interactions.22–24 In recent years, several biosensing platforms have been constructed based on the luminescence quenching ability of nano-C60 towards fluorescent dyes and the π–π stacking interaction between single-stranded DNA (ssDNA) and nano-C60.25–27 However, their relatively poor dispersibility in aqueous solution has restricted their wide use in biosensing applications. Fullerenols, also named polyhydroxylated fullerenes, are the main derivative of fullerenes with good water-solubility and excellent biocompatibility.28–30 They have attracted great attention in recent years and can work as antioxidative agents,31,32 free radical scavengers,33,34 drug delivery vehicle35,36 and so forth. Most recently, Yang et al. reported that the intrinsic fluorescence of serum proteins (bovine serum albumin (BSA) and γ-globulins) could be effectively quenched by fullerenol through a dynamic mechanism, which was used to characterize the fullerenol–protein interactions.37 However, its applicability in biosensing is relatively unexplored. Inspired by the above findings, we expect that fullerenol quantum dots (FOQDs) could be used in other potential label-free nanoplatforms for homogeneous biosensing with wide applications.
We herein propose a novel and effective homogeneous fluorescent biosensing platform based on the luminescence quenching ability of FOQDs towards different fluorescent dyes for the first time. As an initial trial, a ssDNA chain was used as the probe for DNA detection. As shown in Scheme 1, the FAM attached ssDNA (FAM–ssDNA) is spontaneously assembled onto FOQDs by π–π stacking interaction, resulting in the luminescence quenching of FAM caused by FOQDs. The hybridization reaction between the probe ssDNA and its complementary target ssDNA results in the formation of a double-stranded DNA (ds-DNA) with helical structure, in which conformation the exposure of nucleobases to FOQDs is greatly reduced. As a consequence, the π–π stacking interaction between FAM–ssDNA and FOQDs is largely weakened and the distance between FAM and FOQDs is enlarged. Under this circumstance, the luminescence of FAM is expected to be recovered, which is linearly related to the concentration of target ssDNA and enables the quantification of target ssDNA.
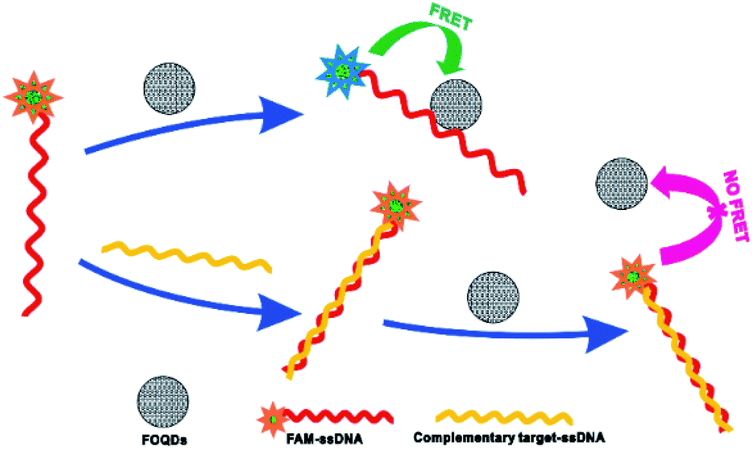 | ||
| Scheme 1 Schematic illustration of the DNA biosensor based on fluorescence quenching ability of FOQDs towards FAM–ssDNA through π–π stacking interaction between ssDNA and FOQDs. | ||
To realize the above design, the commercially available FOQDs with a diameter of 2 nm (Fig. 1A) were used to develop a label-free nanoplatform for DNA biosensing. The FT-IR spectra of FOQDs shown in Fig. 1B indicated the typical absorptions of fullerenols including an intense broad O–H band around 3400 cm−1 corresponding to –C–O–H, and three characteristic bands around 1080, 1376 and 1593 cm−1 assigned for C–O, C–O–H and C![[double bond, length as m-dash]](https://www.rsc.org/images/entities/char_e001.gif) C absorption, respectively.38,39 XPS results further confirmed that FOQDs had abundant hydroxyl groups. As shown in Fig. 1C, C 1s spectrum of FOQDs can be divided into three peaks. The C 1s binding energies observed for non-oxygenated carbon is centered at 284.7 eV and those for mono-oxygenated carbon and di-oxygenated carbon are centered at 286.6 and 288.3 eV, respectively.40 As depicted in EDS, a great deal of C elements and O elements were dispersed on the surface of FOQDs (Fig. 1d). The presence of Na elements may be ascribed to NaOH which was used to react with fullerene to synthesize FOQDs.41 It was clearly demonstrated that the surface of FOQDs was largely covered by hydroxyl groups which rendered a hydrophilic surface reducing the particle-to-particle interaction and, thus, stable colloidal suspension of FOQDS in aqueous solution was obtained.
C absorption, respectively.38,39 XPS results further confirmed that FOQDs had abundant hydroxyl groups. As shown in Fig. 1C, C 1s spectrum of FOQDs can be divided into three peaks. The C 1s binding energies observed for non-oxygenated carbon is centered at 284.7 eV and those for mono-oxygenated carbon and di-oxygenated carbon are centered at 286.6 and 288.3 eV, respectively.40 As depicted in EDS, a great deal of C elements and O elements were dispersed on the surface of FOQDs (Fig. 1d). The presence of Na elements may be ascribed to NaOH which was used to react with fullerene to synthesize FOQDs.41 It was clearly demonstrated that the surface of FOQDs was largely covered by hydroxyl groups which rendered a hydrophilic surface reducing the particle-to-particle interaction and, thus, stable colloidal suspension of FOQDS in aqueous solution was obtained.
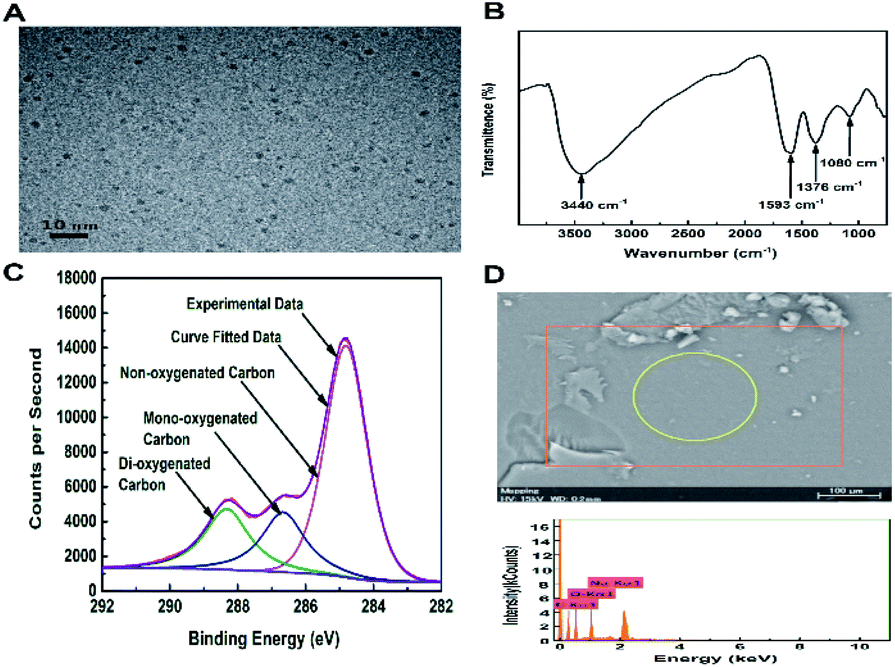 | ||
| Fig. 1 (A) TEM image of the FOQDs. (B) FT-IR spectrum of the FOQDs. (C) XPS spectra of the C 1s of the FOQDs. (D) EDS spectra of the FOQDs. | ||
Firstly, the concentration of FAM–ssDNA used in the assay was optimized. It was observed in Fig. S1A (ESI†) that with the increasing concentration of FAM–ssDNA, the fluorescence intensity also increased. Furthermore, at the concentration of 20 nM, FAM–ssDNA exhibited enough fluorescence to be utilized for construction of this biosensor. Although a higher concentration of FAM–ssDNA could increase the output fluorescence signal, the high concentration can also compromise the sensitivity of the biosensor. Therefore, 20 nM FAM–ssDNA was used in the following experiment. After incubating FAM–ssDNA with aqueous dispersion of FOQDs in Tris–HCl buffer (10 mM, 5 mM MgCl2, pH = 7.4), the FAM–ssDNA was absorbed onto the surface of FOQDs through π–π stacking interaction and the luminescence quenching phenomenon of FAM was observed (Fig. 2A). The absorption spectrum of the aqueous dispersion of FOQDs exhibited negligible absorption in the visible range (Fig. S1B, ESI†), suggesting that there was no spectra overlap between the luminescence emission spectra of FAM and the absorption spectra of FOQDs and thus no FRET occurred between FAM and FOQDs. As reported by Li et al., nano-C60 could effectively quench the luminescence of FAM through PET mechanism.18 In our present study, we may suggest that FOQDs, as polyhydroxylated nano-C60, can also quench the luminescence of FAM via PET mechanism. A control experiment showed that the luminescence quenching degree of fluorescein (without attached ssDNA) caused by FOQDs was almost negligible compared with that of FAM–ssDNA (Fig. 2B), indicating the occurrence of assembling of ssDNA chains onto FOQDs through π–π stacking interaction which brought FAM and FOQDs in short range. On the other hand, as the zeta potential of the FOQDs in our present study was measured to be −25 mV, the electrostatic interaction between the negatively charged DNA chains and FOQDs can also be excluded. In the FAM–FOQDs PET pair, the fluorescence quenching degree was dependent on the concentration of FOQDs and the quenching degree up to 87% was achieved in the presence of 0.050 mg mL−1 FOQDs. Besides, the time dependence of the quenching process showed that the interaction between the ssDNA with the FOQDs reached equilibrium in only a few minutes (Fig. S2, ESI†).
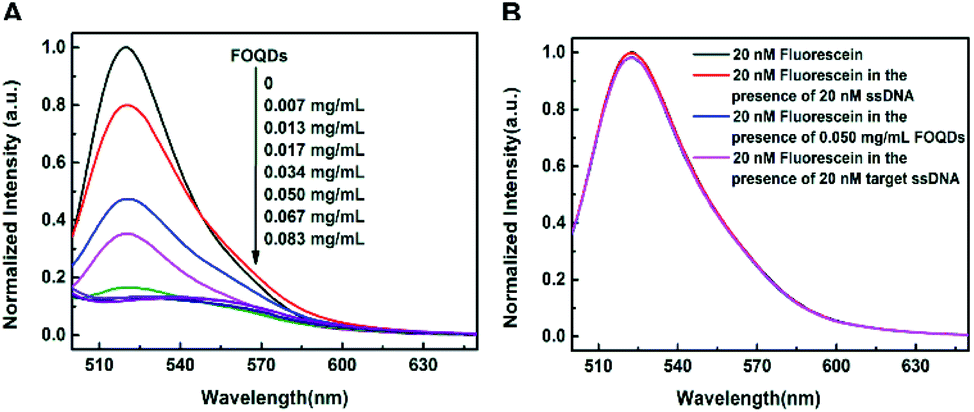 | ||
| Fig. 2 (A) Luminescence quenching of FAM–ssDNA (20 nM) in the presence of various concentrations of FOQDs (0, 0.007, 0.013, 0.017 mg mL−1, 0.034 mg mL−1, 0.050 mg mL−1, 0.067 mg mL−1, 0.083 mg mL−1). (B) Luminescence spectra of fluorescein (20 nM) in the absence and presence of 0.050 mg mL−1 FOQDs, 20 nM ssDNA, 20 nM target ssDNA, respectively. All experiments were per-formed in Tris–HCl buffer (10 mM, 5 mM MgCl2, pH = 7.4) under excitation at 480 nm. | ||
We then investigated the performance of this FAM–DNA–FOQDs PET system for homogeneous DNA sensing. Before the introduction of FOQDs into the solution of FAM–ssDNA, different concentrations of complementary target ssDNA were added first to form double helix structure by hybridization. The recovery time and temperature were optimized for better assay performance. The time dependence of the recovery process showed that the maximum recovery was observed at 60 min (Fig. S3A, ESI†). And the temperature for maximum recovery was obtained at 25 °C (Fig. S3B, ESI†). As expected, the fluorescence of FAM was restored in a complementary target ssDNA-concentration dependent manner, which was shown in Fig. 3A. It was explained that the formation of dsDNA with double-helical structure decreased the exposure of nucleic acid bases of ssDNA to FOQDs and thus weakened the π–π stacking interaction between ssDNA and FOQDs. In this way, the distance between FAM–ssDNA and FOQDs was enlarged to block the PET from FAM to FOQDs and the fluorescence recovery of FAM was observed. The relative fluorescence intensity ((F − F0)/F0, where F and F0 represent the emission intensity in the presence and absence of complementary target ssDNA, respectively) was linearly related to complementary target ssDNA concentration in the range from 0.05 nmol L−1 to 20 nmol L−1, with the detection limit of 15 pM (calculated as the concentration corresponding to three times of the standard deviation of the background signal from seven independent measurements) (Fig. 3B). Compared with DNA biosensing platform using other carbon nanostructures, such as graphene oxide (100 pM)42 and nano-C60 (25 pM),25 the sensitivity of the present sensor is significantly improved. Besides such an impressive sensitivity, the biosensing platform also offered pronounced specificity, that is, unambiguous discrimination between different sequences. As illustrated in Fig. S4 (ESI),† the biosensor showed distinctly differed response towards the single-base mismatched target ssDNA and double-base mismatched target ssDNA under identical assay conditions, which caused negligible alteration of the FAM emission as compared to complementary target ssDNA.
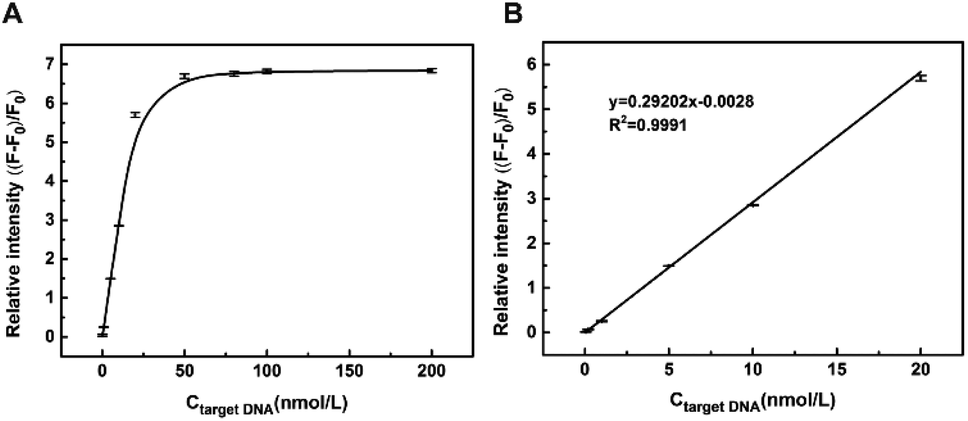 | ||
| Fig. 3 (A) The fluorescence recovery trend line in accordance with different concentrations of target ssDNA (0.05, 0.2, 1, 5, 10, 20, 50, 80, 100, 200 nM). F0 represents the fluorescence intensity in the absence of target ssDNA. (B) The linear relationship between the fluorescence recovery (at 520 nm) and the concentration of target ssDNA within the range from 0.05–20 nM, data were presented as average ±SD from three independent measurements. Experiments were conducted in the presence of 20 nM FAM–ssDNA and 0.05 mg mL−1 FOQDs in Tris–HCl buffer (10 mM, 5 mM MgCl2, pH 7.4) under excitation at 480 nm. | ||
In order to validate the universality of the biosensing platform, we then used aptamer as the probe43–45 and constructed another biosensor for OTA detection (Fig. S5, ESI†). As indicated in Fig. S6 (ESI),† the output fluorescence intensity of TAMRA–OTA aptamer with a concentration of 40 nM was enough to develop the OTA biosensor. Similar to the ssDNA probe, the OTA aptamer was assembled onto the surface of FOQDs due to the π–π stacking interaction, resulting in the fluorescence quenching of TAMRA-labelled OTA aptamer (Fig. S7, ESI†). The introduction of OTA into the TAMRA–OTA aptamer-FOQDs PET system, which specifically bound with OTA aptamer accompanied by its conformational change, led to the detachment of TAMRA-labelled OTA aptamer from the FOQDs. The recovery time and temperature were also optimized for better assay performance for OTA detection. The time dependence of the recovery process showed that the maximum recovery was observed at 60 min (Fig. S8A, ESI†). And the temperature for maximum recovery was obtained at 25 °C (Fig. S8B, ESI†). And the restoration of the fluorescence intensity of TAMRA was observed (Fig. 4A). The relative fluorescence intensity at 580 nm was linearly related to OTA concentration within the range from 0.01 to 1 ng mL−1 (Fig. 4B), with a detection limit of 3 pg mL−1. The specificity of this fluorescent OTA aptasensor was also examined. As illustrated in Fig. S9 in the ESI,† it clearly showed that other mycotoxins including AFB1, FB1, ZEN, DON in the concentration of 10 ng mL−1 caused negligible response compared with 1 ng mL−1 OTA under the same experimental procedures by this OTA biosensor, which indicates that our present aptasensor exhibits excellent selectivity towards OTA. To prove the applicability of this OTA biosensor in practical samples, this biosensor was used to detect OTA in grape juice samples. In this paper, OTA detection was also realized in 100-fold diluted grape juice sample with Tris–HCl buffer under the same experimental procedures as that in the aqueous buffer solution. It can be seen from Fig. S10† that the degree of fluorescence restoration of TAMRA was linear related to the concentration of OTA in the range from 0.02 to 1 ng mL−1, with a detection limit of 5 pg mL−1. Standard addition experiments were conducted to examine the feasibility of this OTA biosensor in practical OTA-free grape juice samples. The satisfactory recoveries from 94% to 110% and the relative standard deviations (RSDs) were within 1.3–4.2 in Table S1† convincingly demonstrates that this biosensor based on the luminescence quenching ability of FOQDs towards TAMRA has great potential in practical application. To evaluate the reproducibility of the OTA biosensor, five standard samples containing different concentrations of OTA (0.03, 0.05, 0.08, 0.2, 0.6 ng mL−1) were prepared by spiking standard OTA into the OTA-free grape juice samples. As shown in Table S2,† the intra-day and inter-day RSD were less than 4.1% and 4.5% (n = 11), suggesting that this OTA biosensor had a good reproducibility. Liu et al. have developed a OTA fluorescence biosensor based on fluorescence energy transfer (FRET) between a cationic conjugated fluorescent polymer and FAM with a detection limit of 0.11 ng mL−1.46 It has also been reported that OTA detection was realized based on FRET between quantum dots and MoS2 nanosheets with a limit of detection of 1.0 ng mL−1.47 Compared to the previously reported OTA aptamer-based biosensors, the sensitivity of the present biosensor is greatly improved, which shows great potential to detect lower concentration of OTA in practical samples.
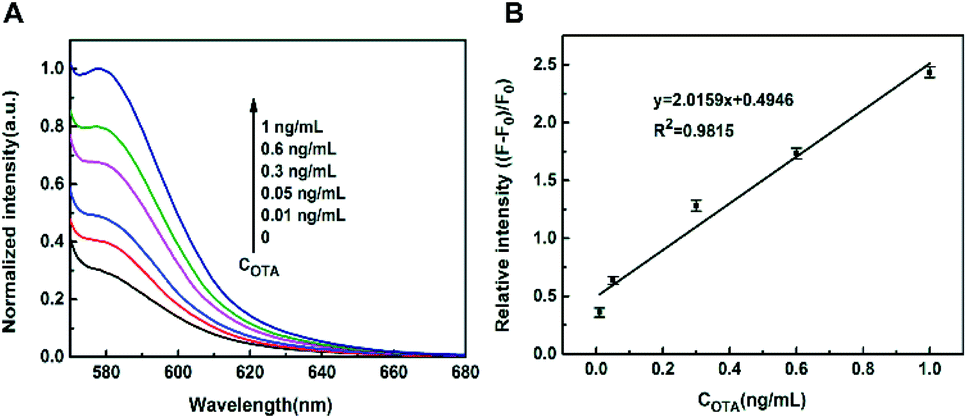 | ||
| Fig. 4 (A) The fluorescence recovery spectra with the addition of increasing concentration of OTA (0, 0.01 ng mL−1, 0.05 ng mL−1, 0.3 ng mL−1, 0.6 ng mL−1, 1 ng mL−1). (B) The linear relationship between the fluorescence recovery (at 580 nm) and the concentration of OTA within the range from 0.01–1 ng mL−1, data were presented as average ± SD from three independent measurements. Experiments were conducted in the presence of 40 nM TAMRA–OTA aptamer and 6.7 μg mL−1 FOQDs in Tris–HCl buffer (10 mM, 5 mM KCl, 5 mM CaCl2, pH 8.5) under excitation at 550 nm. | ||
In conclusion, ultrasensitive biosensing platform based on the luminescence quenching ability of zero-dimensional FOQDs was established for the first time. The fluorescence of FAM and TAMRA can both be effectively quenched under the π–π stacking interaction between ssDNA/aptamer and FOQDs which shorten the distance between fluorescent dyes and FOQDs. And then ultrasensitive detection of biomolecule DNA and small molecule OTA was realized. This work demonstrates that FOQDs can be used as prospective fluorescence quenchers and has extensive applied prospect in bioanalysis in the future.
Conflicts of interest
The authors declare that they have no conflict of interest.Acknowledgements
The authors acknowledge the financial support from the National Natural Science Foundation of China (31801665), the Basic Scientific Research Operating Expenses of Oil Crops Research Institute, Chinese Academy of Agricultural Sciences (1610172018004), and the Agricultural Science and Technology Innovation Program of Chinese Academy of Agricultural Sciences (CAAS-XTCX201902).Notes and references
- N. I. Khan, M. Mousazadehkasin, S. Ghosh, J. G. Tsavalas and E. Song, Analyst, 2020, 145, 4494–4503 RSC.
- E. Morales-Narváez and A. Merkoçi, Adv. Mater., 2019, 31, 1805043–1805054 Search PubMed.
- S. Y. Wang, C. F. Wang, Y. K. Lv and S. G. Shen, TrAC, Trends Anal. Chem., 2018, 106, 53–61 CrossRef.
- P. Solís-Fernández, M. Bissetee and H. Ago, Chem. Soc. Rev., 2017, 46, 4572–4613 RSC.
- V. Georgakilas, J. N. Tiwari, K. C. Kemp, J. A. Perman, A. B. Bourlinos, K. S. Kim and R. Zboril, Chem. Rev., 2016, 116, 5464–5519 CrossRef CAS PubMed.
- V. Schroeder, S. Savagatrup, M. He, S. Lin and T. M. Swager, Chem. Rev., 2019, 119, 599–663 CrossRef CAS PubMed.
- W. Y. He, J. Y. Dai, T. T. Li, Y. K. Bao, F. C. Yang, X. Zhang and H. Uyama, Anal. Chem., 2018, 90, 12810–12814 CrossRef CAS PubMed.
- C. Farrera, F. T. Andón and N. Feliu, ACS Nano, 2017, 11, 10637–10643 CrossRef CAS.
- J. Pan, F. Li and J. H. Choi, J. Mater. Chem. B, 2017, 5, 6511–6522 RSC.
- A. Kathiravan, A. Gowri, V. Srinivasan, T. A. Smith, M. Ashokkumar and M. A. Jhonsi, Analyst, 2020, 145, 4532–4539 RSC.
- Y. Chen, Y. Cao, C. Ma and J. J. Zhu, Mater. Chem. Front., 2020, 4, 369–385 RSC.
- T. S. Atabaev, Nanomaterials, 2018, 8, 342–351 CrossRef.
- J. Chen, J. S. Wei, P. Zhang, X. Q. Niu, W. Zhao, Z. Y. Zhu, H. Ding and H. M. Xiong, ACS Appl. Mater. Interfaces, 2017, 9, 18429–18433 CrossRef CAS.
- F. Huo, W. Li, Y. Liu, X. Liu, C.-Y. Lee and W. Zhang, J. Mater. Sci., 2021, 56, 2814–2837 CrossRef CAS.
- P. Li, C. Wu, Y. Xu, D. Cheng, Q. Lu, J. Gao, W. Yang, X. Zhu, M. Liu, H. Li, P. Yin and Y. Zhang, TrAC, Trends Anal. Chem., 2020, 131, 116007–116023 CrossRef CAS.
- C. Ji, Y. Zhou, R. M. Leblanc and Z. Peng, ACS Sens., 2020, 5, 2724–2741 CrossRef CAS.
- Y. Xu, P. Li, D. Cheng, C. Wu, Q. Lu, W. Yang, X. Zhu, P. Yin, M. Liu, H. Li and Y. Zhang, J. Mater. Chem. A, 2020, 8, 10290–10308 CAS.
- J. Wen, Y. Xu, H. Li, A. Lu and S. Sun, Chem. Commun., 2015, 51, 11346–11358 RSC.
- F. Tian, J. Lyu, J. Shi and M. Yang, Biosens. Bioelectron., 2017, 89, 123–135 CrossRef CAS.
- P. M. Neema, A. M. Tomy and J. Cyriac, Trends Anal. Chem., 2020, 124, 115797–115806 CrossRef CAS.
- K. Furukawa, Y. Ueno, M. Takamura and H. Hibino, ACS Sens., 2016, 1, 710–716 CrossRef CAS.
- W. Yun, W. Xiong, H. Wu, M. Fu, Y. Huang, X. Liu and L. Yang, Sens. Actuators, B, 2017, 249, 493–498 CrossRef CAS.
- Q. G. Liao, B. H. Wei and L. G. Luo, Microchim. Acta, 2017, 184, 627–632 CrossRef CAS.
- J. D. Harvey, H. A. Baker, M. V. Ortiz, A. Kentsis and D. A. Heller, ACS Sens., 2019, 4, 1236–1244 CrossRef CAS PubMed.
- H. Li, Y. Zhang, Y. Luo and X. Sun, Small, 2011, 7, 1562–1568 CrossRef CAS.
- H. Li, J. Zhai and X. Sun, Analyst, 2011, 136, 2040–2043 RSC.
- H. Li, J. Zhai and X. Sun, Nanoscale, 2011, 3, 2155–2157 RSC.
- K. N. Semenov, N. A. Charykov, V. N. Postnov, V. V. Sharoyko, I. V. Vorotyntsev, M. M. Galagudza and I. V. Murin, Prog. Solid State Chem., 2016, 44, 59–74 CrossRef CAS.
- V. V. Sharoyko, S. V. Ageev, A. A. Meshcheriakov, A. V. Akentiev, B. A. Noskov, I. T. Rakipov, N. A. Charykov, N. A. Kulenova, B. K. Shaimardanova, N. E. Podolsky and K. N. Semenov, J. Mol. Liq., 2020, 311, 113360–113369 CrossRef CAS.
- A. V. Akentiev, S. B. Gorniaia, N. A. Isakov, V. T. Lebedev, O. Y. Milyaeva, V. P. Sedov, K. N. Semenov, K. A. Timoshen and B. A. Noskov, J. Mol. Liq., 2020, 306, 112904–112910 CrossRef CAS.
- F. Liu, F. Xiong, Y. Fan, J. Li, H. Wang, G. Xing, F. Yan, F. Tai and R. He, J. Nanopart. Res., 2016, 18, 338–350 CrossRef.
- D. Iohara, Y. Umezaki, M. Anraku, K. Uekama and F. Hirayama, J. Pharm. Sci., 2016, 105, 2959–2965 CrossRef CAS.
- Y. Zhou, M. M. Zhen, H. J. Ma, J. Li, C. Y. Shu and C. R. Wang, Nanomed. Nanotechnol., 2018, 14, 1361–1369 CrossRef CAS PubMed.
- M. J. Akhtar, M. Ahamed, H. A. Alhadlaq and A. Alshamsan, Biochim. Biophys. Acta, 2017, 1861, 802–813 CrossRef CAS.
- J. L. Tang, R. R. Zhang, M. Y. Guo, L. H. Shao, Y. Liu, Y. L. Zhao, S. J. Zhang, Y. Wu and C. Y. Chen, Biomaterials, 2018, 167, 205–215 CrossRef CAS.
- N. Thotakura, G. Sharma, B. Singh, V. Kumar and K. Raza, Artif. Cells, Nanomed., Biotechnol., 2018, 46, 1763–1772 CAS.
- L. Y. Yang, S. Y. Hua, Z. Q. Zhou, G. C. Wang, F. L. Jiang and Y. Liu, Colloids Surf., B, 2017, 157, 261–267 CrossRef CAS.
- M. Y. Eropkin, E. Y. Melenevskaya, K. V. Nasonova, T. S. Bryazzhi-kova, E. M. Eropkina, D. M. Danilenko and O. I. Kiselev, Pharm. Chem. J., 2013, 47, 87–91 CrossRef CAS.
- M. V. Velarde-Salcedo, M. Gallo and R. A. Guirado-López, J. Phys. Chem. C, 2018, 122, 13117–13129 CrossRef CAS.
- P. A. Indeglia, V. B. Krishna, A. Georgieva and J. J. Bonzongo, J. Nanopart. Res., 2013, 15, 2069–2084 CrossRef.
- J. Li, A. Takeuchi, M. Ozawa, X. Li, K. Saigo and K. Kitazawa, J. Chem. Soc., Chem. Commun., 1993, 1784–1785 RSC.
- S. He, B. Song, D. Li, C. Zhu, W. Qi, Y. Wen, L. Wang, S. Song, H. Fang and C. Fan, Adv. Funct. Mater., 2010, 20, 453–459 CrossRef CAS.
- Y. Lei, J. Tang, H. Shi, X. Ye, X. He, F. Xu, L. Yan, Z. Qiao and K. Wang, Anal. Chem., 2016, 88, 11699–11706 CrossRef CAS.
- H. Shi, Y. Lei, J. Ge, X. He, W. Cui, X. Ye, J. Liu and K. Wang, Anal. Chem., 2019, 91, 9154–9160 CrossRef CAS.
- Y. Lei, X. He, J. Tang, H. Shi, D. He, L. Yan, J. Liu, Y. Zeng and K. Wang, Chem. Commun., 2018, 54, 10288–10291 RSC.
- Y. Liu, H. Yan, J. Shangguan, X. Yang, M. Wang and W. Liu, Microchim. Acta, 2018, 185, 427–432 CrossRef PubMed.
- Z. Lu, X. Chen and W. Hu, Sens. Actuators, B, 2017, 246, 61–67 CrossRef CAS.
Footnote |
| † Electronic supplementary information (ESI) available. See DOI: 10.1039/d1ra01680f |
| This journal is © The Royal Society of Chemistry 2021 |