 Open Access Article
RAFT polymerization mediated core–shell supramolecular assembly of PEGMA-co-stearic acid block co-polymer for efficient anticancer drug delivery†
Priyatosh Sarkar a,
Santanu Ghosh
 ab,
Rima Sahaa and
Kishor Sarkar
 *a
*a
aGene Therapy and Tissue Engineering Lab, Department of Polymer Science and Technology, University of Calcutta, 92, A. P. C. Road, Kolkata, 700009, India. E-mail: kishorpst@gmail.com; kspoly@caluniv.ac.in; Web: http://kishorgttl.com Tel: +91-33-2350-1397 ext. 285
bDepartment of Materials Engineering, Indian Institute of Science, C. V. Raman Avenue, Bangalore, Karnataka 560012, India
First published on 7th May 2021
Abstract
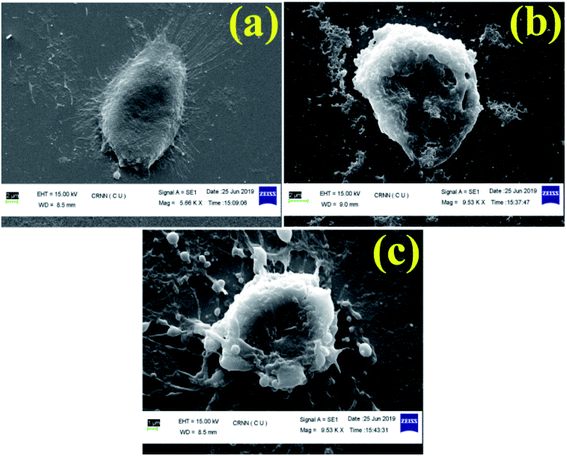
In this work, core–shell supramolecular assembly polymeric nano-architectures containing hydrophilic and hydrophobic segments were synthesized via reversible addition fragmentation chain transfer (RAFT) polymerization. Herein, polyethylene glycol methyl ether methacrylate (PEGMA), and stearic acid were used to synthesize the poly(PEGMA) homopolymer and stearyl ethyl methacrylate (SEMA), respectively. Then, PEGMA and SEMA were polymerized through controlled RAFT polymerization to obtain the final diblock copolymer, poly(PEGMA-co-SEMA) (BCP). Model anticancer drug, doxorubicin (DOX) was loaded on BCPs. Interestingly, efficient DOX release was observed at acidic pH, similar to the cancerous environment pH level. Significant cellular uptake of DOX loaded BCP50 (BCP50-DOX) was observed in MDA-MB-231 triple negative breast cancer cells and resulted in a 35 fold increase in anticancer activity against MDA MB-231 cells compared to free DOX. Scanning electron microscopy (SEM) imaging confirmed the apoptosis mediated cellular death. These core–shell supramolecular assembly polymeric nano-architectures may be an efficient anti-cancer drug delivery system in the future.
Introduction
Smart polymeric architectures have opened a new era in the field of biomedical science. Among numerous smart polymeric architectures, the core–shell models have drawn immense research attention, owing to their ability to form self-assembly or micellar structure, for over a decade.1,2 These smart molecular structures are typically composed of an inner hydrophobic core and an outer hydrophilic shell. Block copolymers have already demonstrated their efficiency to develop such core–shell structures.3,4 The amalgamation of different monomeric functionalities in one polymer chain leads to successive phase separation along with supramolecular structure formation which can be achieved by various “living” radical polymerization techniques like reversible addition–fragmentation chain transfer (RAFT), nitroxide mediated polymerization (NMP), and atom transfer radical polymerization (ATRP).5 Among them, RAFT polymerization is the most versatile polymerization technique in terms of monomer versatility as well as a chain transfer agent (CTA) attributed to narrow polydispersity index and controlled molecular weight.6Amphiphilic polymers are generally described as polymers having both hydrophilic and hydrophobic moieties. In an aqueous environment, they can easily form micellar architecture where the outer shell contains hydrophilic moiety and inner core is composed of hydrophobic moiety capable of loading hydrophobic drugs leading to improve the biodistribution and bioavailability of hydrophobic drugs.7–9 Unlike covalent interactions, the hydrophobic drugs like curcumin, doxorubicin, paclitaxel etc. could be easily entrapped inside the hydrophobic core via hydrophobic interaction.9,10
Nanotechnology has already shown its effectivity in the field of anticancer drug or gene delivery through active or passive targeting.9,11–16 Unlike active targeting, passive targeting of cancer cells through the faulty vasculature is termed as “enhanced permeation and retention rate” (EPR) where nano-objects are designed to get access to the tumor site through leaky vasculature and accumulate to the tumor, subsequently, nanoparticles enter to the cancer cells via endocytosis and release their drug or gene payload.17,18 Nanoparticles are prone to the process of opsonization by the mono-phagocytic system, whereas, core–shell nanoparticles with an outer hydrophilic shell can easily escape the opsonization process or recognition by “reticuloendothelial system” (RES).19 Therefore, the incorporation of hydrophilic moiety increases the efficiency of drug delivery to the tumor site by prolonging mean residence time (MRT) to the systemic circulation,20 where, a larger extent of nanoparticle bearing drug molecules can accumulate to the tumor site with weakened lymphatic drainage, whereas permeability to the normal vasculature is restricted due to the tight endothelial junction.21
Moreover, the incorporation of fatty acid to a polymeric backbone may lead to an optimal molecular nanostructure for drug delivery application as fatty acids which are saturated or unsaturated long-chain alkyl carboxylic acids, act as a building block of tissue and are also involved in various biological signalling pathways. Stearic acid is one of the long-chain fatty acids having 18 carbon and a terminal carboxylic functional group which could be easily conjugated with various biopolymers for diverse biological applications. Like, Yuan et al.22 prepared stearic acid conjugated chitosan micelle for DOX delivery and evaluated the in vitro transport as well as in vivo absorption using the Caco-2 cell line. They have found that with the increased stearic acid substitution to the amino group of chitosan greatly influenced the permeability as well as absorption through the gastrointestinal tract. In another study, Hu et al.23 also prepared a shell crosslinked micellar structure by conjugating chitosan with stearic acid and found that the stearic acid hydrophobic core greatly influenced the cellular internalization process. Thus, stearic acid modification of polymer helps to improve the entrapment of the hydrophobic drug by hydrophobic interaction and also influences the release from the inner core.10 It is believed that physical entrapment of drugs is more favourable than chemical conjugation because a stable covalent bond causes steric hindrance and restrict the enzymatic degradation.24,25
The surface engineering of the core–shell model nanoparticle is generally employed to improve the aqueous solubility, stability, to prevent intermolecular aggregation, immunogenicity reduction, and to increase the residence time in the systemic circulation to improve the bioavailability of the hydrophobic drugs.26 PEG is FDA approved synthetic polymer which is mostly used for hydrophilic modification of the nanoparticles to prevent the RES trapping in the liver and spleen.20,27–29 For instance, Sun et al. prepared a core–shell model nanoparticle to understand the effect of PEGylation and observed that biodistribution of PEGylated nanoparticles was higher with long circulation time into the systemic circulation.30
An optimal nano-drug delivery system includes well dispersibility, high drug payload, adequate biocompatibility, which could be achieved by the amalgamation of lipid and hydrophilic polymer to overcome the shortcomings associated with only lipid or polymer-based nanoparticles. Therefore in this study, we adopted RAFT polymerization to prepare poly(poly(ethylene glycol) methyl ether methacrylate-co-stearyl ethyl methacrylate) (poly(PEGMA-co-SEMA)) block copolymer having controlled molecular weight, which could able to form core–shell structure in the aqueous environment. Anticancer drug DOX was loaded to the hydrophobic SEMA core by physical entrapment. The effect of increased hydrophobic SEMA part in the block copolymer system on DOX loading was evaluated along with the evaluation of their corresponding biocompatibility, cellular uptake study and in vitro anticancer activity against MDA-MB 231 as a model cancer cell line.
Materials & methods
Sodium hydride, 1-dodecanethiol, 4,4-azobis(4-cyanovaleric acid), deuterated chloroform (CDCl3), 2-hydroxy ethyl methacrylate (HEMA), polyethylene glycol methyl ether methacrylate −300 (PEGMA), pyrene, and MTT were purchased from Sigma Aldrich (Germany) and were used without further purification. Stearic acid, DMEM media, and molecular biology grade water, fetal bovine serum (Brazil origin, EU approved), and trypsin-EDTA were purchased from Himedia laboratories private limited (Mumbai, India). Doxorubicin HCl was purchased from Tokyo Chemical Industry, (Japan). Dicyclohexylcarbodimide (DCC), 4-dimethylaminopyridine (DMAP) were purchased from SRL chemicals (Mumbai, India). 2,20-Azo-bis-(isobutyronitrile) (AIBN) were purchased from SRL and were recrystallized from methanol before use. Fluorescent probes pyrene and DAPI were purchased from Sigma Aldrich (Germany). All the solvents were used as purchased without any further purification.Synthesis of chain transfer agent (CTA)
The CTA, 4-cyano-4-(dodecylsulphanylthiocarbonyl) sulphanyl pentanoic acid (CDSP) and was prepared according to Saha et al.31 In brief, sodium hydride (NaH, 0.62 g, 25.8 mmol) was dissolved in diethyl ether (50 ml) into a three-neck jacketed reactor under nitrogen condition at 5–10 °C, 1-dodecanethiol (5 g, 24.7 mmol) was added slowly to that solution to obtain sodium dodecylate as thick white slurry and the temperature was cooled down to 0 °C. After that carbon disulphide (CS2, 1.9 g, 24.9 mmol) was added dropwise to the reaction mixture which leads to the formation of sodium S-dodecyl trithiocarbonate. The resulted yellowish product was filtered and dried under a vacuum oven at room temperature for further reaction. In the next step, solid iodine granules (2.54 g, 10 mmol) were added to diethyl ether solution (40 ml) of sodium S-dodecyl trithiocarbonate (5.96 g, 19.8 mmol) in a portion-wise manner under continuous stirring and allowed to stirr for a further 1 hour at room temperature. Sodium iodide as a by-product was filtered off; subsequently, the yellowish solution was collected and washed by sodium thiosulfate followed by anhydrous sodium sulphate. The collected filtrate solution was concentrated using a rotary evaporator (Heidolph, Germany) to obtain bis(dodecylsulfanylthiocarbonyl) disulphide. Then the dried bis(dodecylsulfanylthiocarbonyl) disulphide (3 g, 5.4 mmol) was refluxed using ethyl acetate (55 ml) in presence of 4,4-azobis(4-cyanovaleric acid) in ethyl acetate for 18 hours. Subsequently, the crude CDSP was extracted with water and recrystallized from cold hexane (yield = 83%). The structural characterization of purified CDSP was confirmed by 1H NMR.Synthesis of stearyl ethyl methacrylate (SEMA)
SEMA was synthesized according to Maiti et al.32 Briefly, in a two-neck round bottom flask, stearic acid (SA) was dissolved into dry dichloromethane (DCM). Nitrogen was purged into the reaction mixture while the flask was kept in an ice bath. DCC was separately dissolved into dry DCM and added to the reaction mixture. After 30 min DMAP was added followed by dropwise addition of HEMA for 15 min. The ice bath was removed after 30 min and the reaction was allowed to stir under a nitrogen environment for 24 hours. After 24 hours, the formed dicyclohexyl urea (DCU) was removed by filtration. The obtained clear organic solution was separated by several times washing with saturated NaHCO3 solution (3 × 100 ml) followed by washing with brine solution (3 × 100 ml). The washed organic solution was dried over sodium sulphate and DCM was removed under reduced pressure by a rotary evaporator. Finally, the product was purified using silica gel (230–400 mesh size) flash column chromatography using ethyl acetate![[thin space (1/6-em)]](https://www.rsc.org/images/entities/char_2009.gif) :
:![[thin space (1/6-em)]](https://www.rsc.org/images/entities/char_2009.gif) hexane.
hexane.
RAFT polymerization
![[thin space (1/6-em)]](https://www.rsc.org/images/entities/char_2009.gif) :
:![[thin space (1/6-em)]](https://www.rsc.org/images/entities/char_2009.gif) poly(PEGMA)) 10
poly(PEGMA)) 10![[thin space (1/6-em)]](https://www.rsc.org/images/entities/char_2009.gif) :
:![[thin space (1/6-em)]](https://www.rsc.org/images/entities/char_2009.gif) 1 (BCP10), 25
1 (BCP10), 25![[thin space (1/6-em)]](https://www.rsc.org/images/entities/char_2009.gif) :
:![[thin space (1/6-em)]](https://www.rsc.org/images/entities/char_2009.gif) 1 (BCP25) and 50
1 (BCP25) and 50![[thin space (1/6-em)]](https://www.rsc.org/images/entities/char_2009.gif) :
:![[thin space (1/6-em)]](https://www.rsc.org/images/entities/char_2009.gif) 1 (BCP50).
1 (BCP50).Preparation of doxorubicin (DOX) loaded BCP micelles
DOX was loaded into the core of the nanoparticle by physical entrapment via film hydration method according to Wei et al.33 with minor modification. Briefly, hydrophobic DOX was obtained by neutralizing DOX. HCl using trimethylamine (1![[thin space (1/6-em)]](https://www.rsc.org/images/entities/char_2009.gif) :
:![[thin space (1/6-em)]](https://www.rsc.org/images/entities/char_2009.gif) 3 mole ratio) in 1 ml of a mixed solvent of chloroform
3 mole ratio) in 1 ml of a mixed solvent of chloroform![[thin space (1/6-em)]](https://www.rsc.org/images/entities/char_2009.gif) :
:![[thin space (1/6-em)]](https://www.rsc.org/images/entities/char_2009.gif) methanol (3
methanol (3![[thin space (1/6-em)]](https://www.rsc.org/images/entities/char_2009.gif) :
:![[thin space (1/6-em)]](https://www.rsc.org/images/entities/char_2009.gif) 2). Then the resulting solution was mixed with the different mass ratios of BCPs (BCP
2). Then the resulting solution was mixed with the different mass ratios of BCPs (BCP![[thin space (1/6-em)]](https://www.rsc.org/images/entities/char_2009.gif) :
:![[thin space (1/6-em)]](https://www.rsc.org/images/entities/char_2009.gif) DOX = 1
DOX = 1![[thin space (1/6-em)]](https://www.rsc.org/images/entities/char_2009.gif) :
:![[thin space (1/6-em)]](https://www.rsc.org/images/entities/char_2009.gif) 0.1, 1
0.1, 1![[thin space (1/6-em)]](https://www.rsc.org/images/entities/char_2009.gif) :
:![[thin space (1/6-em)]](https://www.rsc.org/images/entities/char_2009.gif) 0.5, 1
0.5, 1![[thin space (1/6-em)]](https://www.rsc.org/images/entities/char_2009.gif) :
:![[thin space (1/6-em)]](https://www.rsc.org/images/entities/char_2009.gif) 1) followed by evaporation using a rotary vacuum evaporator to obtain a thin film on the surface of the round bottom flask. Then, the dried film was hydrated using a 10 mM HEPES buffer and stirred at 60 °C for 30 min. The DOX encapsulated BCPs were then dialyzed (dialysis tube molecular cutoff 3.5 kDa) against DD water for 9 hours in dark conditions to remove the unentrapped DOX with a continuous exchange of fresh DD water after every hour. The obtained product was then lyophilized and stored at 4 °C for further investigation. The encapsulated DOX content was quantified by UV-Vis spectroscopy and DOX encapsulated BCPs were screened according to the highest drug loading (%) and encapsulation efficiency which was calculated from the following formula.
1) followed by evaporation using a rotary vacuum evaporator to obtain a thin film on the surface of the round bottom flask. Then, the dried film was hydrated using a 10 mM HEPES buffer and stirred at 60 °C for 30 min. The DOX encapsulated BCPs were then dialyzed (dialysis tube molecular cutoff 3.5 kDa) against DD water for 9 hours in dark conditions to remove the unentrapped DOX with a continuous exchange of fresh DD water after every hour. The obtained product was then lyophilized and stored at 4 °C for further investigation. The encapsulated DOX content was quantified by UV-Vis spectroscopy and DOX encapsulated BCPs were screened according to the highest drug loading (%) and encapsulation efficiency which was calculated from the following formula.Mt = mass of DOX encapsulated into the BCP, Ms = mass of the DOX loaded BCP after lyophilization, M0 = initial mass of DOX feed.
In vitro DOX release study
An in vitro drug release study was conducted to evaluate the release pattern of DOX from the core of the nanoparticles at different pH (5 and 7.4) environments. DOX release pattern was observed using a dialysis membrane tube (10 kDa) at 37 °C in a dynamic environment.34 Briefly, DOX loaded BCP50 (contains 280 μg of DOX) was dispersed into freshly prepared phosphate buffer saline (PBS) of different pH and placed into a dialysis tube. Then, the dialysis tube was immersed into 15 ml PBS with continuous stirring at low rpm. To maintain sink condition, 2 ml of PBS buffer was withdrawn from the external chamber after a predetermined time interval (0, 0.5, 1, 2, 4, 6, 8, 10, 12, 24, 48, 72, 96, 120 h) and replaced with fresh PBS. The absorbance was measured at 481 nm using a UV-Vis spectrophotometer. From the obtained absorbance% cumulative DOX release was calculated. All the experiments were performed in triplicate with ±SD. Different release kinetics models such as zero order, first order, Hixon–Crowell, Korsmeyer–Peppas and Higuchi model was also employed to evaluate the DOX release mechanism from the nanoparticle.35where OD570(Sample) and OD570(Control) refers to the absorbance of sample and control at 570 nm.
Result and discussion
Synthesis and characterizations of the monomer and polymers
1H NMR, 500 mHz, CDCl3, δ(ppm): COOH–CH2–CH2–C(CN)(CH3)–S–(C![[double bond, length as m-dash]](https://www.rsc.org/images/entities/char_e001.gif) S)–S–C11H23–CH3-0.882(3H); COOH–CH2–CH2–C(CN)(CH3)–S–(C
S)–S–C11H23–CH3-0.882(3H); COOH–CH2–CH2–C(CN)(CH3)–S–(C![[double bond, length as m-dash]](https://www.rsc.org/images/entities/char_e001.gif) S)–S–CH2–CH2C9H18–CH3-1.24(18H), COOH–CH2–CH2–C(CN)(CH3)–S–(C
S)–S–CH2–CH2C9H18–CH3-1.24(18H), COOH–CH2–CH2–C(CN)(CH3)–S–(C![[double bond, length as m-dash]](https://www.rsc.org/images/entities/char_e001.gif) S)–S–CH2–CH2C9H18–CH3-1.7(2H); COOH–CH2–CH2–C(CN)(CH3)–S(C
S)–S–CH2–CH2C9H18–CH3-1.7(2H); COOH–CH2–CH2–C(CN)(CH3)–S(C![[double bond, length as m-dash]](https://www.rsc.org/images/entities/char_e001.gif) S)–S–CH2–CH2C9H18–CH3-1.87(3H); COOH–CH2–CH2–C(CN)(CH3)–S–(C
S)–S–CH2–CH2C9H18–CH3-1.87(3H); COOH–CH2–CH2–C(CN)(CH3)–S–(C![[double bond, length as m-dash]](https://www.rsc.org/images/entities/char_e001.gif) S)–S–CH2–CH2C9H18–CH3-2.64–2.7(4H); COOH–CH2–CH2–C(CN)(CH3)–S–(C
S)–S–CH2–CH2C9H18–CH3-2.64–2.7(4H); COOH–CH2–CH2–C(CN)(CH3)–S–(C![[double bond, length as m-dash]](https://www.rsc.org/images/entities/char_e001.gif) S)–S–CH2–CH2C9H18–CH3-3.31(2H). The 1H NMR spectra of CDSP shows similar chemical shifts which is reported earlier in our previous research.31
S)–S–CH2–CH2C9H18–CH3-3.31(2H). The 1H NMR spectra of CDSP shows similar chemical shifts which is reported earlier in our previous research.31
![[double bond, length as m-dash]](https://www.rsc.org/images/entities/char_e001.gif) CH2, 2H) have been observed at δ (ppm) 6.15 and 5.60. End methyl group of the long aliphatic chain came at 0.9 ppm which is quite expected (marked as ‘h’), sharp peaks in between 1.3–1.7 ppm (marked as f and g) corresponds to methylene protons of the SEMA unit. –CH2 proton adjacent to –(CO) group of SEMA unit came at relatively downfield region of 2.4 ppm (marked as e) due to attachment of electron withdrawing –O(CO)R group. A sharp peak at 4.4 ppm (marked as c and d) corresponds to CH2–CH2 protons which is flanked between two oxygen atoms of HEMA unit.
CH2, 2H) have been observed at δ (ppm) 6.15 and 5.60. End methyl group of the long aliphatic chain came at 0.9 ppm which is quite expected (marked as ‘h’), sharp peaks in between 1.3–1.7 ppm (marked as f and g) corresponds to methylene protons of the SEMA unit. –CH2 proton adjacent to –(CO) group of SEMA unit came at relatively downfield region of 2.4 ppm (marked as e) due to attachment of electron withdrawing –O(CO)R group. A sharp peak at 4.4 ppm (marked as c and d) corresponds to CH2–CH2 protons which is flanked between two oxygen atoms of HEMA unit.![[thin space (1/6-em)]](https://www.rsc.org/images/entities/char_2009.gif) :
:![[thin space (1/6-em)]](https://www.rsc.org/images/entities/char_2009.gif) CDSP
CDSP![[thin space (1/6-em)]](https://www.rsc.org/images/entities/char_2009.gif) :
:![[thin space (1/6-em)]](https://www.rsc.org/images/entities/char_2009.gif) AIBN = 50
AIBN = 50![[thin space (1/6-em)]](https://www.rsc.org/images/entities/char_2009.gif) :
:![[thin space (1/6-em)]](https://www.rsc.org/images/entities/char_2009.gif) 1
1![[thin space (1/6-em)]](https://www.rsc.org/images/entities/char_2009.gif) :
:![[thin space (1/6-em)]](https://www.rsc.org/images/entities/char_2009.gif) 0.25. 1H NMR spectra for poly(PEGMA) (Fig. 2a) shows the complete disappearance of vinyl proton in the corresponding region and all the peaks have been assigned to their respective structure. The poly(PEGMA) shows resonance signal at 4.02 ppm for O–CH2–CH2–O, 3.64 ppm for CH2–O–(CH2–CH2)n, 3.38 ppm for O–CH3 which are characteristic peak for poly(PEGMA).32,38,39 The molecular weight based on end group analysis was calculated by comparing the integral area acquired by the CTA at 2.29–2.48 ppm which corresponds to the COOH–CH2–CH2–C(CN)(CH3)– and the area acquired by the repeating unit of poly(PEGMA) at 3.38 ppm. The degree of polymerization (Dpn) value for poly(PEGMA) was found 26.9–27 and the calculated molecular weight was 7877 g mol−1 (ref. 38) (Table 1). The theoretical molecular weight (Mn,theo) of the homopolymer was also calculated according to the following formula and was found 9763 g mol−1 which is in good agreement with the molecular weight obtained by Mn,NMR.
0.25. 1H NMR spectra for poly(PEGMA) (Fig. 2a) shows the complete disappearance of vinyl proton in the corresponding region and all the peaks have been assigned to their respective structure. The poly(PEGMA) shows resonance signal at 4.02 ppm for O–CH2–CH2–O, 3.64 ppm for CH2–O–(CH2–CH2)n, 3.38 ppm for O–CH3 which are characteristic peak for poly(PEGMA).32,38,39 The molecular weight based on end group analysis was calculated by comparing the integral area acquired by the CTA at 2.29–2.48 ppm which corresponds to the COOH–CH2–CH2–C(CN)(CH3)– and the area acquired by the repeating unit of poly(PEGMA) at 3.38 ppm. The degree of polymerization (Dpn) value for poly(PEGMA) was found 26.9–27 and the calculated molecular weight was 7877 g mol−1 (ref. 38) (Table 1). The theoretical molecular weight (Mn,theo) of the homopolymer was also calculated according to the following formula and was found 9763 g mol−1 which is in good agreement with the molecular weight obtained by Mn,NMR.| Mn,theo=(([SEMA]/[CDSP] × MW of SEMA × conversion) + (molecular weight of CDSP)) |
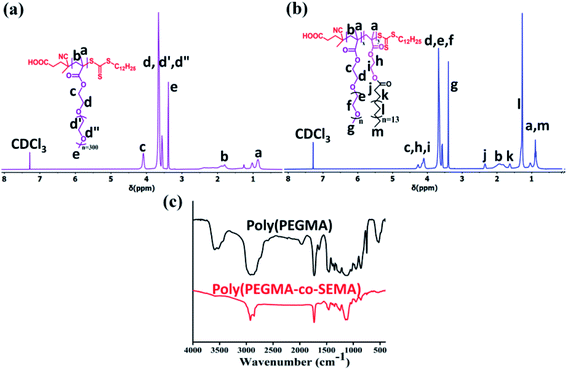 | ||
| Fig. 2 1H NMR spectra of synthesized (a) poly(PEGMA) (b) poly(PEGMA-co-SEMA) (BCP50) polymer and (c) FTIR spectra of poly(PEGMA) and poly(PEGMA-co-SEMA) (BCP50) polymer. | ||
| Polymer | SAMA content | Time (h) | Conv.a (%) | Mn,theob (g mol−1) | Mn,NMRc (g mol−1) | DPnd |
|---|---|---|---|---|---|---|
| a Calculated by 1H NMR spectroscopy.b Theoretical molecular weight (Mn,theo) = ([M]0/[CTA]0 × molecular weight (MW) of [M]) × conversion+ (MW of CTA).c Molecular weight calculated from 1H NMR spectroscopy.d Obtained by 1H NMR spectroscopy. | ||||||
| Poly(PEGMA) | 0 | 12 | 78 | 9763 | 7877 | 27 |
| BCP10 | 10 | 7 | 53 | 8400 | 10![[thin space (1/6-em)]](https://www.rsc.org/images/entities/char_2009.gif) 523 523 |
7 |
| BCP25 | 25 | 7 | 50.7 | 12![[thin space (1/6-em)]](https://www.rsc.org/images/entities/char_2009.gif) 903 903 |
14![[thin space (1/6-em)]](https://www.rsc.org/images/entities/char_2009.gif) 187 187 |
15 |
| BCP50 | 50 | 7 | 59 | 20![[thin space (1/6-em)]](https://www.rsc.org/images/entities/char_2009.gif) 369 369 |
15![[thin space (1/6-em)]](https://www.rsc.org/images/entities/char_2009.gif) 809 809 |
20 |
![[thin space (1/6-em)]](https://www.rsc.org/images/entities/char_2009.gif) :
:![[thin space (1/6-em)]](https://www.rsc.org/images/entities/char_2009.gif) mCTA
mCTA![[thin space (1/6-em)]](https://www.rsc.org/images/entities/char_2009.gif) :
:![[thin space (1/6-em)]](https://www.rsc.org/images/entities/char_2009.gif) AIBN = 10
AIBN = 10![[thin space (1/6-em)]](https://www.rsc.org/images/entities/char_2009.gif) :
:![[thin space (1/6-em)]](https://www.rsc.org/images/entities/char_2009.gif) 0.1
0.1![[thin space (1/6-em)]](https://www.rsc.org/images/entities/char_2009.gif) :
:![[thin space (1/6-em)]](https://www.rsc.org/images/entities/char_2009.gif) 0.025, 25
0.025, 25![[thin space (1/6-em)]](https://www.rsc.org/images/entities/char_2009.gif) :
:![[thin space (1/6-em)]](https://www.rsc.org/images/entities/char_2009.gif) 0.1
0.1![[thin space (1/6-em)]](https://www.rsc.org/images/entities/char_2009.gif) :
:![[thin space (1/6-em)]](https://www.rsc.org/images/entities/char_2009.gif) 0.025 and 50
0.025 and 50![[thin space (1/6-em)]](https://www.rsc.org/images/entities/char_2009.gif) :
:![[thin space (1/6-em)]](https://www.rsc.org/images/entities/char_2009.gif) 0.1
0.1![[thin space (1/6-em)]](https://www.rsc.org/images/entities/char_2009.gif) :
:![[thin space (1/6-em)]](https://www.rsc.org/images/entities/char_2009.gif) 0.025. Copolymers were obtained by dialysis against methanol to remove unreacted monomer using a 3.5 kDa dialysis membrane to get purified BCP and the 1H NMR spectra also show the complete disappearance of the vinyl proton to the corresponding NMR spectra Fig. 2c. The typical 1H NMR spectrum of poly(PEGMA-co-SEMA) block copolymer (Fig. 2b) shows the proton signal at 4.20–4.31 ppm for –O–CH2–CH2–O– of SEMA monomer, 2.33 ppm for O–C
0.025. Copolymers were obtained by dialysis against methanol to remove unreacted monomer using a 3.5 kDa dialysis membrane to get purified BCP and the 1H NMR spectra also show the complete disappearance of the vinyl proton to the corresponding NMR spectra Fig. 2c. The typical 1H NMR spectrum of poly(PEGMA-co-SEMA) block copolymer (Fig. 2b) shows the proton signal at 4.20–4.31 ppm for –O–CH2–CH2–O– of SEMA monomer, 2.33 ppm for O–C![[double bond, length as m-dash]](https://www.rsc.org/images/entities/char_e001.gif) O–CH2–CH2–(CH2)13–CH2–CH3, 1.62 ppm for O–C
O–CH2–CH2–(CH2)13–CH2–CH3, 1.62 ppm for O–C![[double bond, length as m-dash]](https://www.rsc.org/images/entities/char_e001.gif) O–CH2–CH2–(CH2)13–CH2–CH3, 1.26 ppm for O–C
O–CH2–CH2–(CH2)13–CH2–CH3, 1.26 ppm for O–C![[double bond, length as m-dash]](https://www.rsc.org/images/entities/char_e001.gif) O–CH2–CH2–(CH2)13–CH2–CH3 and 0.87 ppm for O–C
O–CH2–CH2–(CH2)13–CH2–CH3 and 0.87 ppm for O–C![[double bond, length as m-dash]](https://www.rsc.org/images/entities/char_e001.gif) O–CH2–CH2–(CH2)13–CH2–CH3.
O–CH2–CH2–(CH2)13–CH2–CH3.The calculated molecular weight of different BCPs is also gradually increasing along with the increase of SEMA monomer feed ratio as the (Table 1). To calculate the molecular weight here we have compared the integral area acquired by the end group of CTA (COOH–CH2–CH2–C(CN)(CH3)–) at 2.29–2.48 ppm and the integral area acquired by the SEMA (–O–CH2–CH2–O–) repeating unit at 4.20–4.31 ppm.38,40 Theoretical molecular weight (Mn,theo) shows a close resemblance with the molecular weight calculated from NMR (Mn,NMR) (Table 1).
Size and morphology of the micelle
Di-block BCPs containing both hydrophobic and hydrophilic blocks are expected to form a stable nanostructure in the aqueous solution where hydrophobes will remain inward to form the core and hydrophilic segment will form a corona. The polymeric chain will self-assemble or will aggregate at a certain concentration commonly termed as critical micelle concentration (CMC) or critical aggregation concentration (CAC). To assess the self-assembled core–shell structure of the synthesized BCPs namely BCP10, BCP25, and BCP50 (1 mg ml−1) in an aqueous environment were studied using hydrodynamic size measurement by DLS and the core–shell morphology of the nanoparticle was investigated by TEM. Fig. 3a shows the regular shape nanoparticle morphology of BCP50 and the size distribution curve shows maximum nanoparticles are within size range from 90–100 nm (Fig. 3b). Fig. 3a shows the structural morphology of BCP where a dark dense inner core and an outer ring-like shell structure is present due to hydrophobic segment SEMA and hydrophilic PEGMA repeating units respectively. The morphology could be defined as a core–shell nanostructure and are beneficial for hydrophobic drug delivery application as the shell act as a shield to the inner core from easy degradation by acidic environment present at the tumor site33 which may lead to prolong release of DOX.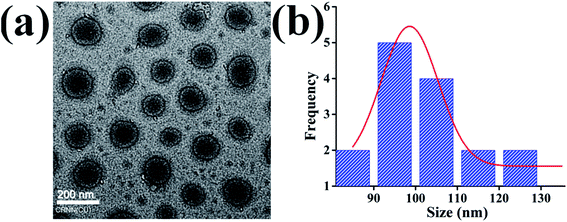 | ||
| Fig. 3 (a) Transmission electron microscopy (TEM) image of core–shell BCP nanoparticles (b) size distribution of BCP50. | ||
The DLS measurement of the nanoparticle shows a significant increment in their size with the increase of SEMA repeating unit whereas dox loaded nanoparticles also show increased diameter accordingly (Table 2). The increase in hydrophobes requires more space to accommodate the long-chain fatty acids. DLS measurement shows nanoparticles are slightly increased in size than TEM images, which is due to the encrusted water to the surface of the PEGMA corona, in case of TEM image the nanoparticles are dehydrated. It is also noted that the hydrodynamic size difference between blank BCPs and DOX loaded BCPs is due to the expansion of the inner core with high drug payload and strong hydrophobic interaction between DOX and stearic acid long chain. It is acknowledged that the miscibility between the hydrophobic segment and hydrophobic drug also increases the cargo load whereas lipid polymeric hybrid micelle containing higher hydrophobic long-chain should solubilize more DOX with increased micellar structure.39,41 The observed zeta potential for with or without drugs was negatively charged (Table 2) suggesting stable colloidal dispersion due to inter particular repulsion. This is due to the presence of the carboxylic group on the polymer backbone and PEGMA ester bond delocalization.42 In the case of DOX loaded nanoparticles decrease of zeta potential indicates the entrapment of positively charged DOX which diminishes the negative charge acquired by the nanoparticles.
| Size (nm) | PDI | Zeta potential | |
|---|---|---|---|
| BCP10 | 148.9 ± 8 | 0.363 ± 0.03 | −24.1 ± 7 |
| BCP25 | 167.8 ± 3 | 0.323 ± 0.07 | −42.4 ± 3 |
| BCP50 | 181.4 ± 7 | 0.318 ± 0.02 | −36.8 ± 3 |
| BCP10-DOX | 199.3 ± 3 | 0.231 ± 0.04 | −19 ± 3 |
| BCP25-DOX | 210.3 ± 11 | 0.511 ± 0.01 | −13.7 ± 1 |
| BCP50-DOX | 255 ± 6 | 0.666 ± 0.01 | −12.9 ± 4 |
Drug loading and release study
Physical entrapment of hydrophobic DOX to a hydrophobic core of the core–shell nanoparticle is dependent upon the hydrophobe chain length and the quantity. Here we have synthesized polymers with an increased segment of stearic acid in BCP10, BCP25, and BCP50. All the polymers have been investigated with drug loading (%) and drug encapsulation efficiency (%) with different polymer/DOX mass ratio.It is found that DOX entrapment is proportional with the increase of stearic acid content that is BCP10 shows only 2.53% drug loading and BCP25, BCP50 shows higher drug loading capability with 5.1% and 5.98% drug loading while the mass ratio is 1![[thin space (1/6-em)]](https://www.rsc.org/images/entities/char_2009.gif) :
:![[thin space (1/6-em)]](https://www.rsc.org/images/entities/char_2009.gif) 1 (polymer
1 (polymer![[thin space (1/6-em)]](https://www.rsc.org/images/entities/char_2009.gif) :
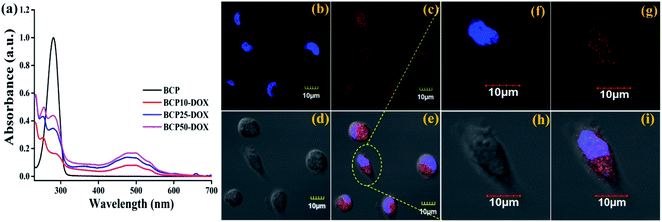
:![[thin space (1/6-em)]](https://www.rsc.org/images/entities/char_2009.gif) DOX) (data shown in Table 3). Similarly, maximum drug loading efficiency attained up to 38.87% for BCP50, and the obtained result can stem from the presence of long-chain lipid molecular structure to the backbone of the hybrid polymer. Indeed, hybrid polymers having long chain hydrophobic structures can accommodate more hydrophobic drugs to their core due to strong hydrophobic interaction.33,39 Further, the DOX loading was confirmed by UV-Vis spectroscopy and DOX shows its characteristic absorption peak at λ = 481 nm (0.5 mg ml−1) (Fig. 4a), furthermore the characteristic red fluorescence due to DOX was also observed inside the cell under CLSM images (Fig. 4b) which confirms the successful entrapment of DOX into the nanoparticles. However, comparing to polymer–drug conjugates, BCPs show higher drug loading capability.14,43,44
DOX) (data shown in Table 3). Similarly, maximum drug loading efficiency attained up to 38.87% for BCP50, and the obtained result can stem from the presence of long-chain lipid molecular structure to the backbone of the hybrid polymer. Indeed, hybrid polymers having long chain hydrophobic structures can accommodate more hydrophobic drugs to their core due to strong hydrophobic interaction.33,39 Further, the DOX loading was confirmed by UV-Vis spectroscopy and DOX shows its characteristic absorption peak at λ = 481 nm (0.5 mg ml−1) (Fig. 4a), furthermore the characteristic red fluorescence due to DOX was also observed inside the cell under CLSM images (Fig. 4b) which confirms the successful entrapment of DOX into the nanoparticles. However, comparing to polymer–drug conjugates, BCPs show higher drug loading capability.14,43,44
Mass ratio (polymer![[thin space (1/6-em)]](https://www.rsc.org/images/entities/char_2009.gif) : :![[thin space (1/6-em)]](https://www.rsc.org/images/entities/char_2009.gif) DOX) DOX) |
DOX feed (mg) | DL% | EE% | |
|---|---|---|---|---|
| BCP10 | 1![[thin space (1/6-em)]](https://www.rsc.org/images/entities/char_2009.gif) : :![[thin space (1/6-em)]](https://www.rsc.org/images/entities/char_2009.gif) 0.1 0.1 |
10 | 2.53 | 10.75 |
| BCP25 | 1![[thin space (1/6-em)]](https://www.rsc.org/images/entities/char_2009.gif) : :![[thin space (1/6-em)]](https://www.rsc.org/images/entities/char_2009.gif) 0.5 0.5 |
10 | 5.1 | 30.6 |
| BCP50 | 1![[thin space (1/6-em)]](https://www.rsc.org/images/entities/char_2009.gif) : :![[thin space (1/6-em)]](https://www.rsc.org/images/entities/char_2009.gif) 1 1 |
10 | 5.98 | 38.87 |
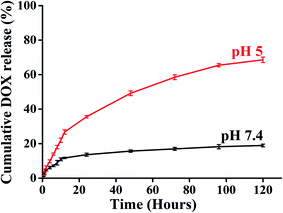
A key feature of a nanoparticle for cancer therapeutics should be sustained release with minimal DOX release to the normal tissue site to escape the cytotoxic effect associated with anticancer drugs. Time-dependent drug release at different pH environments were also assessed to evaluate the drug release behaviour of BCP50 as it has shown maximum drug loading. The DOX release experiment was performed at pH 7.4 and 5 at 37 °C to simulate the condition during transport through systemic circulation and to mimic the cytosolic environment of a tumor cell respectively. The cumulative release profile (%) of DOX was observed for 120 hours (5 days) and the 68% maximum drug release was observed for BCP50 at acidic pH 5 and 18% drug release at blood pH i.e. 7.4 (Fig. 5).
Initial burst release was observed during first 12 hours which suggests the concentration-dependent diffusion of DOX released from the core. After that, the slow-release pattern attributes to the stearic acid hydrophobic core which enables the very slow entry of endosomal enzymes to the core and slow hydrolysis of ester bonds present in SEMA as the ester bond undergoes hydrolysis in acidic condition.39 Different release kinetic models were also employed to understand the drug release mechanism from the nanoparticle matrix. To evaluate the DOX release mechanism we have studied the zero order, first order, Hixon–Crowell, Korsmeyer–Peppas, and Higuchi kinetic models to estimate the regression coefficient values (R2) which are shown in Table 4 with the corresponding graph Fig. S4(a–e) and S5(a–e).† It was observed Korsmeyer–Peppas kinetics model shows maximum R2 value for both acidic and neutral pH and the values for pH 7.4 and 5 is 0.895 and 0.969 respectively. Meanwhile, the release exponent (n) was also found 0.454 and 0.642 which also suggest the non-Fickian diffusion or anomalous diffusion as the n value is lies between 0.43 < n < 0.85 (ref. 45 and 46) which is consistent with the previous report.47
| Kinetic models | pH 7.4 | pH 5.6 | ||
|---|---|---|---|---|
| R2 | Equation | R2 | Equation | |
| Zero order | 0.692 | y = 0.136x + 5.853 | 0.884 | y = 0.578x + 10.487 |
| First order | 0.718 | y = 0.0007x + 5.853 | 0.956 | y = −0.0043x + 1.957 |
| Hixon–Crowell | 0.353 | y = 0.011x + 1.601 | 0.565 | y = 0.0230x + 1.949 |
| Korsmeyer–Peppas | 0.895 | y = 0.454x + 0.453 | 0.969 | y = 0.642x + 0.610 |
| Higuchi | 0.890 | y = 1.712x + 2.677 | 0.907 | y = 6.819x − 1.156 |
Conclusion
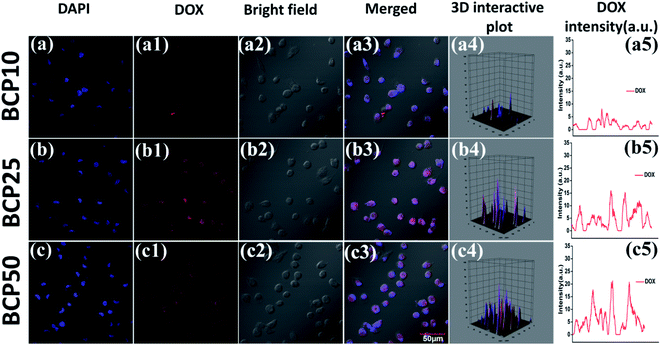
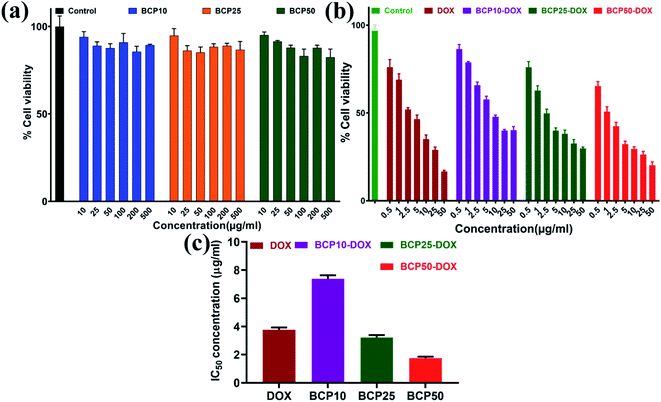
In this study, we have designed a core shell nano template by using PEGMA and SEMA via RAFT polymerization for DOX delivery to MDA MB-231 cancer cell. PEGMA served as the corona or outer shell and SEMA formed the inner hydrophobic core which helps to entrap substantial amount of DOX by strong hydrophobic interaction. The increase in hydrophobic segment showed increase in hydrodynamic diameter of the particle without significant cytotoxic effect upto a relatively higher concentration (0.5 mg ml−1). Furthermore, SEMA content greatly influences the drug loading and release from the inner core. In vitro cellular uptake also indicated successful internalization of the DOX loaded BCPs with increased DOX fluorescence intensity with the increase of SEMA. The in vitro anticancer activity also suggested that the nanoparticle can effectively deliver DOX to the cancer cells. Apoptic cell death was also observed from SEM study. Most of the anticancer drugs are hydrophobic in nature and possess very low bioavailability due to solubility issues. Thus, wrapping them by an amphiphilic polymer containing lipid segment may improve their bio-distribution along with better access to the cancer environment. These results indicated that BCP50 could be a promising nanomaterial for hydrophobic anticancer drug delivery system in near future.Conflicts of interest
The authors have no conflict of interest.Acknowledgements
KS acknowledges to DST-SERB through two sanctioned projects EEQ/2016/000712 and ECR/2016/002018 and also acknowledges UGC for UGC-BSR Research Start-Up Grant (F.30-363/2017(BSR), Dt-08/08/2017) and. PS acknowledges UGC for RGNF-SC fellowship (RGNF-2014-15-SC-TRI-67257). RS acknowledges CU for UPE-II Nanofabrication project fund (UGC/166/UPE-II, Dt-03/04/2017) for financial support. PS also acknowledge Debajit Maiti, Department of Chemistry, Shiv Nadar University, Uttar Pradesh, India for providing NMR facility.References
- W. Smulders and M. J. Monteiro, Macromolecules, 2004, 37, 4474–4483 CrossRef CAS.
- S. L. Banerjee, M. Khamrai, K. Sarkar, N. K. Singha and P. Kundu, Int. J. Biol. Macromol., 2016, 85, 157–167 CrossRef CAS PubMed.
- D. Sutton, N. Nasongkla, E. Blanco and J. Gao, Pharm. Res., 2007, 24, 1029–1046 CrossRef CAS PubMed.
- M. Licciardi, G. Cavallaro, M. Di Stefano, C. Fiorica and G. Giammona, Macromol. Biosci., 2011, 11, 445–454 CrossRef CAS PubMed.
- N. Corrigan, K. Jung, G. Moad, C. J. Hawker, K. Matyjaszewski and C. Boyer, Prog. Polym. Sci., 2020, 101311 CrossRef CAS.
- J. Jennings, G. He, S. M. Howdle and P. B. Zetterlund, Chem. Soc. Rev., 2016, 45, 5055–5084 RSC.
- K. Miyata, R. J. Christie and K. Kataoka, React. Funct. Polym., 2011, 71, 227–234 CrossRef CAS.
- B. Mandal, H. Bhattacharjee, N. Mittal, H. Sah, P. Balabathula, L. A. Thoma and G. C. Wood, Nanomed. Nanotechnol. Biol. Med., 2013, 9, 474–491 CrossRef CAS PubMed.
- H. L. Wong, R. Bendayan, A. M. Rauth and X. Y. Wu, J. Controlled Release, 2006, 116, 275–284 CrossRef CAS PubMed.
- Y. Li, H. L. Wong, A. J. Shuhendler, A. M. Rauth and X. Y. Wu, J. Controlled Release, 2008, 128, 60–70 CrossRef CAS PubMed.
- K. Ghosal, S. Ghosh, D. Ghosh and K. Sarkar, Int. J. Biol. Macromol., 2020, 162, 1605–1615 CrossRef CAS PubMed.
- P. Jana, S. Ghosh and K. Sarkar, Int. J. Biol. Macromol., 2020, 161, 1149–1160 CrossRef CAS PubMed.
- S. Ghosh, K. Ghosal, S. A. Mohammad and K. Sarkar, Chem. Eng. J., 2019, 373, 468–484 CrossRef CAS.
- D. Yu, P. Peng, S. S. Dharap, Y. Wang, M. Mehlig, P. Chandna, H. Zhao, D. Filpula, K. Yang and V. Borowski, J. Controlled Release, 2005, 110, 90–102 CrossRef CAS PubMed.
- K. Ghosal and K. Sarkar, ACS Biomater. Sci. Eng., 2018, 4, 2653–2703 CrossRef CAS PubMed.
- K. Ghosal and A. Ghosh, Mater. Sci. Eng. C, 2019, 96, 887–903 CrossRef CAS PubMed.
- Q. Gao, Q. Liang, F. Yu, J. Xu, Q. Zhao and B. Sun, Colloids Surf., B, 2011, 88, 741–748 CrossRef CAS PubMed.
- K. Sarkar, S. L. Banerjee, P. Kundu, G. Madras and K. Chatterjee, J. Mater. Chem. B, 2015, 3, 5266–5276 RSC.
- Y. Y. Yang, Y. Wang, R. Powell and P. Chan, Clin. Exp. Pharmacol. Physiol., 2006, 33, 557–562 CrossRef CAS PubMed.
- G. Prencipe, S. M. Tabakman, K. Welsher, Z. Liu, A. P. Goodwin, L. Zhang, J. Henry and H. Dai, J. Am. Chem. Soc., 2009, 131, 4783–4787 CrossRef CAS PubMed.
- A. Szymborska and H. Gerhardt, Cold Spring Harbor Perspect. Biol., 2018, 10, a029223 CrossRef PubMed.
- H. Yuan, L.-J. Lu, Y.-Z. Du and F.-Q. Hu, Mol. Pharmaceutics, 2011, 8, 225–238 CrossRef CAS PubMed.
- F.-Q. Hu, X.-l. Wu, Y.-Z. Du, J. You and H. Yuan, Eur. J. Pharm. Biopharm., 2008, 69, 117–125 CrossRef CAS PubMed.
- K. Ulbrich, Č. Koňák, Z. Tuzar and J. Kopeček, Macromol. Chem. Phys., 1987, 188, 1261–1272 CrossRef CAS.
- Z. Ahmad, A. Shah, M. Siddiq and H.-B. Kraatz, RSC Adv., 2014, 4, 17028–17038 RSC.
- S. S. Hallan, P. Kaur, V. Kaur, N. Mishra and B. Vaidya, Artif. Cells Nanomed. Biotechnol., 2016, 44, 334–349 CrossRef CAS PubMed.
- R. Greenwald, J. Controlled Release, 2001, 74, 159–171 CrossRef CAS.
- G. Kwon, S. Suwa, M. Yokoyama, T. Okano, Y. Sakurai and K. Kataoka, J. Controlled Release, 1994, 29, 17–23 CrossRef CAS.
- M. J. Joralemon, S. McRae and T. Emrick, Chem. Commun., 2010, 46, 1377–1393 RSC.
- X. Sun, R. Rossin, J. L. Turner, M. L. Becker, M. J. Joralemon, M. J. Welch and K. L. Wooley, Biomacromolecules, 2005, 6, 2541–2554 CrossRef CAS PubMed.
- R. Saha, S. Bhayye, S. Ghosh, A. Saha and K. Sarkar, ACS Appl. Bio Mater., 2019, 2, 5349–5365 CrossRef CAS.
- B. Maiti and P. De, RSC Adv., 2013, 3, 24983–24990 RSC.
- T. Wei, C. Chen, J. Liu, C. Liu, P. Posocco, X. Liu, Q. Cheng, S. Huo, Z. Liang and M. Fermeglia, Proc. Natl. Acad. Sci., 2015, 112, 2978–2983 CrossRef CAS PubMed.
- A. O. Costa, C. N. Lunardi and A. J. Gomes, Curr. Nanomed., 2020, 10, 63–75 CrossRef CAS.
- S. Ghosh, S. Das, A. K. De, N. Kar and T. Bera, RSC Adv., 2017, 7, 29575–29590 RSC.
- A. Basu, P. Upadhyay, A. Ghosh, D. Chattopadhyay and A. Adhikary, ACS Biomater. Sci. Eng., 2018, 5, 373–389 CrossRef PubMed.
- K. G. Goswami, B. Saha, S. Mete and P. De, Macromol. Chem. Phys., 2018, 219, 1800398 CrossRef.
- B. Maiti, S. Maiti and P. De, RSC Adv., 2016, 6, 19322–19330 RSC.
- P. Laskar, B. Saha, S. K. Ghosh and J. Dey, RSC Adv., 2015, 5, 16265–16276 RSC.
- S. S. Jena, S. G. Roy, V. Azmeera and P. De, React. Funct. Polym., 2016, 99, 26–34 CrossRef CAS.
- C. Maiti, S. Parida, S. Kayal, S. Maiti, M. Mandal and D. Dhara, ACS Appl. Mater. Interfaces, 2018, 10, 5318–5330 CrossRef CAS PubMed.
- F. Quaglia, L. Ostacolo, G. De Rosa, M. I. La Rotonda, M. Ammendola, G. Nese, G. Maglio, R. Palumbo and C. Vauthier, Int. J. Pharm., 2006, 324, 56–66 CrossRef CAS PubMed.
- R. B. Greenwald, Y. H. Choe, J. McGuire and C. D. Conover, Adv. Drug Delivery Rev., 2003, 55, 217–250 CrossRef CAS.
- E. Jäger, A. Jäger, P. Chytil, T. Etrych, B. Říhová, F. C. Giacomelli, P. Štěpánek and K. Ulbrich, J. Controlled Release, 2013, 165, 153–161 CrossRef PubMed.
- J. Siepmann and N. Peppas, Adv. Drug Delivery Rev., 2001, 48, 165 Search PubMed.
- S. Ghosh, N. Kar and T. Bera, Int. J. Biol. Macromol., 2016, 93, 961–970 CrossRef CAS PubMed.
- X. Jin, Q. Wang, J. Sun, H. Panezai, S. Bai and X. Wu, Microporous Mesoporous Mater., 2017, 254, 77–85 CrossRef CAS.
- S. De, K. Patra, D. Ghosh, K. Dutta, A. Dey, G. Sarkar, J. Maiti, A. Basu, D. Rana and D. Chattopadhyay, ACS Biomater. Sci. Eng., 2018, 4, 514–531 CrossRef CAS PubMed.
- S. Ghorai, I. Roy, S. De, P. S. Dash, A. Basu and D. Chattopadhyay, New J. Chem., 2020, 44, 5366–5376 RSC.
- N. Pipan and M. Sterle, Cell Tissue Res., 1986, 246, 647–652 CrossRef CAS.
- A. Zafar, S. Singh, Y. K. Satija, D. Saluja and I. Naseem, Toxicol. In Vitro, 2018, 46, 19–28 CrossRef CAS PubMed.
- K. M. Ibiyeye, A. B. Z. Zuki, N. Nordin and M. Ajat, Front. Radiat. Oncol., 2019, 9, 599 CrossRef PubMed.
- P. Sarkar, S. Ghosh and K. Sarkar, Colloids Surf., B, 2020, 197, 111382 CrossRef PubMed.
Footnote |
| † Electronic supplementary information (ESI) available. See DOI: 10.1039/d1ra01660a |
| This journal is © The Royal Society of Chemistry 2021 |


