 Open Access Article
A hydrothermal synthesis of Ru-doped LiMn1.5Ni0.5O4 cathode materials for enhanced electrochemical performance
Dengfeng Zhouab,
Junqi Li*a,
Can Chena,
Fangchang Lina,
Hongming Wucd and
Jianbing Guo *ac
*ac
aCollege of Materials and Metallurgy, Guizhou University, Guiyang 550025, China. E-mail: jqli@gzu.edu.cn; jianbing.guo@126.com
bSchool of Materials and Metallurgical Engineering, Guizhou Institute of Technology, Guiyang 550003, China
cNational Engineering Research Center for Compounding and Modification of Polymer Materials, Guiyang, 550014, China
dGuizhou Material Industrial Technology Institute, Material Technology Innovation Base of Guizhou Province, Guiyang, 550014, China
First published on 30th March 2021
Abstract
An Ru-doped spinel-structured LiNi0.5Mn1.5O4 (LNMO) cathode has been prepared via a simple hydrothermal synthesis method. The as-prepared cathode is characterized via Fourier transform infrared (FTIR) spectroscopy, powder X-ray diffraction (XRD), scanning electron microscopy (SEM), laser particle size distribution analysis, X-ray photoelectron spectroscopy (XPS) and electrochemistry performance tests. The FTIR spectroscopy and XRD analyses show that the Ru-doped LNMO has a good crystallinity with a disordered Fd![[3 with combining macron]](https://www.rsc.org/images/entities/char_0033_0304.gif) m space group structure. The disordered structure in the cathode increased and the LixNi1−xO impurity phase decreased when Ru addition increased. SEM shows that all samples are octahedral particles with homogeneous sizes distribution, and the particle size analysis shows that the Ru-doped samples have smaller particle size. XPS confirms the existence of Ru ions in the sample, and reveals that the Ru induce to part of Mn4+ transfers to Mn3+ in the LNMO. The electrochemical property indicated that the Ru-doped cathode exhibits better electrochemical properties in terms of discharge capacity, cycle stability and rate performance. At a current density of 50 mA g−1, the discharge specific capacity of the Ru-4 sample is 140 mA h g−1, which is much higher than that of the other samples. It can be seen from the rate capacity curves that the Ru-doped samples exhibit high discharge specific capacity, particularly at high current density.
m space group structure. The disordered structure in the cathode increased and the LixNi1−xO impurity phase decreased when Ru addition increased. SEM shows that all samples are octahedral particles with homogeneous sizes distribution, and the particle size analysis shows that the Ru-doped samples have smaller particle size. XPS confirms the existence of Ru ions in the sample, and reveals that the Ru induce to part of Mn4+ transfers to Mn3+ in the LNMO. The electrochemical property indicated that the Ru-doped cathode exhibits better electrochemical properties in terms of discharge capacity, cycle stability and rate performance. At a current density of 50 mA g−1, the discharge specific capacity of the Ru-4 sample is 140 mA h g−1, which is much higher than that of the other samples. It can be seen from the rate capacity curves that the Ru-doped samples exhibit high discharge specific capacity, particularly at high current density.
1. Introduction
Since Sony developed the first commercial lithium battery in 1991, lithium batteries have been used in different commercial electrical products.1–4 The development of high energy density and low-cost lithium-ion batteries is one of the research hotspots. The cathode material is an essential component of lithium-ion batteries and has a great influence on the capacity and operating voltage of the battery. Therefore, it is very important for the research and exploration of cathode materials.5–8 The main cathode materials used in lithium-ion batteries include the layer structure (LiCoO2), spinel structure (LiNi0.5Mn1.5O4) and olivine structure (LiFePO4).9 The earliest commercial cathode material for lithium-ion secondary batteries is LiCoO2 with a layered structure, which is beneficial for the diffused Li+ ions in the 2D diffusion channel of the CoO2 layer.10 Nonetheless, a series of problems have appeared in the LiCoO2 cathode. For example, all Li ions cannot undergo a reversible intercalation/de-intercalation reaction due to their own structure. In particular, after numerous times of charging/discharging processes, its crystal structure will undergo changes and its capacity will be reduced, resulting in the decline of its cycling performance. Moreover, cobalt is expensive and toxic.11,12 Therefore, it is necessary to explore new cathode materials with high energy density, power density, and suitable price and stable properties. Compared to LiCoO2, the LiNi0.5Mn1.5O4 cathode has a higher operating voltage of 4.7 V, higher than LiCoO2 (3.7 V). The LiNi0.5Mn1.5O4 cathode also has a higher energy density (∼658 W h kg−1).13 The spinel LiNi0.5Mn1.5O4 cathode material is considered one of the most promising cathode materials for lithium-ion batteries.The spinel LiNi0.5Mn1.5O4 cathode material with the Fd![[3 with combining macron]](https://www.rsc.org/images/entities/char_0033_0304.gif) m space group is fit for Li+ diffusion.14,15 Lithium-ion can be diffused along the (011), (101), and (110) directions creating a 3D Li+-diffused channel. This character makes it easy to obtain high power density.13,16 The problem with the LiNi0.5Mn1.5O4 cathode is that it will have a series of side reactions with the electrolyte at high voltages (∼5 V), which will reduce the cycle life and safety of the battery. Therefore, it is necessary to modify the LiNi0.5Mn1.5O4 cathode.17,18 In general, surface modification and metal-ion doping for the LiNi0.5Mn1.5O4 cathode are effective methods to solve this problem.19–22 In previous studies, cationic doping with Cr,23 Fe,24 Cu,25 Si,6 Mg,26 Zr,27 and Al28 has been used to eliminate this problem. Although this method improves the cycle lifetime and safety of lithium batteries, it cannot solve the relatively low intrinsic conductivity of LiNi0.5Mn1.5O4 that restricts the capacity of the battery at high rates. The doping of Ru transition metal ion in LiNi0.5Mn1.5O4 is an effective method to solve this problem.29 Compared with the 3d orbital, the Ru 4d orbital with a larger radius of the second-row transition metal ions overlapping with the 2p orbital of oxygen favors wider conduction bands.30 Moreover, the study of improving the electrochemical properties of LNMO via different synthesis techniques to achieve Ru doping is still under continuous exploration and improvement. Wang et al.31,32 prepared an Ru-doped LNMO cathode electrode via a solid-state reaction and polymer-assisted method to improve the electrochemical performance of the material. Chae et al.33 prepared Ru doped LNMO cathode materials via the carbon combustion method, and explored the influence of Ru doping on the material structure and composition charges. Although the solid-state method and combustion method are simple, the particle of the cathode sample is not uniformly distributed and easily agglomerates. In contrast, the cathode sample prepared via the hydrothermal method has better particle dispersion, higher particle purity and lower production cost, which are beneficial to obtaining a cathode with excellent discharge capacity and cycle stability.34 Investigating through numerous reports, a few were found on the Ru-doped LNMO cathode prepared via a mild and simple hydrothermal synthesis method.
m space group is fit for Li+ diffusion.14,15 Lithium-ion can be diffused along the (011), (101), and (110) directions creating a 3D Li+-diffused channel. This character makes it easy to obtain high power density.13,16 The problem with the LiNi0.5Mn1.5O4 cathode is that it will have a series of side reactions with the electrolyte at high voltages (∼5 V), which will reduce the cycle life and safety of the battery. Therefore, it is necessary to modify the LiNi0.5Mn1.5O4 cathode.17,18 In general, surface modification and metal-ion doping for the LiNi0.5Mn1.5O4 cathode are effective methods to solve this problem.19–22 In previous studies, cationic doping with Cr,23 Fe,24 Cu,25 Si,6 Mg,26 Zr,27 and Al28 has been used to eliminate this problem. Although this method improves the cycle lifetime and safety of lithium batteries, it cannot solve the relatively low intrinsic conductivity of LiNi0.5Mn1.5O4 that restricts the capacity of the battery at high rates. The doping of Ru transition metal ion in LiNi0.5Mn1.5O4 is an effective method to solve this problem.29 Compared with the 3d orbital, the Ru 4d orbital with a larger radius of the second-row transition metal ions overlapping with the 2p orbital of oxygen favors wider conduction bands.30 Moreover, the study of improving the electrochemical properties of LNMO via different synthesis techniques to achieve Ru doping is still under continuous exploration and improvement. Wang et al.31,32 prepared an Ru-doped LNMO cathode electrode via a solid-state reaction and polymer-assisted method to improve the electrochemical performance of the material. Chae et al.33 prepared Ru doped LNMO cathode materials via the carbon combustion method, and explored the influence of Ru doping on the material structure and composition charges. Although the solid-state method and combustion method are simple, the particle of the cathode sample is not uniformly distributed and easily agglomerates. In contrast, the cathode sample prepared via the hydrothermal method has better particle dispersion, higher particle purity and lower production cost, which are beneficial to obtaining a cathode with excellent discharge capacity and cycle stability.34 Investigating through numerous reports, a few were found on the Ru-doped LNMO cathode prepared via a mild and simple hydrothermal synthesis method.
In this study, different amounts of Ru doping LiNi0.5Mn1.5O4 cathode materials have been prepared by a simple hydrothermal reaction. The crystal structure, morphology, charge–discharge capacity, cycle, and rate performance of the LiMn1.5Ni0.5−xRuxO4 (x = 0, 0.02, 0.04, and 0.06) cathode have been explored. The results reveal that Ru doping can effectively inhibit the formation of impure phases and maintain electrical property stability at high current density, useful for preparing lithium-ion batteries with desirable performance.
2. Experimental
2.1. Material synthesis
Mn (CH3COO)2·4H2O, Ni (CH3COO)2·4H2O and RuO2 of analytical grade were purchased from Aladdin Bio-Chem Technology Co., Ltd, and Li2CO3 and NH4HCO3 were purchased Tianjin Yongda Chemical Reagent Co. Ltd. All reagents were used without further purification. The LiMn1.5Ni0.5−xRuxO4 (x = 0, 0.02, 0.04, and 0.06) cathodes were synthesized via a hydrothermal method.In a typical synthesis process, Li2CO3 (0.025 mol), Mn(CH3COO)2 (0.075 mol), Ni(CH3COO)2 (0.025, 0.024, 0.023, and 0.022 mol) and RuO2 (0, 0.001, 0.002, and 0.003) were dissolved in 90 mL deionized water to obtain a mixture solution A. Simultaneously, NH4HCO3 (7.906 g) was dissolved in 20 mL of deionized water and stirred under 10 °C to obtain solution B. Then, the solution B was added dropwise into the solution A, and the mixture was stirred vigorously to obtain a homogeneous mixture solution. The as-obtained solution was transferred into a high pressure reactor and kept at 190 °C for 24 h. After drying at 90 °C for 12 h, the samples were ground for 2 h. Then, the as-obtained mixture was synthesized to obtain the LiMn1.5Ni0.5−xRuxO4 cathode according to the following procedure: (1) sintering at 650 °C for 5 h; (2) ramping to 850 °C, sintering for 12 h; (3) cooling to 600 °C isothermal for 2 h. The as-prepared samples were named Ru-0, Ru-2, Ru-4 and Ru-6, respectively.
2.2. Material characterization
A Fourier transform infrared spectrometer (Thermo Scientific Nicolet Is50) was used to characterize the ordered and disordered structure of the material. The crystal structure was studied by X-ray diffraction (Bruker D8 Advance) using Cu Kα radiation. The scanning rate was 10° min−1 in 2θ = 10–80°. The morphologies and particle size images, EDS spectra, and mapping images were obtained via field emission scanning electron microscopy (Zeiss Merlin Compact). The particle size distribution curves of all samples were tested using the laser particle size distribution analyzer (Bettersize 2600). The valences of Ni, Mn, C, and Ru elements on the sample surface were measured via X-ray photoelectron spectroscopy (Thermo Scientific K-Alpha) using Al Kα radiation.2.3. Electrochemical measurements
The active materials 80 wt%, conductive carbon black 10 wt%, and polyvinylidene fluoride (PVDF) 10 wt% were evenly mixed and N-methyl-2-pyrrolidone (NMP) was added to the mixture to obtain a slurry solution. The slurry was coated on an Al foil and dried at 80 °C overnight in a vacuum.35 Through slicing, the cathode pole piece is obtained. Lithium was used as the anode. 1 M LiPF6 was dissolved in a mixed solution of diethyl carbonate (DEC), and ethylene carbonate (EC) (volume ratio of 1![[thin space (1/6-em)]](https://www.rsc.org/images/entities/char_2009.gif) :
:![[thin space (1/6-em)]](https://www.rsc.org/images/entities/char_2009.gif) 1) to obtain the electrolyte. The CR-2032 type coin cells were assembled in a glove box filled with argon. The charge/discharge tests were conducted on an automatic galvanostatic charge–discharge tester (NEWARE) at different rates (1C = 200 mA g−1). Electrochemical impedance spectroscopy (EIS) was carried out on an electrochemical workstation (CHI 760E) in a frequency range of 100
1) to obtain the electrolyte. The CR-2032 type coin cells were assembled in a glove box filled with argon. The charge/discharge tests were conducted on an automatic galvanostatic charge–discharge tester (NEWARE) at different rates (1C = 200 mA g−1). Electrochemical impedance spectroscopy (EIS) was carried out on an electrochemical workstation (CHI 760E) in a frequency range of 100![[thin space (1/6-em)]](https://www.rsc.org/images/entities/char_2009.gif) 000–0.01 Hz. All coin cells were tested at room temperature.
000–0.01 Hz. All coin cells were tested at room temperature.
3. Results and discussion
3.1. Structure and morphology
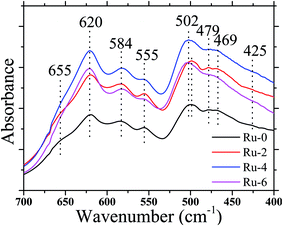
It is well known that LiNi0.5Mn1.5O4 has two space group structures, according to the Ni/Mn disordered face-centered cubic structure (Fd![[3 with combining macron]](https://www.rsc.org/images/entities/char_0033_0304.gif) m space group) and Ni/Mn ordered simple cubic structure (P4332 space group). The crystal structure has a great influence on the electrochemical performance on the cathode. FTIR spectroscopy is used to identify the disordered or ordered structures of spinel LiNi0.5Mn1.5O4. Fig. 1 shows the FTIR spectra of Ru-0, Ru-2, Ru-4, and Ru-6. The spectrum of each sample is similar. The obvious peaks at 620 cm−1 and 584 cm−1 correspond to Mn–O and Ni–O bands, respectively.36 For all the samples, the Mn–O peak located at 620 cm−1 is higher than the Ni–O peak located at 584 cm−1, indicating the existence of the disordered Fd
m space group) and Ni/Mn ordered simple cubic structure (P4332 space group). The crystal structure has a great influence on the electrochemical performance on the cathode. FTIR spectroscopy is used to identify the disordered or ordered structures of spinel LiNi0.5Mn1.5O4. Fig. 1 shows the FTIR spectra of Ru-0, Ru-2, Ru-4, and Ru-6. The spectrum of each sample is similar. The obvious peaks at 620 cm−1 and 584 cm−1 correspond to Mn–O and Ni–O bands, respectively.36 For all the samples, the Mn–O peak located at 620 cm−1 is higher than the Ni–O peak located at 584 cm−1, indicating the existence of the disordered Fd![[3 with combining macron]](https://www.rsc.org/images/entities/char_0033_0304.gif) m space group.37 However, for Ru-0 and Ru-2, they also show weak peaks at around 655 cm−1, which is a characteristic of the P4332 space group structure.38 Moreover, there is no obvious absorption peak at 425 cm−1, indicating that there is a weak ordered P4332 structure in those samples. However, with the further incorporation of Ru, the disappearance of the peak at 655 cm−1 indicates that the ordered structure of the material was further transformed into a disordered structure. In addition, the strength ratios of the Mn–O peak at 620 cm−1 and Ni–O peak at 584 cm−1 are 1.10, 1.10, 1.15 and 1.20, respectively, which further indicate that the disorder of the material is higher with the continuous addition of Ru.39 Therefore, according to the FTIR analysis, the hydrothermal synthesis samples are all disordered Fd
m space group.37 However, for Ru-0 and Ru-2, they also show weak peaks at around 655 cm−1, which is a characteristic of the P4332 space group structure.38 Moreover, there is no obvious absorption peak at 425 cm−1, indicating that there is a weak ordered P4332 structure in those samples. However, with the further incorporation of Ru, the disappearance of the peak at 655 cm−1 indicates that the ordered structure of the material was further transformed into a disordered structure. In addition, the strength ratios of the Mn–O peak at 620 cm−1 and Ni–O peak at 584 cm−1 are 1.10, 1.10, 1.15 and 1.20, respectively, which further indicate that the disorder of the material is higher with the continuous addition of Ru.39 Therefore, according to the FTIR analysis, the hydrothermal synthesis samples are all disordered Fd![[3 with combining macron]](https://www.rsc.org/images/entities/char_0033_0304.gif) m space group structure that contained slightly ordered P4332 space group structure, and the ordered P4332 space group structure continues to decrease with the increase in the Ru ion addition. It is well known that LiNi0.5Mn1.5O4 of the disordered Fd
m space group structure that contained slightly ordered P4332 space group structure, and the ordered P4332 space group structure continues to decrease with the increase in the Ru ion addition. It is well known that LiNi0.5Mn1.5O4 of the disordered Fd![[3 with combining macron]](https://www.rsc.org/images/entities/char_0033_0304.gif) m space group structure has better electrochemical performance than the LiNi0.5Mn1.5O4 of P4332 space group structure. Therefore, the addition of Ru may be beneficial to improve the electrochemical performance of the material.
m space group structure has better electrochemical performance than the LiNi0.5Mn1.5O4 of P4332 space group structure. Therefore, the addition of Ru may be beneficial to improve the electrochemical performance of the material.
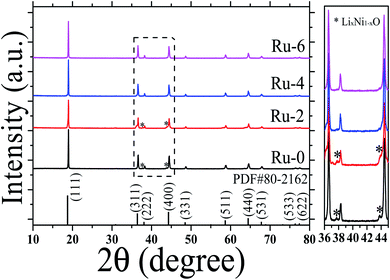
To study the crystal structure of the Ru-doped LiMn1.5Ni0.5O4 materials, the XRD patterns of the LiMn1.5Ni0.5−xRuxO4 (x = 0, 0.02, 0.04, and 0.06) samples were analyzed, as shown in Fig. 2. The sharp diffraction peaks indicate that all the samples have good crystallinity. According to the FTIR analysis, all samples belong to the Fd![[3 with combining macron]](https://www.rsc.org/images/entities/char_0033_0304.gif) m space group, and XRD also shows that all samples conform to the spinel LiMn1.5Ni0.5O4 standard card (PDF# 80-2162). The doping of Ru has no obvious effect on the lattice frame of LiMn1.5Ni0.5O4, and there is no RuO2 phase detected in the samples. However, the Ru-0 and Ru-2 samples have weak diffraction peaks at about 37.6, 43.6, and 63.5°, which are attributed to the LixNi1−xO impurity phase structure.33 With the further doping of Ru, the LixNi1−xO impurity phase structure in Ru-4 and Ru-6 samples disappeared. The results reveal the doped Ru ions did not destroy the cubic spinel crystal structure of the LiMn1.5Ni0.5O4, and can inhibit the formation of an impurity phase, thus stabilizing the cubic spinel crystal structure.
m space group, and XRD also shows that all samples conform to the spinel LiMn1.5Ni0.5O4 standard card (PDF# 80-2162). The doping of Ru has no obvious effect on the lattice frame of LiMn1.5Ni0.5O4, and there is no RuO2 phase detected in the samples. However, the Ru-0 and Ru-2 samples have weak diffraction peaks at about 37.6, 43.6, and 63.5°, which are attributed to the LixNi1−xO impurity phase structure.33 With the further doping of Ru, the LixNi1−xO impurity phase structure in Ru-4 and Ru-6 samples disappeared. The results reveal the doped Ru ions did not destroy the cubic spinel crystal structure of the LiMn1.5Ni0.5O4, and can inhibit the formation of an impurity phase, thus stabilizing the cubic spinel crystal structure.
The morphology and size of the material have important influence on the electrochemical performance.40–42 The SEM images of each sample are shown in Fig. 3. It can be seen from the SEM images that all samples are composed of octahedral-like particles with good crystallinity. The particle sizes of the samples are about 2 μm with numerous nanoparticles attached on the surface. With the addition of Ru, smaller octahedral particles dispersed in the sample, and there are obvious boundaries between particles, which should be because the addition of the Ru source in the sintering process hinders the growth of the cathode material particles.33
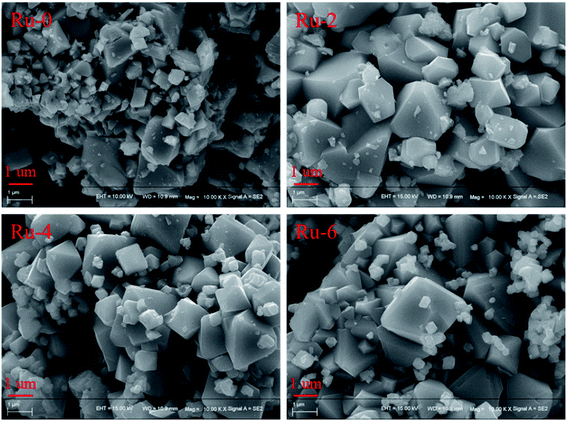 | ||
| Fig. 3 The SEM images of LiMn1.5Ni0.5−xRuxO4 (x = 0, 0.02, 0.04, and 0.06) samples with different Ru-doped contents. | ||
In order to further verify the influence of Ru doping on the particle size distribution of the samples, the particle size distribution curves of all the samples are shown in Fig. 4. It can be observed from Fig. 4 that the D50 value of all the samples is basically around 2 μm, and with the doping of Ru, the D50 value of the samples decreases by about 3.5 μm. This result is consistent with the SEM analysis of the effects of Ru doping on the particle size of the material.
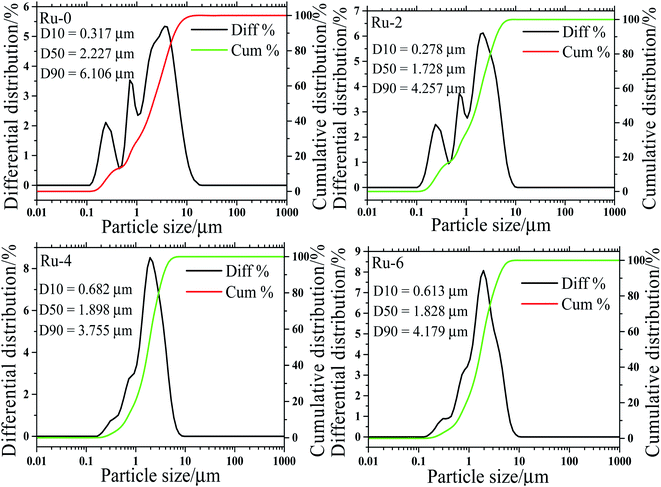 | ||
| Fig. 4 The particle size distribution diagram of LiMn1.5Ni0.5−xRuxO4 (x = 0, 0.02, 0.04, and 0.06) samples with different Ru-doped contents. | ||
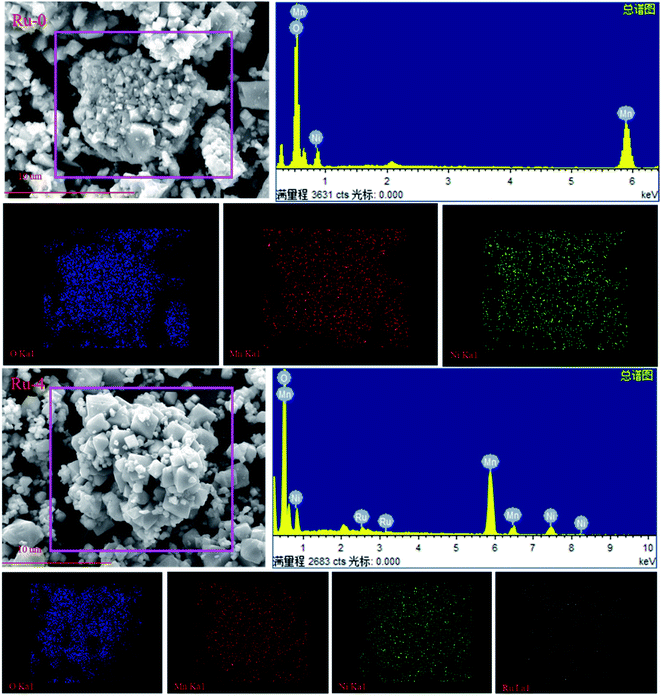
In order to further detect the composition of Ru-doped samples and original samples, EDS spectra and element distribution images of undoped and Ru-doped samples are shown in Fig. 5. It can be clearly seen from the EDS spectrum that the undoped sample only has characteristic peaks of Mn, Ni and O. However, Ru-doped samples with Ru ions doped can have obvious Ru characteristic peaks in EDS spectra. This indicates that Ru ions have been incorporated into the cathode material. It is observed from the elemental distribution diagram that O, Ni and Mn in samples are evenly distributed in each material and present a good distribution.
Fig. 6 shows the XPS spectra of the doped and undoped samples. Fig. 6a showed that all samples were composed of Ni, Mn, O, C and Li, and the Ru element was not detected due to its low content. The scanning spectrum of Ru 3p is represented in Fig. 6b to better characterize the existence of the Ru element. Two distinct diffraction peaks around 486 and 464 eV are observed corresponding to Ru 3p1/2 and Ru 3p3/2, which confirm the existence of Ru.43 Moreover, with the increase in the Ru content, the diffraction peaks of Ru 3p gradually increase. The peak around 281.5 eV in Fig. 6c also confirms the presence of Ru4+.33 Mn ions exist in the form of Mn3+ and Mn4+ in the Fd![[3 with combining macron]](https://www.rsc.org/images/entities/char_0033_0304.gif) m space group structure. Fig. 6d shows two distinct diffraction peaks located at 654 and 642 eV, corresponding to Mn 2p1/2 and Mn 2p3/2. The fitting peaks for the Mn 2p3/2 peak observed at 643.2 and 641.8 eV are attributed to Mn4+ and Mn3+, respectively.39 According to the peak-splitting fitting, the proportions of Mn3+/Mn4+ in Ru-0, Ru-2, Ru-4, and Ru-6 samples were 65.32
m space group structure. Fig. 6d shows two distinct diffraction peaks located at 654 and 642 eV, corresponding to Mn 2p1/2 and Mn 2p3/2. The fitting peaks for the Mn 2p3/2 peak observed at 643.2 and 641.8 eV are attributed to Mn4+ and Mn3+, respectively.39 According to the peak-splitting fitting, the proportions of Mn3+/Mn4+ in Ru-0, Ru-2, Ru-4, and Ru-6 samples were 65.32![[thin space (1/6-em)]](https://www.rsc.org/images/entities/char_2009.gif) :
:![[thin space (1/6-em)]](https://www.rsc.org/images/entities/char_2009.gif) 34.68, 65.56
34.68, 65.56![[thin space (1/6-em)]](https://www.rsc.org/images/entities/char_2009.gif) :
:![[thin space (1/6-em)]](https://www.rsc.org/images/entities/char_2009.gif) 34.44, 65.70
34.44, 65.70![[thin space (1/6-em)]](https://www.rsc.org/images/entities/char_2009.gif) :
:![[thin space (1/6-em)]](https://www.rsc.org/images/entities/char_2009.gif) 34.30, and 66.37
34.30, and 66.37![[thin space (1/6-em)]](https://www.rsc.org/images/entities/char_2009.gif) :
:![[thin space (1/6-em)]](https://www.rsc.org/images/entities/char_2009.gif) 34.63, respectively. It can be seen that with the increase in doped Ru, the content of Mn3+ in the sample also increases gradually. This may be due to the addition of Ru4+ ions induce to part of Mn4+ transfer to Mn3+ to balance the charge. More Mn3+ ions in the material can improve the electrical conductivity of the material.44 This is also consistent with the results of the FTIR analysis that the structure of the disordered Fd
34.63, respectively. It can be seen that with the increase in doped Ru, the content of Mn3+ in the sample also increases gradually. This may be due to the addition of Ru4+ ions induce to part of Mn4+ transfer to Mn3+ to balance the charge. More Mn3+ ions in the material can improve the electrical conductivity of the material.44 This is also consistent with the results of the FTIR analysis that the structure of the disordered Fd![[3 with combining macron]](https://www.rsc.org/images/entities/char_0033_0304.gif) m space group increases with the increase in the Ru content.
m space group increases with the increase in the Ru content.
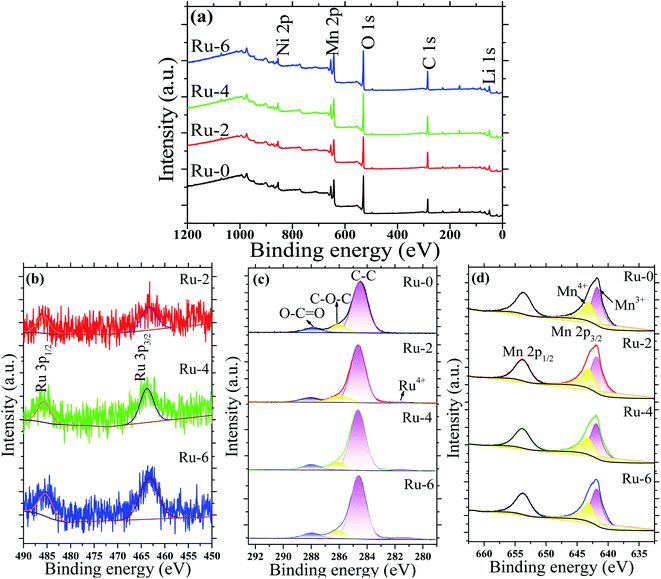 | ||
| Fig. 6 The XPS spectra of LiMn1.5Ni0.5−xRuxO4 (x = 0, 0.02, 0.04, and 0.06) samples: (a) XPS survey spectrogram; (b) Ru 3p spectrogram; (c) C 1s spectrogram; and (d) Mn 2p spectrogram. | ||
3.2. Electrochemical properties
The galvanostatic charge and discharge capacity, cycling stability, and rate performance were measured to examine the electrochemical performance of LNMO cathode materials with different Ru doping contents. Fig. 7 presents the first three charge–discharge capacity curves of Ru-0, Ru-2, Ru-4, and Ru-6 samples measured between 3.0 and 4.9 V at a rate of 0.25C, in which a dominating charge plateau around 4.7 V corresponds to Ni2+/Ni3+ and Ni3+/Ni4+ redox couples and a weak plateau at about 4 V is attributable to the Mn3+/Mn4+ redox couple.33 During the first charge/discharge process, the Ru-0 sample showed a lower charge/discharge specific capacity (97.63/93.64 mA h g−1). While Ru doped samples show a high charge and discharge specific capacity. The Ru-4 sample shows a higher initial charge/discharge specific capacity (139.49/140.16 mA h g−1) and the highest coulomb efficiency (∼100%). This is attributed to the Ru doping. On the one hand, Ru doping hinders the growth of positive particles and shortens the diffusion path of lithium ions. On the other hand, the Ru doping inhibits the formation of LixNi1−xO impurity and expands the diffusion path of lithium ions.33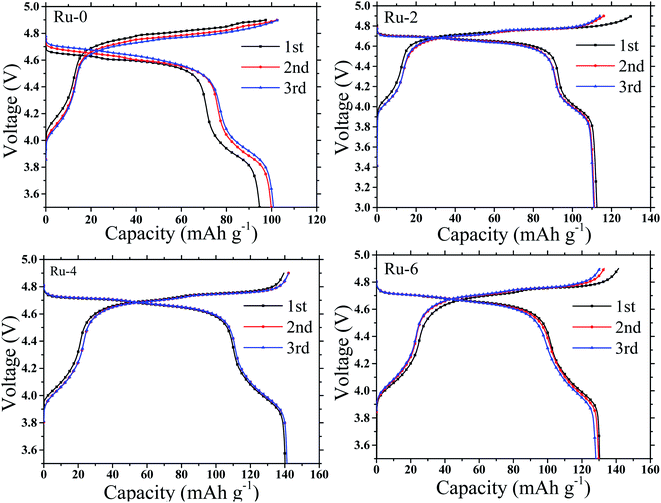 | ||
| Fig. 7 The galvanostatic charging and discharging curve of LiMn1.5Ni0.5−xRuxO4 (x = 0, 0.02, 0.04, and 0.06) samples at 0.25C. | ||
According to the charge–discharge curve analysis, the doping of Ru ions can improve the specific discharge capacity of the spinel cathode. To compare the charge–discharge rate performance of Ru-doped samples and the original sample, the charge–discharge specific capacity of all samples was tested at different current densities of 0.25C to 5C, as shown in Fig. 8a. With the increase in the current density, the discharge specific capacity of all the samples shows a gradual decreasing trend, which is considered to be a result of the increase in battery polarization with the increase in the current density.33 The Ru-doped samples have higher discharge specific capacity than the original samples at different discharge rates. It is worth noting that the discharge specific capacity of the Ru-4 sample is about 10 mA h g−1 higher than that of the Ru-6 sample at a current density below 2.5C. The decisive factor of capacity is the particle size at low current density, and the small particle size is beneficial to lithium-ion diffusion to obtain a high discharge capacity. The D90 of the Ru-4 sample is 3.755 μm, which is smaller than that of the Ru-6 sample (D90, 4.179 μm), so the Ru-4 owns higher capacity. While the current density surpasses 2.5C, the discharge specific capacity of the Ru-6 sample is about 10 mA h g−1, which is higher than that of the Ru-4 sample. This is because the charge transfer resistance (Rct) is dominant for the discharge capacity at larger currents. The Rct of the Ru-6 sample is lower than that of the Ru-4 sample, as shown in Table 2. Therefore, the capacity of Ru-6 is bigger than that of Ru-4 at high current density. According to the analysis above, small amounts of Ru element doping can improve the rate capacity of the spinel cathode material at low current density; however, the rate capacity of materials will be improved at a high current density with the further increase in the content of Ru. This may be because the incorporation of Ru ions expands the diffusion channel of lithium ions and is more conducive to the embedding and exiting of lithium ions.
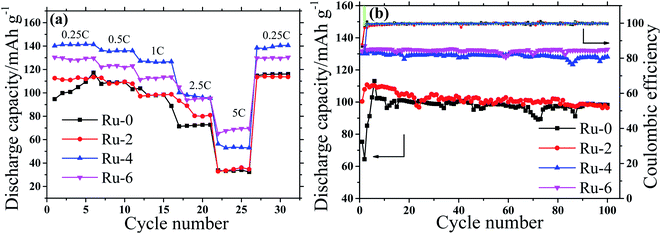 | ||
| Fig. 8 The rate capacity and cycle stability of the LiMn1.5Ni0.5−xRuxO4 (x = 0, 0.02, 0.04, and 0.06) cathodes (a) rate capability, (b) cycle performance. | ||
Fig. 8b shows the discharge capacity of all samples at different cycling numbers at a discharge rate of 1C. It is shown that the discharge specific capacities of Ru-4 and Ru-6 are about 30 mA h g−1 higher than that of the original sample, while the discharge specific capacity of the slightly Ru-doped Ru-4 sample is not much different from that of the original sample. This may be due to the influence of the LixNi1−xO impurity phase and a small amount of the ordered P4332 space group structure in Ru-0 and Ru-2 samples. In the first few cycles, the discharge specific capacity of the original sample is low; however, the discharge specific capacity of the Ru-doped sample basically reached the maximum value, and this stage belongs to the activation stage of the battery. The specific discharge capacity of Ru-doped samples is basically stable in the early stage, which may be related to the fact that Ru doping shortens the lithium ion diffusion path and expands the lithium ion diffusion channel. In order to better show the influence of Ru doping on the electrochemical properties of materials, the initial discharge specific capacity, maximum discharge specific capacity, final discharge specific capacity and capacity retention of each sample are shown in Table 1. It can be seen from Table 1 that Ru doping not only improves the specific discharge capacity of the material, but also improves the cyclic stability of the material. In particular, the discharge specific capacities of Ru-4 and Ru-6 samples are about 30 mA h g−1 higher than that of the original samples, and the capacity retention rates of Ru-4 and Ru-6 samples are 97.82 and 99.86% after 100 cycles, respectively, which are higher than that of the original samples (95.39%). Therefore, it can be seen that Ru ion doping not only improves the specific charge–discharge capacity of the material but also improves the cyclic stability of the material, which should not only be related to the fact that Ru ion doping enlarges the diffusion channel and shortens the diffusion path of lithium ions, but also may be related to the strong TM-O hybridization of 4d transition metal (TM) ions.
| Samples | Discharge capacity (mA h g−1) | Capacity retention ratio | ||
|---|---|---|---|---|
| 1st | Maximum | 100th | ||
| Ru-0 | 75.32 | 102.92 | 98.18 | 95.39% |
| Ru-2 | 100.42 | 110.78 | 96.42 | 87.04% |
| Ru-4 | 130.06 | 131.26 | 128.15 | 97.82% |
| Ru-6 | 131.68 | 133.00 | 132.81 | 99.86% |
Fig. 9 shows the EIS spectra of Ru-0, Ru-2, Ru-4, and Ru-6 after 100 cycles and corresponding equivalent circuit. The EIS curves after the cycle are all composed of a semicircle in the middle and high frequency regions, and a straight line in the low frequency region. The high-frequency and low-frequency semicircles represent the interface resistance (Rf) of lithium-ion migration through the material and electrolyte interface and Rct, respectively.45,46 The straight line represents the resistance (Warburg impedance (Zw)) of lithium ion diffusion in the solid material.47 According to the fitting results of Nyquist plots, the ohmage (Rs), Rf, and Rct values of all samples are shown in Table 2. It is found from Table 2 that the Rs of the electrode is negligible. The Rf of the Ru-doped material increases slightly, which is caused by the formation and thickening of the SEI film on the surface of the material. This may be because the addition of Ru increases the side reaction between the spinel cathode material and the electrolyte. However, the value of Rct of Ru-doped samples decreases gradually, indicating that Ru doping can reduce the charge transfer impedance. This is the reason for the excellent rate performance of Ru-doped materials.
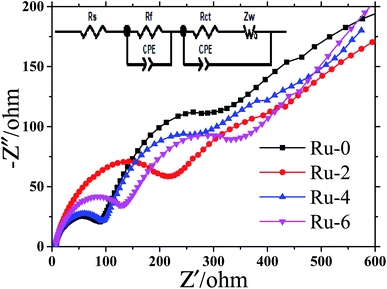 | ||
| Fig. 9 The EIS spectral of LiMn1.5Ni0.5−xRuxO4 (x = 0, 0.02, 0.04, and 0.06) samples after 100 cycles and corresponding equivalent circuit. | ||
| Samples | Rs/Ω | Rf/Ω | Rct/Ω |
|---|---|---|---|
| Ru-0 | 6.049 | 80.36 | 312.5 |
| Ru-2 | 6.422 | 187.60 | 309.8 |
| Ru-4 | 5.119 | 85.48 | 272.9 |
| Ru-6 | 5.822 | 129.9 | 238.8 |
4. Conclusions
In this study, the spinel cathode materials LiNi0.5Mn1.5O4 with the Fd![[3 with combining macron]](https://www.rsc.org/images/entities/char_0033_0304.gif) m space group structure were successfully prepared via a simple hydrothermal reaction, followed by a heat treatment method. All the cathodes have good crystallinity. When Ru was added into LiNi0.5Mn1.5O4, the ordered structure of the cathode decreased, the LixNi1−xO impurity phase decreased, and the content of Mn3+ ion increased in the cathode, which is conducive to the embedding and de-embedding of lithium ions. The electrochemical performance also further verified that the addition of Ru element not only improved the specific discharge capacity of the material but also improved the cyclic performance and rate performance of the material. Particularly, through the rate performance, it is realized that Ru doping can improve the discharge specific capacity of LNMO cathode materials at high current densities.
m space group structure were successfully prepared via a simple hydrothermal reaction, followed by a heat treatment method. All the cathodes have good crystallinity. When Ru was added into LiNi0.5Mn1.5O4, the ordered structure of the cathode decreased, the LixNi1−xO impurity phase decreased, and the content of Mn3+ ion increased in the cathode, which is conducive to the embedding and de-embedding of lithium ions. The electrochemical performance also further verified that the addition of Ru element not only improved the specific discharge capacity of the material but also improved the cyclic performance and rate performance of the material. Particularly, through the rate performance, it is realized that Ru doping can improve the discharge specific capacity of LNMO cathode materials at high current densities.
Conflicts of interest
There are no conflicts to declare.Acknowledgements
This work is financially supported by National Natural Science Foundation of China (51774012), Program of Application and Industrialization of Scientific and Technological Achievements of Guizhou (2016-4538), High-level Innovative Talents Training Project of Guizhou (2016/5667, 2019/5035), and Natural Science Research Project of Guizhou Department of Education ([2019] 068).References
- H. Wang, T. A. Tan, P. Yang, M. O. Lai and L. Lu, High-Rate Performances of the Ru-Doped Spinel LiNi0.5Mn1.5O4: Effects of Doping and Particle Size, J. Phys. Chem. C, 2011, 115, 6102–6110 CrossRef CAS.
- S.-T. Myung, K. Amine and Y.-K. Sun, Nanostructured cathode materials for rechargeable lithium batteries, J. Power Sources, 2015, 283, 219–236 CrossRef CAS.
- L. H. Saw, Y. Ye and A. A. O. Tay, Integration issues of lithium-ion battery into electric vehicles battery pack, J. Cleaner Prod., 2016, 113, 1032–1045 CrossRef CAS.
- Y. Luo, H. Li, T. Lu, Y. Zhang, S. S. Mao, Z. Liu, W. Wen, J. Xie and L. Yan, Fluorine gradient-doped LiNi0.5Mn1.5O4 spinel with improved high voltage stability for Li-ion batteries, Electrochim. Acta, 2017, 238, 237–245 CrossRef CAS.
- J. W. Fergus, Recent developments in cathode materials for lithium ion batteries, J. Power Sources, 2010, 195, 939–954 CrossRef CAS.
- B. Zong, Z. Deng, S. Yan, Y. Lang, J. Gong, J. Guo, L. Wang and G. Liang, Effects of Si doping on structural and electrochemical performance of LiNi0.5Mn1.5O4 cathode materials for lithium-ion batteries, Powder Technol., 2020, 364, 725–737 CrossRef CAS.
- M. S. Whittingham, Lithium batteries and cathode materials, Chem. Rev., 2004, 104, 4271–4301 CrossRef CAS.
- J. Zhang, G. Sun, Y. Han, F. Yu, X. Qin, G. Shao and Z. Wang, Boosted electrochemical performance of LiNi0.5Mn1.5O4 via synergistic modification of Li+-Conductive Li2ZrO3 coating layer and superficial Zr-doping, Electrochim. Acta, 2020, 343, 136105 CrossRef CAS.
- A. Ulvestad, J. N. Clark, O. G. Shpyrko, A. Singer, Y. S. Meng, H. M. Cho, R. Harder, J. Maser and J. W. Kim, Topological defect dynamics in operando battery nanoparticles, Science, 2015, 348, 1344–1347 CrossRef CAS PubMed.
- D. W. Kim, H. Shiiba, N. Zettsu, T. Yamada, T. Kimijima, G. Sánchez-Santolino, R. Ishikawa, Y. Ikuhara and K. Teshima, Full picture discovery for mixed-fluorine anion effects on high-voltage spinel lithium nickel manganese oxide cathodes, NPG Asia Mater., 2017, 9, 1–10 Search PubMed.
- G. Li, S. Zhou, P. Wang and J. Zhao, Halogen-doping in LiCoO2 cathode materials for Li-ion batteries: insights from ab initio calculations, RSC Adv., 2015, 5, 107326–107332 RSC.
- S. H. Kim and C.-S. Kim, Improving the rate performance of LiCoO2 by Zr doping, J. Electroceram., 2009, 23, 254–257 CrossRef CAS.
- A. Manthiram, K. Chemelewski and E.-S. Lee, A perspective on the high-voltage LiMn1.5Ni0.5O4 spinel cathode for lithium-ion batteries, Energy Environ. Sci., 2014, 7, 1339–1350 RSC.
- R. Amin and I. Belharouk, Part I: Electronic and ionic transport properties of the ordered and disordered LiNi0.5Mn1.5O4 spinel cathode, J. Power Sources, 2017, 348, 311–317 CrossRef CAS.
- L. Wang, H. Li, X. Huang and E. Baudrin, A comparative study of Fd-3m and P4332 “LiNi0.5Mn1.5O4”, Solid State Ionics, 2011, 193, 32–38 CrossRef CAS.
- M. Bini, P. Boni, P. Mustarelli, I. Quinzeni, G. Bruni and D. Capsoni, Silicon-doped LiNi0.5Mn1.5O4 as a high-voltage cathode for Li-ion batteries, Solid State Ionics, 2018, 320, 1–6 CrossRef CAS.
- W. Li, Y.-G. Cho, W. Yao, Y. Li, A. Cronk, R. Shimizu, M. A. Schroeder, Y. Fu, F. Zou, V. Battaglia, A. Manthiram, M. Zhang and Y. S. Meng, Enabling high areal capacity for Co-free high voltage spinel materials in next-generation Li-ion batteries, J. Power Sources, 2020, 473, 228579 CrossRef CAS.
- H. Xu, H. Zhang, J. Ma, G. Xu and G. Cui, Overcoming the challenges of 5 V spinel LiNi0.5Mn1.5O4 cathodes with solid polymer electrolytes, ACS Energy Lett., 2019, 4, 2871–2886 CrossRef CAS.
- Q. Wu, X. Zhang, S. Sun, N. Wan, D. Pan, Y. Bai, H. Zhu, Y. Hu and S. Dai, Improved electrochemical performance of spinel LiMn1.5Ni0.5O4 through MgF2 nano-coating, Nanoscale, 2015, 7, 15609–15617 RSC.
- H. Deng, P. Nie, H. Luo, Y. Zhang, J. Wang and X. Zhang, Highly enhanced lithium storage capability of LiNi0.5Mn1.5O4 by coating with Li2TiO3 for Li-ion batteries, J. Mater. Chem. A, 2014, 2, 18256–18262 RSC.
- S. Li, W. Liang, J. Xie, Y. Wei and X. Cui, Synthesis of hollow microspheres LiNi0.5Mn1.5O4 coated with Al2O3 and characterization of the electrochemical capabilities, J. Electrochem. Energy Convers. Storage, 2020, 17, 031007 CrossRef CAS.
- Y. Yang, S. Li, Q. Zhang, Y. Zhang and S. Xu, Spherical agglomeration of octahedral LiNi0.5Co4xMn1.5−3xO4 cathode material prepared by a continuous coprecipitation method for 5V lithium-ion batteries, Ind. Eng. Chem. Res., 2017, 56, 175–182 CrossRef CAS.
- J. Wang, P. Nie, G. Xu, J. Jiang, Y. Wu, R. Fu, H. Dou and X. Zhang, High-voltage LiNi0.45Cr0.1Mn1.45O4 cathode with superlong cycle performance for wide temperature lithium-ion batteries, Adv. Funct. Mater., 2018, 28, 1704808 CrossRef.
- Y. Mu, M. Zeng, X. Wu and X. Tong, Electrochemical performance of LiFexNi0.5−xMn1.5O4 cathode material for lithium-ion batteries, Int. J. Electrochem. Sci., 2017, 12, 6045–6053 CrossRef CAS.
- H. Sun, X. Kong, B. Wang, T. Luo and G. Liu, Cu doped LiNi0.5Mn1.5−xCuxO4 (x = 0, 0.03, 0.05, 0.10, 0.15) with significant improved electrochemical performance prepared by a modified low temperature solution combustion synthesis method, Ceram. Int., 2018, 44, 4603–4610 CrossRef CAS.
- M. Liu, H. Huang, C. Lin, J. Chen and S. Liao, Mg gradient-doped LiNi0.5Mn1.5O4 as the cathode material for Li-ion batteries, Electrochim. Acta, 2014, 120, 133–139 CrossRef CAS.
- S. Feng, X. Kong, H. Sun, B. Wang, T. Luo and G. Liu, Effect of Zr doping on LiNi0.5Mn1.5O4 with ordered or disordered structures, J. Alloys Compd., 2018, 749, 1009–1018 CrossRef CAS.
- Y. Luo, T. Lu, Y. Zhang, L. Yan, S. Mao and J. Xie, Surface-segregated, high-voltage spinel lithium-ion battery cathode material LiNi0.5Mn1.5O4 cathodes by aluminium doping with improved high-rate cyclability, J. Alloys Compd., 2017, 703, 289–297 CrossRef CAS.
- J. Liu and A. Manthiram, Understanding the Improved Electrochemical Performances of Fe-Substituted 5 V Spinel Cathode LiMn1.5Ni0.5O4, J. Phys. Chem. C, 2009, 113, 15073–15079 CrossRef CAS.
- H. Matsumoto, D. Murakami, T. Shimura, S.-I. Hashimoto and H. Iwahara, Mixed electronic-ionic conduction in Ru-doped SrTiO3 at high temperature, J. Electroceram., 2001, 7, 107–111 CAS.
- H. Wang, H. Xia, M. O. Lai and L. Lu, Enhancements of rate capability and cyclic performance of spinel LiNi0.5Mn1.5O4 by trace Ru-doping, Electrochem. Commun., 2009, 11(7), 1539–1542 CrossRef CAS.
- H. Wang, T. Tan, P. Yang, M. Lai and L. Lu, High-rate performances of the Ru-doped spinel LiNi0.5Mn1.5O4: Effects of doping and particle size, J. Phys. Chem. C, 2011, 115, 6102–6110 CrossRef CAS.
- J. Chae, M. Jo, Y.-I. Kim, D.-W. Han, S.-M. Park, Y.-M. Kang and K. Roh, Kinetic favorability of Ru-doped LiNi0.5Mn1.5O4 for high-power lithium-ion batteries, J. Ind. Eng. Chem., 2015, 21, 731–735 CrossRef CAS.
- T. Zhao, X. Gao, Z. Wei, K. Guo, F. Wu, L. Li and R. Chen, Three-dimensional Li1.2Ni0.2Mn0.6O2 cathode materials synthesized by a novel hydrothermal method for lithium-ion batteries, J. Alloys Compd., 2018, 757, 16–23 CrossRef CAS.
- S. Khateeb, A. Lind, R. Santos-Ortiz, N. Shepherd and K. Jones, Effects of steel cell components on overall capacity of pulsed laser deposited FeF2 thin film lithium ion batteries, J. Electrochem. Soc., 2015, 162, A1667–A1674 CrossRef CAS.
- L. Wang, H. Li, X. Huang and E. Baudrin, A comparative study of Fd-3m and P4332 “LiNi0.5Mn1.5O4”, Solid State Ionics, 2011, 193, 32–38 CrossRef CAS.
- H. Fang, L. Li and G. Li, A Low-temperature Reaction Route to High Rate and High Capacity LiNi0.5Mn1.5O4, J. Power Sources, 2007, 167(1), 223–227 CrossRef CAS.
- D. Li, A. Ito, K. Kobayakawa, H. Noguchi and Y. Sato, Electrochemical characteristics of LiNi0.5Mn1.5O4 prepared by spray drying and post-annealing, Electrochim. Acta, 2007, 52, 1919–1924 CrossRef CAS.
- A. Wei, W. Li, Q. Chang, X. Bai, R. He, L. Zhang, Z. Liu and Y. Wang, Effect of Mg2+/F− co-doping on electrochemical performance of LiNi0.5Mn1.5O4 for 5 V lithium-ion batteries, Electrochim. Acta, 2019, 323, 134692 CrossRef CAS.
- S. Al-Khateeb, A. Lind, R. Santos-Ortiz, N. Shepherd and K. S. Jones, Cycling performance and morphological evolution of pulsed laser-deposited FeF2 thin film cathodes for Li-ion batteries, J. Mater. Sci., 2015, 50, 5174–5182 CrossRef CAS.
- S. Al-Khateeb and T. Sparks, Spray pyrolysis of conductor- and binder-free porous FeS2 films for high-performance lithium ion batteries, J. Mater. Sci., 2019, 54, 4089–4104 CrossRef CAS.
- S. Al-Khateeb and T. Sparks, Pore-graded and conductor- and binder-free FeS2 films deposited by spray pyrolysis for high-performance lithium-ion batteries, J. Mater. Res., 2019, 34, 2456–2471 CrossRef CAS.
- G. Mao, W. Yu, Q. Zhou, L. Li, Y. Huang, Y. Yao, D. Chu, H. Tong and X. Guo, Improved electrochemical performance of high-nickel cathode material with electronic conductor RuO2 as the protecting layer for lithium-ion batteries, Appl. Surf. Sci., 2020, 531, 147245 CrossRef CAS.
- H. Y. Sun, X. Kong, B. S. Wang, T. B. Luo and G. Y. Liu, LiNi0.5Mn1.45Zn0.05O4 with excellent electrochemical performance for lithium ion batteries, Int. J. Electrochem. Sci., 2017, 12, 8609–8621 CrossRef CAS.
- D. Aurbach, B. Markovsky, Y. Talyossef, G. Salitra, H. Kim and S. Choi, Studies of cycling behavior, ageing, and interfacial reactions of LiNi0.5Mn1.5O4 and carbon electrodes for lithium-ion 5-V cells, J. Power Sources, 2006, 162, 780–789 CrossRef CAS.
- H. Wang, L. Ben, H. Yu, Y. Chen, X. Yang and X. Huang, Understanding the effects of surface reconstruction on the electrochemical cycling performance of the spinel LiNi0.5Mn1.5O4 cathode material at elevated temperatures, J. Mater. Chem. A, 2017, 5, 822–834 RSC.
- D. Arumugam and G. P. Kalaignan, Synthesis and electrochemical characterization of nano-CeO2-coated nanostructure LiMn2O4 cathode materials for rechargeable lithium batteries, Electrochim. Acta, 2010, 55, 8709–8716 CrossRef CAS.
| This journal is © The Royal Society of Chemistry 2021 |

