 Open Access Article
Copolymer chain formation of 2-oxazolines by in situ 1H-NMR spectroscopy: dependence of sequential composition on substituent structure and monomer ratios†
Sabina Abbrent *a,
Andrii Mahun
 ab,
Miroslava Dušková Smrčková
 a,
Libor Kobera
 a,
Rafał Konefał
 a,
Peter Černocha,
Karel Dušeka and
Jiří Brus
 a
a
aInstitute of Macromolecular Chemistry of the Czech Academy of Sciences, Heyrovskeho nam. 2, 162 06 Prague 6, Czech Republic
bDepartment of Physical and Macromolecular Chemistry, Faculty of Science, Charles University, Hlavova 8, 128 40 Prague 2, Czech Republic
First published on 11th March 2021
Abstract
In situ 1H NMR characterization of copolymerization reactions of various 2-oxazoline monomers at different molar ratios offers detailed insight into the build-up and composition of the polymer chains. Various 2-oxazolines were copolymerized in one single solvent, butyronitrile, with 2-dec-9′-enyl-2-oxazoline, where the double bond allows for post-polymerization modification and can function as a crosslinking unit to form polymer networks. The types of the monomers and their molar ratios in the feed have a strong effect on the microstructure of the forming copolymer chains. Copolymers comprising 2-dec-9′-enyl-2-oxazoline and either 2-ethyl-, 2-isopropyl-, 2-butyl-, 2-heptyl, 2-nonyl- or 2-phenyl-2-oxazoline, show significant differences in sequential structure of copolymers ranging from block to gradient and random ordering of the monomer units. 1H NMR was found to be a powerful tool to uncover detailed oxazoline copolymerization kinetics and evolution of chain composition.
Introduction
Poly(2-oxazoline)s (POx) have attracted the attention of scientists particularly as a class of polymer materials with highly tunable physicochemical properties.1,2 They have shown great potential for biomedical applications3–9 because their aqueous solutions or hydrogels exhibit the volume phase transition of lower critical solution temperature (LCST) type. However, these materials can also be utilized as catalysts,10,11 photolithographic matrices for electronics,1 protective coatings,12 and electronic insulators.13 Versatility of oxazoline polymers,14,15 their chemical and physical properties, “green” production16,17 and biocompatibility also suggest their possible use in renewable power source applications. The requirements for materials used for polymer electrolytes are strict and plentiful including electrochemical stability, good ionic conduction coupled with electronic insulation, wide electrochemical window, robustness against electrical, mechanical, and thermal stresses and last but not least environmental friendliness and biological and chemical stability.18The use of POx-based polymers for any application demands detailed exploration of reaction kinetics, copolymerization behavior and influence of (co)polymer structure on its physicochemical behavior and related processes.19–27 Generally, the copolymerization of various types of 2-oxazoline (Ox) monomers is feasible due to their structural similarity. Oxazoline copolymers ranging from random through gradient to block architectures can be prepared depending on the copolymerization behavior leading to different self-organization in solution.28,29
Polyoxazolines can be easily synthesized by living cationic ring-opening polymerization (CROP) of 2-substituted-2-oxazolines, usually initiated by tosylates or other electrophilic compounds.8,19,30,31 Well-defined POx with relatively narrow dispersity index (Đ) ∼1.2 or even less27 are obtained. Variation of the Ox-substituent controls hydrophilicity32,33 of the final polymer or allows for post-polymerization modification of the POx backbone.34,35
Although many kinetic studies of POx can be found in literature, the results are often incomparable, as different conditions are frequently used; above all various solvents, initiators and polymerization temperatures36–38 (comprehensive literature overview can be found in ESI Table S1†). In recent years many studies have been conducted using the microwave technique,39 which shows significant differences from the reflux method.40 Furthermore, available kinetic studies of (co)polymerization of Ox monomers are usually based on running series of individual reactions or sampling from the reaction mixture with subsequent analysis by combination of gas chromatography (GC), size exclusion chromatography (SEC) and nuclear magnetic resonance (NMR).22,24,41,42
In this contribution, we have used in situ 1H NMR measurements which enabled frequent, quick and detailed tracking (herein with 10 minutes interval) of sample composition throughout the whole polymerization process from its initiation to full conversion of the monomers in a closed, undisturbed system.43–46
Here, we have focused on copolymerization of series of 2-substituted-2-oxazolines (2-ethyl-, 2-isopropyl-, 2-butyl-, 2-heptyl-, 2-nonyl-, and 2-phenyl-) with 2-dec-9′-enyl-2-oxazoline (DecOx), see Fig. 1. DecOx was chosen for its C![[double bond, length as m-dash]](https://www.rsc.org/images/entities/char_e001.gif) C double bond to be later used for crosslinking of the copolymer to form network polymer films. Special attention was paid to selection of solvent suitable for this study (see the Experimental section) which would sufficiently well dissolve both monomers and copolymers and at the same time not impede polymerization kinetics. This contribution presents a novel approach using in situ 1H NMR spectroscopy for the above specified POx monomers to study the influence of their molar ratio in feed on sequential composition of the forming copolymer chain.
C double bond to be later used for crosslinking of the copolymer to form network polymer films. Special attention was paid to selection of solvent suitable for this study (see the Experimental section) which would sufficiently well dissolve both monomers and copolymers and at the same time not impede polymerization kinetics. This contribution presents a novel approach using in situ 1H NMR spectroscopy for the above specified POx monomers to study the influence of their molar ratio in feed on sequential composition of the forming copolymer chain.
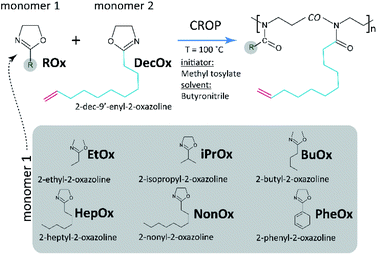 | ||
| Fig. 1 Simplified reaction scheme indicating cationic ring-opening (co)polymerization (CROP) of 2-oxazolines and list of comonomers copolymerized with 2-dec-9′-enyl-2-oxazoline used in this study. | ||
Experimental
Materials
2-Ethyl-2-oxazoline, 2-phenyl-2-oxazoline, butyronitrile, acetonitrile, ethyl acetate, dimethyl carbonate, methyl p-toluene sulfonate, ethanolamine, titanium(IV) oxide, barium oxide, benzoyl chloride, decanoic acid, 10-undecenoic acid and octanoic acid were purchased from Merck and cadmium acetate from Acros Organics. 2-Heptyl-2-oxazoline, 2-nonyl-2-oxazoline, 2-dec-9′-enyl-2-oxazoline were prepared according to literature.16,47 2-isopropyl-2-oxazoline and 2-butyl-2-oxazoline were synthesized following literature.48,49 Butyronitrile was stored over molecular sieve 3 Å. Each 2-oxazoline monomer was vacuum-distilled twice: first over barium oxide, then after addition of 1 vol% of benzoyl chloride. Freshly distilled monomers were stored over argon at 4 °C. All other chemicals were used as received.Choice of solvent
A series of various solvents was considered and tested. Acetonitrile, ethyl acetate, and dimethyl carbonate, widely used for POx studies, were rejected due to poor solubility of the more hydrophobic POx species and their precipitation during polymerization. Common chlorinated solvents were found excellent for all studied POx; however, methylene chloride was rejected due its low boiling point; tetrachloroethylene, because of its broad interfering signal in 1H NMR spectra as well as for significantly higher dispersity of prepared POx polymers (Đ ≈ 1.4) compared to other solvents (Đ = 1.1–1.3). Sulfolane25 was rejected because of its melting point over ambient temperature and related handling difficulties. Finally, butyronitrile24,40 was chosen as it dissolves all used POx species, has reasonable boiling point and suitable chemical shift and relative intensity of its peaks in 1H NMR spectra. Also, contrary to chlorinated solvents, it can be considered a “green material”.Polymerizations
All glassware (vials, NMR-tubes, stoppers, syringes, needles, magnetic stirrers etc.) were dried in oven at 120 °C overnight and directly before experiments let to cool in vacuum desiccator and transferred into glove box with argon atmosphere. Homo- and copolymers were synthesized by living CROP (see Fig. 1).19 Briefly, solvent, monomers and initiator were added into a dry vial with a magnetic stirrer in glovebox under argon atmosphere and crimped. The mixture was well-homogenized and still in glovebox, 0.8 mL aliquots were transferred into dry 5 mm NMR tube via clean and dry glass syringe with needle and sealed with a tight stopper. Immediately after removal from glovebox, filled NMR tubes were flame-sealed and stored in freezer until measurement. The rest of polymerization mixture in the tube was conventionally polymerized in microwave reactor at 100 °C within 4 hours and terminated with adding of 3-fold excess of piperidine. Methyl p-toluene sulfonate was used as initiator at a ratio of monomer(s)-to-initiator 100![[thin space (1/6-em)]](https://www.rsc.org/images/entities/char_2009.gif) :
:![[thin space (1/6-em)]](https://www.rsc.org/images/entities/char_2009.gif) 1 in all cases. NMR-observed polymerizations were conducted directly in NMR chamber preheated to 100 °C ± 0.5 °C.
1 in all cases. NMR-observed polymerizations were conducted directly in NMR chamber preheated to 100 °C ± 0.5 °C.
Monomer(s) concentration in solvent was adjusted to 3 M for 2-ethyl-, 2-isopropyl- and 2-n-butyl-2-oxazoline-based mixtures and to 2 M for 2-heptyl-, 2-nonyl-, 2-phenyl- and 2-dec-9′-enyl-2-oxazoline in order to provide comparable (weight) amounts of the monomers in the corresponding reaction solutions.22 Three different monomer mixtures with ratios of the selected 2-oxazoline and DecOx were prepared and coded 90![[thin space (1/6-em)]](https://www.rsc.org/images/entities/char_2009.gif) :
:![[thin space (1/6-em)]](https://www.rsc.org/images/entities/char_2009.gif) 10, 80
10, 80![[thin space (1/6-em)]](https://www.rsc.org/images/entities/char_2009.gif) :
:![[thin space (1/6-em)]](https://www.rsc.org/images/entities/char_2009.gif) 20 and 60
20 and 60![[thin space (1/6-em)]](https://www.rsc.org/images/entities/char_2009.gif) :
:![[thin space (1/6-em)]](https://www.rsc.org/images/entities/char_2009.gif) 40. These code numbers mean the targeted ranges of molar ratios which naturally differ somewhat from the exact value from sample to sample and are given in Table 1. These ratios were chosen based on the consideration of future cross-linking using DecOx double bond and thus optimization of polymer network structure (not part of this publication). The polymerization temperature of 100 °C was chosen as a compromise ensuring both a relatively high reaction rate and a low extent of side-reactions.50 After the polymerization, samples were analyzed by SEC.
40. These code numbers mean the targeted ranges of molar ratios which naturally differ somewhat from the exact value from sample to sample and are given in Table 1. These ratios were chosen based on the consideration of future cross-linking using DecOx double bond and thus optimization of polymer network structure (not part of this publication). The polymerization temperature of 100 °C was chosen as a compromise ensuring both a relatively high reaction rate and a low extent of side-reactions.50 After the polymerization, samples were analyzed by SEC.
Intended molar ratio ROx![[thin space (1/6-em)]](https://www.rsc.org/images/entities/char_2009.gif) : :![[thin space (1/6-em)]](https://www.rsc.org/images/entities/char_2009.gif) DecOx DecOx |
Real molar ratio ROx![[thin space (1/6-em)]](https://www.rsc.org/images/entities/char_2009.gif) : :![[thin space (1/6-em)]](https://www.rsc.org/images/entities/char_2009.gif) DecOx DecOx |
|||||||
|---|---|---|---|---|---|---|---|---|
| Substituent R | Ethyl- | Isopropyl- | Butyl- | Heptyl- | Nonyl- | Phenyl- | Decenyl- | |
a Intended and real molar ratios of monomers, the average number of repeating monomer units per chain – average degree of polymerization ![[X with combining macron]](https://www.rsc.org/images/entities/i_char_0058_0304.gif) n(i) as calculated from NMR spectra from monomer to initiator ratio (index i – initial) and polymer to initiator ratio (index f – final) (as compared to intended monomer/initiator ratio 100/1). The average ideal molecular weight of polymer chain (Mid) as obtained from n(i) as calculated from NMR spectra from monomer to initiator ratio (index i – initial) and polymer to initiator ratio (index f – final) (as compared to intended monomer/initiator ratio 100/1). The average ideal molecular weight of polymer chain (Mid) as obtained from ![[X with combining macron]](https://www.rsc.org/images/entities/i_char_0058_0304.gif) n(i) and n(i) and ![[M with combining macron]](https://www.rsc.org/images/entities/i_char_004d_0304.gif) n obtained from n obtained from ![[X with combining macron]](https://www.rsc.org/images/entities/i_char_0058_0304.gif) n(f) and real molar ratios obtained from ratios of integrated peak areas (experimental error of NMR estimations 5%). n(f) and real molar ratios obtained from ratios of integrated peak areas (experimental error of NMR estimations 5%). ![[M with combining macron]](https://www.rsc.org/images/entities/i_char_004d_0304.gif) n and n and ![[M with combining macron]](https://www.rsc.org/images/entities/i_char_004d_0304.gif) w values and Đ are obtained from SEC. For definitions see ESI Table S2. w values and Đ are obtained from SEC. For definitions see ESI Table S2. |
||||||||
| Molar ratio | 100![[thin space (1/6-em)]](https://www.rsc.org/images/entities/b_char_2009.gif) : :![[thin space (1/6-em)]](https://www.rsc.org/images/entities/b_char_2009.gif) 0 0 |
|||||||
| NMR | ![[X with combining macron]](https://www.rsc.org/images/entities/i_char_0058_0304.gif) n(i)/ n(i)/![[X with combining macron]](https://www.rsc.org/images/entities/i_char_0058_0304.gif) n(f) n(f) |
65/62 | 78/75 | 65/65 | 67/68 | 60/56 | 55/40 | 70/70 |
![[M with combining macron]](https://www.rsc.org/images/entities/i_char_004d_0304.gif) id/ id/![[M with combining macron]](https://www.rsc.org/images/entities/i_char_004d_0304.gif) n (103) n (103) |
6.4/6.1 | 8.8/8.5 | 8.3/8.3 | 11.5/11.5 | 11.8/11.0 | 8.1/5.9 | 14.6/14.6 | |
| SEC | ![[M with combining macron]](https://www.rsc.org/images/entities/i_char_004d_0304.gif) w/ w/![[M with combining macron]](https://www.rsc.org/images/entities/i_char_004d_0304.gif) n (103) n (103) |
10.2/9.8 | 13.1/10.9 | 11.5/10.0 | 15.0/12.6 | 17.8/15.4 | 9.5/8.7 | 14.9/13.0 |
| Đ | 1.05 | 1.11 | 1.13 | 1.14 | 1.16 | 1.09 | 1.14 | |
| Molar ratio | 90![[thin space (1/6-em)]](https://www.rsc.org/images/entities/b_char_2009.gif) : :![[thin space (1/6-em)]](https://www.rsc.org/images/entities/b_char_2009.gif) 10 10 |
86![[thin space (1/6-em)]](https://www.rsc.org/images/entities/b_char_2009.gif) : :![[thin space (1/6-em)]](https://www.rsc.org/images/entities/b_char_2009.gif) 14 14 |
84![[thin space (1/6-em)]](https://www.rsc.org/images/entities/b_char_2009.gif) : :![[thin space (1/6-em)]](https://www.rsc.org/images/entities/b_char_2009.gif) 16 16 |
85![[thin space (1/6-em)]](https://www.rsc.org/images/entities/b_char_2009.gif) : :![[thin space (1/6-em)]](https://www.rsc.org/images/entities/b_char_2009.gif) 15 15 |
89![[thin space (1/6-em)]](https://www.rsc.org/images/entities/b_char_2009.gif) : :![[thin space (1/6-em)]](https://www.rsc.org/images/entities/b_char_2009.gif) 11 11 |
79![[thin space (1/6-em)]](https://www.rsc.org/images/entities/b_char_2009.gif) : :![[thin space (1/6-em)]](https://www.rsc.org/images/entities/b_char_2009.gif) 21 21 |
91![[thin space (1/6-em)]](https://www.rsc.org/images/entities/b_char_2009.gif) : :![[thin space (1/6-em)]](https://www.rsc.org/images/entities/b_char_2009.gif) 9 9 |
— |
| NMR | ![[X with combining macron]](https://www.rsc.org/images/entities/i_char_0058_0304.gif) n(i)/ n(i)/![[X with combining macron]](https://www.rsc.org/images/entities/i_char_0058_0304.gif) n(f) n(f) |
70/60 | 60/60 | 60/58 | 67/68 | 62/55 | 78/35 | — |
![[M with combining macron]](https://www.rsc.org/images/entities/i_char_004d_0304.gif) id/ id/![[M with combining macron]](https://www.rsc.org/images/entities/i_char_004d_0304.gif) n (103) n (103) |
6.9/5.9 | 6.8/6.8 | 7.6/7.4 | 11.5/11.5 | 12.2/10.8 | 11.4/5.1 | — | |
| SEC | ![[M with combining macron]](https://www.rsc.org/images/entities/i_char_004d_0304.gif) w/ w/![[M with combining macron]](https://www.rsc.org/images/entities/i_char_004d_0304.gif) n (103) n (103) |
10.5/9.9 | 9.5/8.5 | 12.3/10.9 | 14.6/12.8 | 19.9/18.3 | 18.9/17.2 | — |
| Đ | 1.06 | 1.11 | 1.11 | 1.15 | 1.09 | 1.11 | — | |
| Molar ratio | 80![[thin space (1/6-em)]](https://www.rsc.org/images/entities/b_char_2009.gif) : :![[thin space (1/6-em)]](https://www.rsc.org/images/entities/b_char_2009.gif) 20 20 |
77![[thin space (1/6-em)]](https://www.rsc.org/images/entities/b_char_2009.gif) : :![[thin space (1/6-em)]](https://www.rsc.org/images/entities/b_char_2009.gif) 23 23 |
75![[thin space (1/6-em)]](https://www.rsc.org/images/entities/b_char_2009.gif) : :![[thin space (1/6-em)]](https://www.rsc.org/images/entities/b_char_2009.gif) 25 25 |
74![[thin space (1/6-em)]](https://www.rsc.org/images/entities/b_char_2009.gif) : :![[thin space (1/6-em)]](https://www.rsc.org/images/entities/b_char_2009.gif) 26 26 |
76![[thin space (1/6-em)]](https://www.rsc.org/images/entities/b_char_2009.gif) : :![[thin space (1/6-em)]](https://www.rsc.org/images/entities/b_char_2009.gif) 24 24 |
67![[thin space (1/6-em)]](https://www.rsc.org/images/entities/b_char_2009.gif) : :![[thin space (1/6-em)]](https://www.rsc.org/images/entities/b_char_2009.gif) 33 33 |
81![[thin space (1/6-em)]](https://www.rsc.org/images/entities/b_char_2009.gif) : :![[thin space (1/6-em)]](https://www.rsc.org/images/entities/b_char_2009.gif) 19 19 |
— |
| NMR | ![[X with combining macron]](https://www.rsc.org/images/entities/i_char_0058_0304.gif) n(i)/ n(i)/![[X with combining macron]](https://www.rsc.org/images/entities/i_char_0058_0304.gif) n(f) n(f) |
66/59 | 67/69 | 65/63 | 79/73 | 82/72 | 50/35 | — |
![[M with combining macron]](https://www.rsc.org/images/entities/i_char_004d_0304.gif) id/ id/![[M with combining macron]](https://www.rsc.org/images/entities/i_char_004d_0304.gif) n (103) n (103) |
6.5/5.8 | 7.9/7.9 | 8.2/8.0 | 13.2/12.3 | 16.2/14.2 | 7.4/5.1 | — | |
| SEC | ![[M with combining macron]](https://www.rsc.org/images/entities/i_char_004d_0304.gif) w/ w/![[M with combining macron]](https://www.rsc.org/images/entities/i_char_004d_0304.gif) n (103) n (103) |
12.0/11.4 | 13.2/11.8 | 12.5/10.0 | 16.6/13.4 | 18.8/17.4 | 15.7/14.2 | — |
| Đ | 1.05 | 1.10 | 1.15 | 1.18 | 1.08 | 1.10 | — | |
| Molar ratio | 60![[thin space (1/6-em)]](https://www.rsc.org/images/entities/b_char_2009.gif) : :![[thin space (1/6-em)]](https://www.rsc.org/images/entities/b_char_2009.gif) 40 40 |
58![[thin space (1/6-em)]](https://www.rsc.org/images/entities/b_char_2009.gif) : :![[thin space (1/6-em)]](https://www.rsc.org/images/entities/b_char_2009.gif) 42 42 |
60![[thin space (1/6-em)]](https://www.rsc.org/images/entities/b_char_2009.gif) : :![[thin space (1/6-em)]](https://www.rsc.org/images/entities/b_char_2009.gif) 40 40 |
57![[thin space (1/6-em)]](https://www.rsc.org/images/entities/b_char_2009.gif) : :![[thin space (1/6-em)]](https://www.rsc.org/images/entities/b_char_2009.gif) 43 43 |
54![[thin space (1/6-em)]](https://www.rsc.org/images/entities/b_char_2009.gif) : :![[thin space (1/6-em)]](https://www.rsc.org/images/entities/b_char_2009.gif) 46 46 |
52![[thin space (1/6-em)]](https://www.rsc.org/images/entities/b_char_2009.gif) : :![[thin space (1/6-em)]](https://www.rsc.org/images/entities/b_char_2009.gif) 48 48 |
68![[thin space (1/6-em)]](https://www.rsc.org/images/entities/b_char_2009.gif) : :![[thin space (1/6-em)]](https://www.rsc.org/images/entities/b_char_2009.gif) 32 32 |
|
| NMR | ![[X with combining macron]](https://www.rsc.org/images/entities/i_char_0058_0304.gif) n(i)/ n(i)/![[X with combining macron]](https://www.rsc.org/images/entities/i_char_0058_0304.gif) n(f) n(f) |
68/63 | 70/70 | 55/55 | 79/65 | 70/70 | 65/40 | — |
![[M with combining macron]](https://www.rsc.org/images/entities/i_char_004d_0304.gif) id/ id/![[M with combining macron]](https://www.rsc.org/images/entities/i_char_004d_0304.gif) n (103) n (103) |
6.7/6.2 | 7.9/7.9 | 7.0/7.0 | 13.3/11.0 | 13.8/13.8 | 9.6/5.9 | — | |
| SEC | ![[M with combining macron]](https://www.rsc.org/images/entities/i_char_004d_0304.gif) w/ w/![[M with combining macron]](https://www.rsc.org/images/entities/i_char_004d_0304.gif) n (103) n (103) |
14.3/13.5 | 13.2/12.3 | 14.0/12.4 | 16.8/14.8 | 18.8/17.4 | 17.5/15.4 | — |
| Đ | 1.05 | 1.09 | 1.11 | 1.14 | 1.08 | 1.13 | — | |
Instrumental measurements
SEC analysis was performed on a setup equipped with PLgel 5 μm 100 Å and DeltaGel Mixed-B columns, RI detector and mixture of chloroform–triethylamine–isopropanol 94![[thin space (1/6-em)]](https://www.rsc.org/images/entities/char_2009.gif) :
:![[thin space (1/6-em)]](https://www.rsc.org/images/entities/char_2009.gif) 4
4![[thin space (1/6-em)]](https://www.rsc.org/images/entities/char_2009.gif) :
:![[thin space (1/6-em)]](https://www.rsc.org/images/entities/char_2009.gif) 2 as the mobile phase with flow rate of 1 mL min−1. The system was calibrated with poly(methyl methacrylate) standards.
2 as the mobile phase with flow rate of 1 mL min−1. The system was calibrated with poly(methyl methacrylate) standards.
1H NMR spectra were acquired with Bruker Avance III 600 spectrometer operating at Larmor frequency of ν(1H) = 600.2 MHz. The width of 90° pulse was 10 μs, recycle delay (D1) 10 s. Each sample was placed in spectrometer preheated to 100 °C. Deuterated N,N-dimethylformamide-d7 (DMF) and hexamethyldisiloxane (HMDS) in a capillary were placed inside the NMR tube before its filling and sealing and used as external reference. Measurements were conducted every 10 minutes (data are averages over two scans) until full conversion of monomers was reached (usually 3–16 h) using a “zgdelay” pulse program (see ESI Section 2† for details).
Microwave polymerizations were carried out in automated microwave reactor in closed vials with magnetic stirrer (Robot Sixty, Biotage, Sweden) at 100 °C and reaction time of 4–10 hours.
Results and discussion
NMR measurements evaluations
Initially, monomer conversions were measured using 1H NMR spectroscopy and obtained from the integral ratios of resonances corresponding to each monomer and its polymer backbone (–CH2CH2–).51 1H NMR spectra for all monomers are shown in Fig. 2 and individual shifts for each monomer given in ESI (Section 3†) were assigned according to literature.36,52 During polymerization, slight shifts of the individual peaks were observed, caused by changes in solubility and chemical environment of the samples.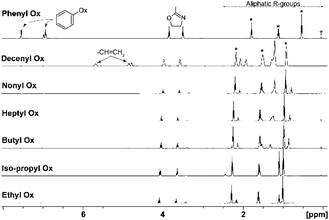 | ||
| Fig. 2 1H NMR spectra of monomers, exact chemical shifts are given in ESI,† peaks with asterisk corresponding to solvent butyronitrile, the cross corresponds to standard HMDS set at 0.05 ppm. Chemical shift of signals corresponding to butyronitrile in 1H NMR spectrum of PheOx to lower frequency is caused by strong shielding effects of the aromatic rings. | ||
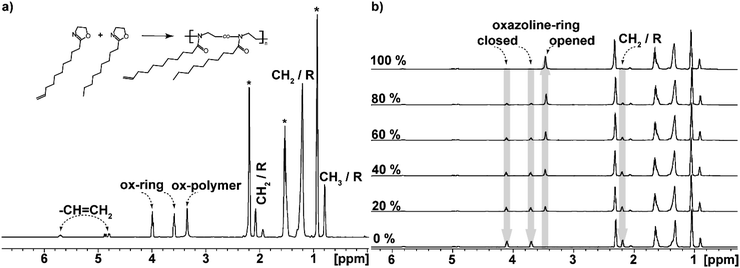
Individual peaks obtained and identified for the copolymers are shown in Fig. 3a. DecOx double bonds found at 5.6 and 4.8 ppm are clearly distinguished and remain unchanged during the polymerization reaction. They can be used for calibration of the three changing oxazoline ring peaks.
At the same time, the peaks corresponding to the oxazoline rings (marked as closed oxazoline ring in Fig. 3) represent the monomers while the POx units are designated as opened oxazoline rings or polymer. Intensities of these peaks change during polymerization reaction; the two monomer peaks decrease while the polymer peak grows as shown in Fig. 3b.
The polymerization degree was calculated from ratio of integral intensity of the butyronitrile solvent peak, which remained constant throughout the reaction, to changing monomer and polymer signals. Using the constant solvent peak as an internal standard, also the real initial ratios of monomers in their mixtures were established from the ratio of DecOx to ROx integrated peaks at t = 0 (from spectra of initial mixture). The experimental molar ratio of monomers to initiator was also determined from the initial spectra and used for estimate of ideal copolymer chain degree of polymerization defined as ![[X with combining macron]](https://www.rsc.org/images/entities/i_char_0058_0304.gif) n(i) given for individual mixtures in Table 1. By comparing the initiator peaks (at ∼6.9 and 7.5 ppm corresponding to the two peaks of benzene ring of reacted initiator) to polymer peaks at full monomer conversion, estimation of real average chain length and molecular weight of the copolymers can be made, see values of
n(i) given for individual mixtures in Table 1. By comparing the initiator peaks (at ∼6.9 and 7.5 ppm corresponding to the two peaks of benzene ring of reacted initiator) to polymer peaks at full monomer conversion, estimation of real average chain length and molecular weight of the copolymers can be made, see values of ![[X with combining macron]](https://www.rsc.org/images/entities/i_char_0058_0304.gif) n(f),
n(f), ![[M with combining macron]](https://www.rsc.org/images/entities/i_char_004d_0304.gif) id,
id, ![[M with combining macron]](https://www.rsc.org/images/entities/i_char_004d_0304.gif) n in Table 1. The difference between
n in Table 1. The difference between ![[X with combining macron]](https://www.rsc.org/images/entities/i_char_0058_0304.gif) n(i) and
n(i) and ![[X with combining macron]](https://www.rsc.org/images/entities/i_char_0058_0304.gif) n(f) values roughly corresponds to the degree of side reactions in the particular comonomer mixture.
n(f) values roughly corresponds to the degree of side reactions in the particular comonomer mixture.
Molecular weights and dispersities obtained by SEC of the polymerized content of NMR-tubes and microwave vials for the NonOx/DecOx system are shown in ESI Section 5† for comparison and show only minor differences. The polymerization time was set to four hours, which according to NMR-based results corresponded to full conversion for all reaction mixtures, except for PheOx systems that demanded ten hours reaction times. The series of experiments conducted in NMR tubes clearly afford better control of the polymerization process, including suppression of side reactions often occurring during microwave polymerization,19,53 especially at high conversions and temperature fluctuations observed in microwave at larger volumes of reaction mixtures. Similar characteristics (monomodal, narrow distribution) were observed for all reactions conducted in NMR tubes. At the chosen temperature of 100 °C, side reactions are insignificant. Furthermore, in situ NMR-based study of POx kinetics proceeds in a closed system without any interruptions and external influences can be dismissed. On the other hand, the limitation of this method is the decreased accuracy of reading peak intensities at extreme points of the reaction course (very small peaks from the polymer initially and the vanishing peaks of the monomer at the end of the polymerization). Therefore, to ensure reproducibility, at least two measurements were conducted and the deconvolutions were determined from mean values of three independent calculations; the differences corresponded to 5% error (for data see ESI Section 6†).
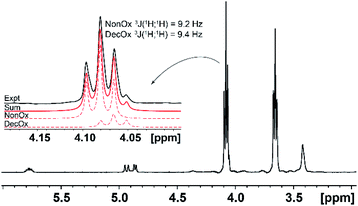
In the case of the comonomers, with exception of PheOx/DecOx (see the shift in Fig. 2), the monomer peaks in NMR spectra overlap. In order to obtain concentration data for each monomer and each measurement, deconvolution analysis was used and the individual peaks and their intensities could thus be obtained as seen in Fig. 4. The fitting of appropriate 1H NMR signal(s) was carried out in TOP SPIN DNMR module by the following steps: firstly, the exact values of 1H NMR shift and J-coupling of each monomer separately were defined in “multiplet analysis – mana” plugin included in TOP SPIN software. Secondly, these parameters were transferred to DNMR module for a two-component system. In view of the fact that the analyzed signal(s) correspond to –CH2– groups, the pseudo-spin was defined as 1 (this agrees with DNMR Lineshape Analysis Software Manual). Then, the intensities of individual peaks were estimated based on expected copolymer ratio and final shape was calculated using automatic procedure of the DNMR module. Fitting of two curves in DNMR employs the minimization of the least-square difference function.54 The final copolymer ratio was obtained as calculated integral areas.
For the analysis of measured spectra following denotations and definitions were used (for overview see ESI Table S2†) c corresponds to relative monomer concentration proportional to molar concentration of both monomers and is obtained directly from 1H NMR spectra (by comparison of integrals of signals from monomers to internal standard); P is defined as the molar concentrations of both polymerized units, obtained directly from NMR spectra from integral ratios of signals from polymer to internal standard. It applies that c + P is constant throughout the reaction.
Monomer molar fractions in the reacting monomer mixture at time t with respect to the initial amount of both monomers, defined as
 | (1) |
The fraction of both polymerized monomer units p1+2 is defined as
 | (2) |
 | (3) |
By deconvolution of the peaks corresponding to c, molar fractions (f1, f2) of each monomer with respect to monomer mixture were obtained, where
 | (4) |
Molar fractions of each monomer in the whole mixture x1 and x2, defined as
| x1 = x1+2 × f1, x2 = x1+2 × f2 | (5) |
Conversions of monomers 1 and 2, α1, α2 are calculated as
 | (6) |
Molar fractions of monomer units in polymer cannot be obtained directly from the spectra as the polymer species are represented by one single broad peak. However, these values are calculated from consumption of monomers as the integral fractions F1 and F2
 | (7) |
 | (8) |
Homopolymerization and copolymerization
The homopolymerization rate, as obtained from integration of the increasing 1H NMR spectral peak corresponding to the open-ring species, is characterized by reaction half-times (Table 2). Different polymerization rates as dependent on monomer substituents are clearly documented. The monomer conversion as a function of time during homopolymerization is also shown in ESI Fig. S3.† The half-time values are around 40 minutes for oxazolines with aliphatic substituents, increasing slightly with the length of the chain. Isopropyl-, decenyl- and phenyl-oxazolines show longer half-times. Monomers containing phenyl- and isopropyl-groups react slower than the aliphatic side-chain species; isopropyl has an electron-donating effect while phenyl weakens polarization (basicity of N) by a mesomeric effect. Alkyls provide weaker electron donating effect, somewhat decreasing with alkyl length, but there is also a steric effect that depends not only on the alkyl length and structure but also on the environment. Also, one should consider effect of dilution by material in alkyl chains.| ROx | t1/2 [min] | |||
|---|---|---|---|---|
Molar ratio ROx![[thin space (1/6-em)]](https://www.rsc.org/images/entities/char_2009.gif) : :![[thin space (1/6-em)]](https://www.rsc.org/images/entities/char_2009.gif) DecOx DecOx |
||||
100![[thin space (1/6-em)]](https://www.rsc.org/images/entities/char_2009.gif) : :![[thin space (1/6-em)]](https://www.rsc.org/images/entities/char_2009.gif) 0 0 |
90![[thin space (1/6-em)]](https://www.rsc.org/images/entities/char_2009.gif) : :![[thin space (1/6-em)]](https://www.rsc.org/images/entities/char_2009.gif) 10 10 |
80![[thin space (1/6-em)]](https://www.rsc.org/images/entities/char_2009.gif) : :![[thin space (1/6-em)]](https://www.rsc.org/images/entities/char_2009.gif) 20 20 |
60![[thin space (1/6-em)]](https://www.rsc.org/images/entities/char_2009.gif) : :![[thin space (1/6-em)]](https://www.rsc.org/images/entities/char_2009.gif) 40 40 |
|
| EtOx | 34 | 32 | 33 | 33 |
| IPrOx | 65 | 54 | 38 | 43 |
| BuOx | 35 | 32 | 32 | 33 |
| HepOx | 43 | 38 | 53 | 53 |
| NonOx | 37 | 58 | 57 | 55 |
| PheOx | 79 | 190 | 210 | 175 |
| DecOx | 78 | — | — | — |
When copolymerization of the oxazolines with DecOx is considered, the half-times are dependent on both monomer substituent type and ratio, also shown in Fig. 5. In the investigated group of six oxazoline comonomers, the short aliphatic side chains (EtOx and BuOx) in copolymerization with DecOx show almost identical half-times as their corresponding homopolymers. Longer aliphatic species in side chain increase the polymerization times with their increasing concentration in feed (HepOx, NonOx). The combination of PheOx with DecOx in the feed is quite distinct: for the three studied ratios, the half-times are more than doubled compared to homopolymers of both monomers. On the other hand, presence of isopropyl substituent causes shortening of the observed copolymerization rate. Clearly, the half-times of copolymerizing systems result from complex mechanism and mutual influences of both comonomers. However, the single half-time value provides only first approximation on reaction rate but little information on the individual monomer consumption and monomer sequencing in the copolymer chain.
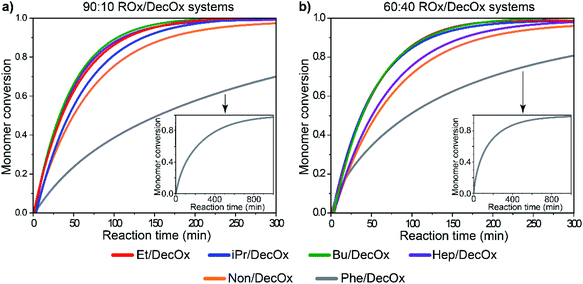 | ||
Fig. 5 Monomer conversion as a function of time for (a) 90![[thin space (1/6-em)]](https://www.rsc.org/images/entities/char_2009.gif) : :![[thin space (1/6-em)]](https://www.rsc.org/images/entities/char_2009.gif) 10 and (b) 60 10 and (b) 60![[thin space (1/6-em)]](https://www.rsc.org/images/entities/char_2009.gif) : :![[thin space (1/6-em)]](https://www.rsc.org/images/entities/char_2009.gif) 40 monomer ratios of oxazoline mixtures, showing full conversion of the systems and full conversion of 2-phenyl-2-oxazoline in the insets. Detailed graphs with data point are depicted in ESI Fig S4.† 40 monomer ratios of oxazoline mixtures, showing full conversion of the systems and full conversion of 2-phenyl-2-oxazoline in the insets. Detailed graphs with data point are depicted in ESI Fig S4.† | ||
At this point, it would be interesting to view the rates of consumption of each monomer in the copolymerizing systems. Therefore, we performed deconvolution of the individual monomer peaks in the 1H NMR spectra (as described in detail above) which enabled direct observation of monomer consumption from the feed. This data provides basis for detailed analysis of the copolymerization kinetics. Firstly, Table 1 presents average chain lengths and molecular weights of the homopolymers and copolymers (![[M with combining macron]](https://www.rsc.org/images/entities/i_char_004d_0304.gif) n) obtained experimentally from 1H NMR, calculated from integral peak ratios of the polymer at full conversion and monomer composition according to eqn (1) and (2) and the same parameters obtained from SEC with materials prepared in microwave for comparison.
n) obtained experimentally from 1H NMR, calculated from integral peak ratios of the polymer at full conversion and monomer composition according to eqn (1) and (2) and the same parameters obtained from SEC with materials prepared in microwave for comparison.
Full monomer conversion α (eqn (3)) for mixtures has been confirmed by the disappearance of 1H NMR peaks corresponding to the oxazoline rings (Fig. 3b).
Changes of copolymer composition in the course of copolymerization
The reactivity ratios (copolymerization parameters) usually serve for better understanding of the copolymerization reactions and allow determination of composition of the copolymer structure. However, for our systems, the copolymerization parameters could not be obtained. Indeed, Fineman–Ross model was used for the calculations, however, no satisfactory results were obtained, see ESI Section 9.† One factor is the limited number of monomer ratios but also the resulting fits of obtained copolymerization parameters show no linear dependency for most copolymers. Instead, the above defined parameters f1, F1 and ΔF1 were used directly for detailed description of the copolymerization reactions in the whole conversion range.As a first step, experimental data in Table 2 were extended to include half-times of each monomer in the pair. Interesting observations can be made by comparing these individual half-times: for example, if the monomer half-time in a mixture significantly differs from its homopolymerization, it is a sign of the effect of environment and dilution by the other comonomer on its reactivity in CROP, such as DecOx in EtOx/DecOx (90![[thin space (1/6-em)]](https://www.rsc.org/images/entities/char_2009.gif) :
:![[thin space (1/6-em)]](https://www.rsc.org/images/entities/char_2009.gif) 10) or PheOx in PheOx/DecOx (all ratios), cf. see ESI Table S5.† The interpretation of individual half-times for various monomer ratios is, however, not straightforward. The 1H NMR analysis enables much more detailed insight into the copolymer chain composition evolving in time. As a first step, monomer relative molar concentrations x1 and x2 were obtained from the deconvolution of monomer peaks and calculated according to eqn (1) and (5). (For plots with experimental data see ESI, Fig. S5 and S6†). Then, the composition of the copolymer was characterized as it developed in time by the composition of monomer mixture in feed characterized by monomer molar fractions f1, f2, integral content of polymerized units in copolymer chains from beginning of copolymerization (F1, F2), differential copolymer composition added during a time interval (ΔF1, ΔF2) and conversions of monomers 1 and 2 (α1, α2) (eqn (4)–(8)). It is especially F1, F2 and α1, α2 as they change in time that offer information about the sequential structure (random, gradient, block) of the copolymers. Below, we will discuss the sequential structure development for each comonomer pair separately, illustrated by panel with four diagrams showing dependence of monomer 1 expressed by f1, F1 and ΔF1 (Fig. 6–11(a), (b) and (c) respectively) – while the parameters for DecOx (monomer 2) are superfluous being complement to 1 (see variable definition above or in ESI Table S2†). In Fig. 6–11(d) the conversion of each monomer in time α1, α2 included for each system shows mutual rate of the incorporation of monomers into the polymer chain providing direct information on the type of forming copolymer. The individual conversions α1, α2 are plotted on the scale 0–1 for each monomer in order to compare the relative rates of their consumption. Changes of monomer molar fractions x1 andx2 obtained from deconvolution of 1H NMR spectra plotted as a function of time and conversion α that were used for calculations of described parameters are given in ESI, Fig. S5 and S6.† Also, graphs shown below but including data points for clarity can be found in ESI, Fig. S7–S10.†
10) or PheOx in PheOx/DecOx (all ratios), cf. see ESI Table S5.† The interpretation of individual half-times for various monomer ratios is, however, not straightforward. The 1H NMR analysis enables much more detailed insight into the copolymer chain composition evolving in time. As a first step, monomer relative molar concentrations x1 and x2 were obtained from the deconvolution of monomer peaks and calculated according to eqn (1) and (5). (For plots with experimental data see ESI, Fig. S5 and S6†). Then, the composition of the copolymer was characterized as it developed in time by the composition of monomer mixture in feed characterized by monomer molar fractions f1, f2, integral content of polymerized units in copolymer chains from beginning of copolymerization (F1, F2), differential copolymer composition added during a time interval (ΔF1, ΔF2) and conversions of monomers 1 and 2 (α1, α2) (eqn (4)–(8)). It is especially F1, F2 and α1, α2 as they change in time that offer information about the sequential structure (random, gradient, block) of the copolymers. Below, we will discuss the sequential structure development for each comonomer pair separately, illustrated by panel with four diagrams showing dependence of monomer 1 expressed by f1, F1 and ΔF1 (Fig. 6–11(a), (b) and (c) respectively) – while the parameters for DecOx (monomer 2) are superfluous being complement to 1 (see variable definition above or in ESI Table S2†). In Fig. 6–11(d) the conversion of each monomer in time α1, α2 included for each system shows mutual rate of the incorporation of monomers into the polymer chain providing direct information on the type of forming copolymer. The individual conversions α1, α2 are plotted on the scale 0–1 for each monomer in order to compare the relative rates of their consumption. Changes of monomer molar fractions x1 andx2 obtained from deconvolution of 1H NMR spectra plotted as a function of time and conversion α that were used for calculations of described parameters are given in ESI, Fig. S5 and S6.† Also, graphs shown below but including data points for clarity can be found in ESI, Fig. S7–S10.†
![[thin space (1/6-em)]](https://www.rsc.org/images/entities/char_2009.gif) :
:![[thin space (1/6-em)]](https://www.rsc.org/images/entities/char_2009.gif) 40 monomer mixture gives rise to almost perfectly random copolymer with identical molar ratios of monomer units in the monomer mixture and in the copolymer as well until 90% conversion after which a short DecOx-rich block is formed (cf. Fig. 6d). The ethyl richer mixtures behave differently: the 80
40 monomer mixture gives rise to almost perfectly random copolymer with identical molar ratios of monomer units in the monomer mixture and in the copolymer as well until 90% conversion after which a short DecOx-rich block is formed (cf. Fig. 6d). The ethyl richer mixtures behave differently: the 80![[thin space (1/6-em)]](https://www.rsc.org/images/entities/char_2009.gif) :
:![[thin space (1/6-em)]](https://www.rsc.org/images/entities/char_2009.gif) 20 mixture initially forms an EtOx-rich polymer which transforms to random copolymer structure after ∼35% conversion is reached. The EtOx-rich 90
20 mixture initially forms an EtOx-rich polymer which transforms to random copolymer structure after ∼35% conversion is reached. The EtOx-rich 90![[thin space (1/6-em)]](https://www.rsc.org/images/entities/char_2009.gif) :
:![[thin space (1/6-em)]](https://www.rsc.org/images/entities/char_2009.gif) 10 mixture shows a steep gradient copolymer formation with EtOx-rich block up to 50% conversion transforming gradually into DecOx-richer gradient copolymer with almost complete depletion of ethyl before 90% conversion is reached (Fig. 6c).
10 mixture shows a steep gradient copolymer formation with EtOx-rich block up to 50% conversion transforming gradually into DecOx-richer gradient copolymer with almost complete depletion of ethyl before 90% conversion is reached (Fig. 6c).
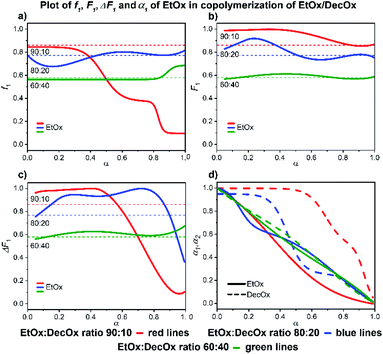 | ||
| Fig. 6 2-Ethyl-2-oxazoline/2-decenyl-2-oxazoline system. Dependence of EtOx (monomer 1) expressed as (a) f1, (b) F1, (c) ΔF1 and (d) α1, α2 plotted as functions of monomer conversion α and fitted by 4th polynomial function for easy viewing. The horizontal lines in (a–c) denote the starting monomer mixture composition determined experimentally from 1H NMR spectra, in (d) full lines represent EtOx and dashed lines DecOx monomers. Graphs including experimental points are presented in ESI.† | ||
Slower reaction of DecOx compared to ethyl in the mixtures 90![[thin space (1/6-em)]](https://www.rsc.org/images/entities/char_2009.gif) :
:![[thin space (1/6-em)]](https://www.rsc.org/images/entities/char_2009.gif) 10 and 80
10 and 80![[thin space (1/6-em)]](https://www.rsc.org/images/entities/char_2009.gif) :
:![[thin space (1/6-em)]](https://www.rsc.org/images/entities/char_2009.gif) 20 can be the reason for the initial tendency to form EtOx-rich block. The formation of DecOx-rich copolymer is the consequence of depletion of monomer mixture by ethyl at higher conversions.
20 can be the reason for the initial tendency to form EtOx-rich block. The formation of DecOx-rich copolymer is the consequence of depletion of monomer mixture by ethyl at higher conversions.
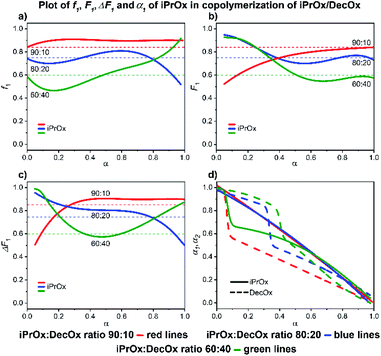 | ||
| Fig. 7 2-iPropyl-2-oxazoline/2-decenyl-2-oxazoline system. Dependence of iPrOx (monomer 1) expressed as (a) f1, (b) F1, (c) ΔF1 and (d) α1, α2 plotted as functions of monomer conversion α and fitted by 4th polynomial function for easy viewing. The horizontal lines in (a–c) denote the starting monomer mixture composition determined experimentally from 1H NMR spectra, in (d) full lines represent iPrOx and dashed lines DecOx monomers. Graphs including experimental points are presented in ESI.† | ||
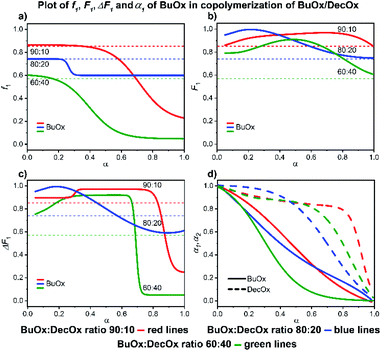 | ||
| Fig. 8 2-Butyl-2-oxazoline/2-decenyl-2-oxazoline system. Dependence of BuOx (monomer 1) expressed as (a) f1, (b) F1, (c) ΔF1 and (d) α1, α2 plotted as functions of monomer conversion α and fitted by 4th polynomial function for easy viewing. The horizontal lines in (a–c) denote the starting monomer mixture composition determined experimentally from 1H NMR spectra, in (d) full lines represent BuOx and dashed lines DecOx monomers. Graphs including experimental points are presented in ESI.† | ||
![[thin space (1/6-em)]](https://www.rsc.org/images/entities/char_2009.gif) :
:![[thin space (1/6-em)]](https://www.rsc.org/images/entities/char_2009.gif) DecOx and result in formation of gradient copolymer almost of diblock-type at the 60
DecOx and result in formation of gradient copolymer almost of diblock-type at the 60![[thin space (1/6-em)]](https://www.rsc.org/images/entities/char_2009.gif) :
:![[thin space (1/6-em)]](https://www.rsc.org/images/entities/char_2009.gif) 40 ratio. The copolymer formed at the ratio 80
40 ratio. The copolymer formed at the ratio 80![[thin space (1/6-em)]](https://www.rsc.org/images/entities/char_2009.gif) :
:![[thin space (1/6-em)]](https://www.rsc.org/images/entities/char_2009.gif) 20 is almost random and a composition with weak gradient is observed at the ratio 90
20 is almost random and a composition with weak gradient is observed at the ratio 90![[thin space (1/6-em)]](https://www.rsc.org/images/entities/char_2009.gif) :
:![[thin space (1/6-em)]](https://www.rsc.org/images/entities/char_2009.gif) 10.
10.
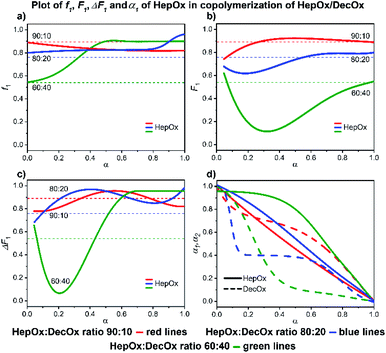 | ||
| Fig. 9 2-Heptyl-2-oxazoline/2-decenyl-2-oxazoline system. Dependence of HepOx (monomer 1) expressed as (a) f1, (b) F1, (c) ΔF1 and (d) α1, α2 plotted as functions of monomer conversion α and fitted by 4th polynomial function for easy viewing. The horizontal lines in (a–c) denote the starting monomer mixture composition determined experimentally from 1H NMR spectra, in (d) full lines represent HepOx and dashed lines DecOx monomers. Graphs including experimental points are presented in ESI.† | ||
![[thin space (1/6-em)]](https://www.rsc.org/images/entities/char_2009.gif) :
:![[thin space (1/6-em)]](https://www.rsc.org/images/entities/char_2009.gif) 40 system, a complete consumption of NonOx is observed at 80% conversion, followed by formation of a short DecOx-block sequence. The 80
40 system, a complete consumption of NonOx is observed at 80% conversion, followed by formation of a short DecOx-block sequence. The 80![[thin space (1/6-em)]](https://www.rsc.org/images/entities/char_2009.gif) :
:![[thin space (1/6-em)]](https://www.rsc.org/images/entities/char_2009.gif) 20 sample shows a sudden, unexpected, increase of NonOx monomer at 80% conversion possibly related to formation of a heterogeneous phase (Fig. 10a).
20 sample shows a sudden, unexpected, increase of NonOx monomer at 80% conversion possibly related to formation of a heterogeneous phase (Fig. 10a).
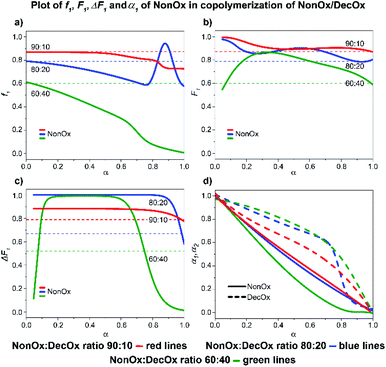 | ||
| Fig. 10 2-Nonyl-2-oxazoline/2-decenyl-2-oxazoline system. Dependence of NonOx (monomer 1) expressed as(a) f1, (b) F1, (c) ΔF1 and (d) α1, α2 plotted as functions of monomer conversion α and fitted by 4th polynomial function for easy viewing. The horizontal lines in (a–c) denote the starting monomer mixture composition determined experimentally from 1H NMR spectra, in (d) full lines represent NonOx and dashed lines DecOx monomers. Graphs including experimental points are presented in ESI.† | ||
![[thin space (1/6-em)]](https://www.rsc.org/images/entities/char_2009.gif) :
:![[thin space (1/6-em)]](https://www.rsc.org/images/entities/char_2009.gif) 10 and 80
10 and 80![[thin space (1/6-em)]](https://www.rsc.org/images/entities/char_2009.gif) :
:![[thin space (1/6-em)]](https://www.rsc.org/images/entities/char_2009.gif) 20 mixtures) and 60% conversion (60
20 mixtures) and 60% conversion (60![[thin space (1/6-em)]](https://www.rsc.org/images/entities/char_2009.gif) :
:![[thin space (1/6-em)]](https://www.rsc.org/images/entities/char_2009.gif) 40 mixture), respectively; thereafter the poly(PheOx) block is formed (Fig. 11). The initial polymer composition corresponds to short poly(DecOx) block followed by a gradient copolymer and finally longer poly(PheOx) block.
40 mixture), respectively; thereafter the poly(PheOx) block is formed (Fig. 11). The initial polymer composition corresponds to short poly(DecOx) block followed by a gradient copolymer and finally longer poly(PheOx) block.
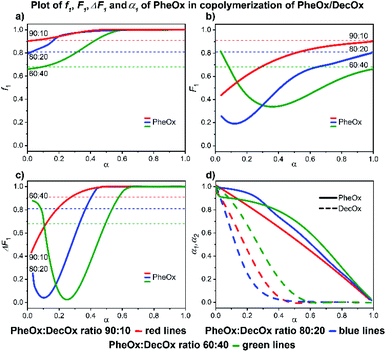 | ||
| Fig. 11 2-Phenyl-2-oxazoline/2-decenyl-2-oxazoline system. Dependence of PheOx (monomer 1) expressed as (a) f1, (b) F1, (c) ΔF1 and (d) α1, α2 plotted as functions of monomer conversion α and fitted by 4th polynomial function for easy viewing. The horizontal lines in (a–c) denote the starting monomer mixture composition determined experimentally from 1H NMR spectra, in (d) full lines represent PheOx and dashed lines DecOx monomers. Graphs including experimental points are presented in ESI.† | ||
Moreover, the spatial distribution of growth centers and monomer molecules can be non-random. The deviation from randomness can be caused by association (clustering) of polar and hydrophobic moieties. The tendency of aliphatic chain substituents to ordering by forming liquid-crystalline structures well documented in the literature can be another reason. Recently, the importance of the solvent effect on the sequential structure of Ox copolymers has been stressed.55 At present, we have no experimental information about the level of aggregation and ordering in these systems.
A short analysis reveals the following features of DecOx-poor mixtures in butyronitrile: the tendencies to form block versus random copolymers are seen to vary for all monomer mixtures depending on the used ratios; a gradient copolymer is usually formed as a transition from block to random-copolymer structure. It can also be concluded that the more structurally similar comonomers form random rather than block-copolymer structures, as is the case for NonOx/DecOx and partly the HepOx/DecOx systems. On the other hand, the BuOx/DecOx and PheOx/DecOx show high tendency to form block copolymers, independently on their initial ratios.
The fact that the choice of substituent strongly influences the composition and microstructure of the forming copolymer has also been established for other Ox pairs.48,56 However, it can be concluded that the monomer ratio has a strong effect on formation of the final polymer morphology. Furthermore, the degree of change in polymer microstructure depending on the initial monomer composition seems to depend on the length of the side-group compared to DecOx and hints to the effect of alignment of the paraffinic side chains. For instance, only 10% increase in the ratio of DecOx to EtOx in the initial mixture alters the polymer morphology from block to random copolymer. On the contrary, more electron-withdrawing substituents such as the phenyl-group clearly induce block copolymerization with small composition changes.
The experimental results obtained by in situ NMR method described here can be compared with predictions obtained by new “visualization method”57,58 of monomer units sequential distribution based on the complete Mayo–Lewis scheme (not steady-state) amended by possible side reactions which uses Monte Carlo method for sampling growing chains. Alternatively, the NMR results could supplement the information by the environment effect not accounted for in the visualization method.
Conclusions
1H NMR spectroscopy was found to be an efficient in situ tool for monitoring and characterization of substituted oxazoline copolymer chains. From the NMR spectra, exact in situ compositions of monomers mixture and the copolymer over the whole conversion range can be obtained in dependence on reaction time.Our results confirm that in CROP the Ox monomers show unpredictable behavior in butyronitrile with a tendency toward formation of block, statistical or random copolymers. Final microstructure depends strongly on the nature of monomer side-group and molar ratio of the Ox comonomers. We also have observed that the usually used Fineman–Ross approximation can be used only in cases where the Ox co-monomers shows tendency to form the same copolymer type for all ratios (BuOx/DecOx and PheOx/DecOx systems in our work).
Future work in this direction should include characterization of aggregation and ordering phenomena to elucidate the changes in the microenvironment (SAXS, SANS, NMR) to complement the existing new computational method for predicting sequential distribution.57 This will offer the tools to design specific polymer architecture including the cross-linkable copolymers. Such topological information coupled with exact statistical branching theory59 will make possible in-depth description of the network structure.
Conflicts of interest
There are no conflicts to declare.Acknowledgements
The authors acknowledge the Czech Science Foundation (grant no. GA18-12925S) for financial support. We also gratefully acknowledge the support of the Czech Academy of Sciences within the programme AV21 Strategy: RP10-Molecules and Materials for Life.References
- S. Kobayashi, Polym. Sci. A Compr. Ref. 10 Vol. Set, 2012, vol. 4, pp. 397–426 Search PubMed.
- R. Hoogenboom, Macromol. Chem. Phys., 2007, 208, 18–25 CrossRef CAS.
- O. Sedlacek, B. D. Monnery, S. K. Filippov, R. Hoogenboom and M. Hruby, Macromol. Rapid Commun., 2012, 33, 1648–1662 CrossRef CAS.
- T. X. Viegas, M. D. Bentley, J. M. Harris, Z. Fang, K. Yoon, B. Dizman, R. Weimer, A. Mero, G. Pasut and F. M. Veronese, Bioconjugate Chem., 2011, 22, 976–986 CrossRef CAS.
- R. Luxenhofer, Y. Han, A. Schulz, J. Tong, Z. He, A. V Kabanov and R. Jordan, Macromol. Rapid Commun., 2012, 33, 1613–1631 CrossRef CAS.
- R. Luxenhofer, Novel Functional Poly (2-oxazoline) s as Potential Carriers for Biomedical Applications, Technische Universitat Munchen, 2007 Search PubMed.
- M. Hruby, S. K. Filippov, J. Panek, M. Novakova, H. Mackova, J. Kucka, D. Vetvicka and K. Ulbrich, Macromol. Biosci., 2010, 10, 916–924 CrossRef CAS.
- L. Loukotová, J. Kučka, M. Rabyk, A. Höcherl, K. Venclíková, O. Janoušková, P. Páral, V. Kolářová, T. Heizer, L. Šefc, P. Štěpánek and M. Hrubý, J. Controlled Release, 2017, 268, 78–91 CrossRef PubMed.
- O. Policianova, J. Brus, M. Hruby and M. Urbanova, Pharm. Dev. Technol., 2015, 20, 935–940 CrossRef CAS PubMed.
- O. Sedláček, P. Černoch, J. Kučka, R. Konefal, P. Štěpánek, M. Vetrík, T. P. Lodge and M. Hrubý, Langmuir, 2016, 32, 6115–6122 CrossRef PubMed.
- A. Kozur, L. Burk, R. Thomann, P. J. Lutz and R. Mülhaupt, Polymer, 2019, 178, 121553 CrossRef CAS.
- T. He, D. Jańczewski, S. Jana, A. Parthiban, S. Guo, X. Zhu, S. S.-C. C. Lee, F. J. Parra-Velandia, S. L.-M. M. Teo and G. J. Vancso, J. Polym. Sci., Part A: Polym. Chem., 2016, 54, 275–283 CrossRef CAS.
- M. Fimberger, I.-A. Tsekmes, R. Kochetov, J. Smit and F. Wiesbrock, Polymers, 2015, 8, 6 CrossRef PubMed.
- R. Hoogenboom, Angew. Chem., Int. Ed., 2009, 48, 7978–7994 CrossRef CAS PubMed.
- M. Glassner, M. Vergaelen and R. Hoogenboom, Polym. Int., 2018, 67, 32–45 CrossRef CAS.
- C. Petit, K. P. Luef, M. Edler, T. Griesser, J. M. Kremsner, A. Stadler, B. Grassl, S. S. Reynaud and F. Wiesbrock, ChemSusChem, 2015, 8, 3401–3404 CrossRef CAS PubMed.
- H. Huang, R. Hoogenboom, M. A. M. Leenen, P. Guillet, A. M. Jonas, U. S. Schubert and J.-F. Gohy, J. Am. Chem. Soc., 2006, 128, 3784–3788 CrossRef CAS.
- K. Xu, Chem. Rev., 2014, 114, 11503–11618 CrossRef CAS.
- B. Verbraeken, B. D. Monnery, K. Lava and R. Hoogenboom, Eur. Polym. J., 2017, 88, 451–469 CrossRef CAS.
- F. Wiesbrock, R. Hoogenboom, M. Leenen, S. F. G. M. van Nispen, M. van der Loop, C. H. Abeln, A. M. J. van den Berg and U. S. Schubert, Macromolecules, 2005, 38, 7957–7966 CrossRef CAS.
- M. Glassner, K. Lava, V. R. de la Rosa and R. Hoogenboom, J. Polym. Sci., Part A: Polym. Chem., 2014, 52, 3118–3122 CrossRef CAS.
- F. Wiesbrock, R. Hoogenboom, M. A. M. M. Leenen, M. A. R. R. Meier and U. S. Schubert, Macromolecules, 2005, 38, 5025–5034 CrossRef CAS.
- S. Huber, N. Hutter and R. Jordan, Colloid Polym. Sci., 2008, 286, 1653–1661 CrossRef CAS.
- M. W. M. M. Fijten, J. M. Kranenburg, H. M. L. L. Thijs, R. M. Paulus, B. M. Van Lankvelt, J. De Hullu, M. Springintveld, D. J. G. G. Thielen, C. A. Tweedie, R. Hoogenboom, K. J. Van Vliet and U. S. Schubert, Macromolecules, 2007, 40, 5879–5886 CrossRef CAS.
- O. Sedlacek, B. D. D. Monnery and R. Hoogenboom, Polym. Chem., 2019, 10, 1286–1290 RSC.
- T. Lorson, M. M. Lübtow, E. Wegener, M. S. Haider, S. Borova, D. Nahm, R. Jordan, M. Sokolski-Papkov, A. V. Kabanov and R. Luxenhofer, Biomaterials, 2018, 178, 204–280 CrossRef CAS.
- B. D. Monnery, V. V. Jerca, O. Sedlacek, B. Verbraeken, R. Cavill and R. Hoogenboom, Angew. Chem., Int. Ed., 2018, 57, 15400–15404 CrossRef CAS PubMed.
- K. Aoi and M. Okada, Prog. Polym. Sci., 1996, 21, 151–208 CrossRef CAS.
- R. Hoogenboom, M. W. M. Fijten, S. Wijnans, A. M. J. van den Berg, H. M. L. Thijs and U. S. Schubert, J. Comb. Chem., 2006, 8, 145–148 CrossRef CAS PubMed.
- S. Kobayashi, H. Uyama, Y. Narita and J. ichi Ishiyama, Macromolecules, 1992, 25, 3232–3236 CrossRef CAS.
- R. Hoogenboom, H. M. L. M. L. Thijs, M. J. H. C. J. H. C. Jochems, B. M. M. van Lankvelt, M. W. M. W. M. Fijten and U. S. S. Schubert, Chem. Commun., 2008, 5758 RSC.
- R. Luxenhofer, A. Schulz, C. Roques, S. Li, T. K. Bronich, E. V. Batrakova, R. Jordan and A. V. Kabanov, Biomaterials, 2010, 31, 4972–4979 CrossRef CAS PubMed.
- M. M. Bloksma, C. Weber, I. Y. Perevyazko, A. Kuse, A. Baumgärtel, A. Vollrath, R. Hoogenboom and U. S. Schubert, Macromolecules, 2011, 44, 4057–4064 CrossRef CAS.
- O. Sedlacek, B. D. Monnery, J. Mattova, J. Kucka, J. Panek, O. Janouskova, A. Hocherl, B. Verbraeken, M. Vergaelen, M. Zadinova, R. Hoogenboom and M. Hruby, Biomaterials, 2017, 146, 1–12 CrossRef CAS.
- O. Sedlacek, O. Janouskova, B. Verbraeken and R. Hoogenboom, Biomacromolecules, 2019, 20, 222–230 CrossRef CAS PubMed.
- A. Dworak, B. Trzebicka, A. Kowalczuk, C. Tsvetanov and S. Rangelov, Polimery, 2014, 59, 88–94 CrossRef CAS.
- S. Sinnwell and H. Ritter, Macromol. Rapid Commun., 2005, 26, 160–163 CrossRef CAS.
- K. Kempe, M. Lobert, R. Hoogenboom and U. S. Schubert, J. Polym. Sci., Part A: Polym. Chem., 2009, 47, 3829–3838 CrossRef CAS.
- A. Makino and S. Kobayashi, J. Polym. Sci., Part A: Polym. Chem., 2010, 48, 1251–1270 CrossRef CAS.
- F. Wiesbrock, R. Hoogenboom, C. H. Abeln and U. S. Schubert, Macromol. Rapid Commun., 2004, 25, 1895–1899 CrossRef CAS.
- U. U. Ozkose, C. Altinkok, O. Yilmaz, O. Alpturk and M. A. Tasdelen, Eur. Polym. J., 2017, 88, 586–593 CrossRef CAS.
- J.-S. S. Park, Y. Akiyama, F. M. Winnik and K. Kataoka, Macromolecules, 2004, 37, 6786–6792 CrossRef CAS.
- J. Niu, Z. A. Page, N. D. Dolinski, A. Anastasaki, A. T. Hsueh, H. T. Soh and C. J. Hawker, ACS Macro Lett., 2017, 6, 1109–1113 CrossRef CAS.
- V. Najafi, F. Ziaee, K. Kabiri, M. J. Z. Mehr, H. Abdollahi, P. M. Nezhad, S. M. Jalilian and A. Nouri, Iran. Polym. J., 2012, 21, 683–688 CrossRef CAS.
- F. Ding, S. Monsaert, R. Drozdzak, I. Dragutan, V. Dragutan, Y. Sun, E. Gao, P. Van Der Voort and F. Verpoort, Vib. Spectrosc., 2009, 51, 147–151 CrossRef CAS.
- C. Zhang, R. J. P. Sanchez, C. Fu, R. Clayden-Zabik, H. Peng, K. Kempe and A. K. Whittaker, Biomacromolecules, 2019, 20, 365–374 CrossRef CAS PubMed.
- H.-J. Krause and P. Neumann, Process for the preparation of 2-alkyl- and 2-alkenyl- oxazolines, EP0315856A1, 1988.
- Y. Seo, A. Schulz, Y. Han, Z. He, H. Bludau, X. Wan, J. Tong, T. K. Bronich, M. Sokolsky, R. Luxenhofer, R. Jordan and A. V. Kabanov, Polym. Adv. Technol., 2015, 26, 837–850 CrossRef CAS.
- M. Meyer and H. Schlaad, Macromolecules, 2006, 39, 3967–3970 CrossRef CAS.
- E. Rossegger, V. Schenk and F. Wiesbrock, Polymers, 2013, 5, 956–1011 CrossRef.
- O. Celebi, S. R. Barnes, G. S. Narang, D. Kellogg, S. J. Mecham and J. S. Riffle, Polymer, 2015, 56, 147–156 CrossRef CAS.
- R. Hoogenboom, M. W. M. Fijten, H. M. L. Thijs, B. M. Van Lankvelt and U. S. Schubert, Des. Monomers Polym., 2005, 8, 659–671 CrossRef CAS.
- M. Litt, A. Levy and J. Herz, J. Macromol. Sci., Part A: Chem., 1975, 9, 703–727 CrossRef.
- D. S. Stephenson and G. Binsch, J. Magn. Reson., 1978, 32, 145–152 CAS.
- D. Bera, O. Sedlacek, E. Jager, E. Pavlova, M. Vergaelen and R. Hoogenboom, Polym. Chem., 2019, 10, 5116–5123 RSC.
- J.-S. S. Park and K. Kataoka, Macromolecules, 2007, 40, 3599–3609 CrossRef CAS.
- P. H. M. M. Van Steenberge, O. Sedlacek, J. C. Hernández-Ortiz, B. Verbraeken, M.-F. Reyniers, R. Hoogenboom and D. R. D'hooge, Nat. Commun., 2019, 10, 3641 CrossRef PubMed.
- P. H. M. M. Van Steenberge, B. Verbraeken, M.-F. F. Reyniers, R. Hoogenboom, D. R. D'Hooge and D. R. D'hooge, Macromolecules, 2015, 48, 7765–7773 CrossRef CAS.
- K. Dušek and M. Dušková-Smrčková, Macromol. React. Eng., 2012, 6, 426–445 CrossRef.
Footnote |
| † Electronic supplementary information (ESI) available. See DOI: 10.1039/d1ra01509e |
| This journal is © The Royal Society of Chemistry 2021 |

