DOI:
10.1039/D1RA01477C
(Paper)
RSC Adv., 2021,
11, 14596-14606
Tunable LSPR of silver/gold bimetallic nanoframes and their SERS activity for methyl red detection
Received
23rd February 2021
, Accepted 12th April 2021
First published on 20th April 2021
Abstract
Ag/Au bimetallic nanostructures have received much attention in surface-enhanced Raman scattering (SERS). However, the synthesis of this nanostructure type still remains a challenge. In the present research, Ag/Au nanoframes were synthesized via a simple room temperature solution phase chemical reduction method using pre-synthesized triangular Ag nanoplates as templates in the presence of appropriate amounts of HAuCl4. Controlling experimental parameters was applied for understanding of the growth mechanism. The galvanic exchange reaction resulted in a uniform deposition of the Au shell on the Ag nanoplates and the Ag core was removed which generated triangular hollow nanoframes. It is found that the amount of HAuCl4 added to the growth solution played a key role in controlling the Ag/Au nanoframes. The resultant silver/gold nanoframes with average size of 50 nm were applied in detecting methyl red (MR) in the solution-phase using an excitation wavelength laser of 532 nm. The SERS signal was greatly enhanced owing to the tunable plasmonic peaks in the visible region (400–650 nm). The limit of detection (LOD) of MR in diluted solution was 10−6 M. The enhancement factor (EF) was about 8 × 10⁴ toward 10−5 M of MR. Interestingly, the linear dependence between the logarithm of the SERS signal intensity (log![[thin space (1/6-em)]](https://www.rsc.org/images/entities/char_2009.gif) I) and the logarithm of the MR concentration (logC) occurred in the range from 10−6 to 10−4 M. Our work promises the application of Ag/Au nanoframes as a chemical sensor in detecting MR molecules at low concentration with high performance.
I) and the logarithm of the MR concentration (logC) occurred in the range from 10−6 to 10−4 M. Our work promises the application of Ag/Au nanoframes as a chemical sensor in detecting MR molecules at low concentration with high performance.
1. Introduction
Nowadays, bimetallic nanostructures with nanoplate or nanoframe shapes possess large surface areas which generate new active components, so they support a high fraction of active surface site which facilitates chemical reactions. Accordingly, they have emerged as functional nanomaterials in various applications such as catalysis,1 plasmonics,2 chemical sensors,3,4 surface-enhanced Raman scattering (SERS)5–8 and biomedicine.9 SERS has been proven as the most promising readout method with high detection sensitivity, nondestructive data acquisition and spectroscopic fingerprints.10 Various kinds of SERS substrates have been designed, such as Au@Ag core–shell nanorods, gold nanorods, Ag/Au nanospheres, Ag–Au hollow nanocubes, Au–Cu nanorods, and so on.10–14 In the SERS imaging technique, SERS substrates are responsible for the generation of an optical signal and typically consist of noble metallic nanoparticles and specific Raman reporter molecules coated on a materials surface for producing characteristic scattering signals.12 Nanoplate or nanoframe structures can enhance electromagnetic field due to their localized surface plasmon resonance (LSPR) properties, which can improve the sensitivity of the SERS signal.15 The limitation of Ag use in practical applications results from the easy oxidation in ambient condition. In contrast, Au is chemically stable material, but its Raman signal-enhancing ability is more than 10-fold lower than that of similar silver nanostructures, so the combining Ag and Au can give novel properties.3,16 Precisely manipulating two components can maximize their synergetic effect. Many different morphologies of gold/silver bimetallic nanostructures have been prepared to date, containing core–shell nanoplates,7 core–shell nanoparticles,5 triangular Ag@Au alloy nanoplates,17,18 spherical Au–Ag alloy nanoparticles,19 Au@Ag core–shell nanorod,10 Au nanorods@Ag nanospheres,12 etc. Substantial research efforts have been directed toward the design of bimetallic Ag/Au nanostructures through several preparation methods such as galvanic exchange reaction,7 plasmon-driven synthesis,20 epitaxial growth,2 laser ablation,21 etc. These approaches have created core–shell and alloy nanostructures, however, generating well-defined hollow nanoframes with desired size and shape is still a challenge. Gold triangular nanoframes were prepared by etching Au coated Ag nanoprisms using hydrogen peroxide (H2O2).22 AgAu nanocages were obtained from Ag nanospheres through nanoscale galvanic exchange process with HAuCl4.23 Ag/Au core–shell was obtained from Ag nanowires as template using Au ion additives.24 The hollow Au nanoframes were synthesized by the self-template method, where Au nanoplates were directly etched using Br− ions.25 Ag, Au or Ag/Au bimetallic nanostructures have been exploited to detect various substances, such as crystal violet (CV),7,26 methylene blue (MB),17,21,26–28 rhodamine 6G (R6G),25 methyl red (MR),29 and so on using SERS phenomenon. In SERS-based chemical sensors, the analytic molecules are adsorbed in the vicinity of nanocrystals, or on the surface of noble metal via electrostatic adsorption or via strong noncovalent interaction. This platform provides highly-accessible hotspots to enhance SERS efficiently. To the best of our knowledge, Ag/Au nanoframes used for detecting MR has not been reported yet.
In the present work, bimetallic Ag/Au nanoframes were prepared through the seed-mediated solution-phase route based on the galvanic replacement reaction between the Ag seeds and Au precursor in a well-controlled fashion at room temperature. The gold salt (HAuCl4) was used to etch the [111] facets selectively of the triangular silver nanoplates and generate triangular silver/gold nanoframes. The size of hollow interior gap of bimetallic nanoframes was readily tuned by using different amounts of HAuCl4. These nanoframes were successfully employed in detecting methyl red (MR). The results showed remarkably enhanced SERS activity for Ag/Au nanoframes compared to the Ag nanoplates because of the hot spots formed at nanogaps inside nanoframes. This nanomaterial can detect ultrasensitively methyl red (MR) at low concentration.
2. Experimental section
2.1. Chemicals and materials
Silver nitrate (AgNO3, 99.98%), tetrachloroauric(III) acid (also called hydrogen tetrachloride aurate(III), HAuCl4·3H2O, 99.9%), L-ascorbic acid (L-AA, C6H8O6, 99.96%), polyvinyl pyrrolidone (PVP) with an average molecular molar weight of 29000 g mol−1, sodium hydroxide (NaOH, 99%), trisodium citrate dihydrate (TSC, Na3C6H5O7·2H2O, 99%), sodium borohydride (NaBH4, 99%), methyl red (MR, C15H15N3O2, 95.6%) were all purchased from Merck firm (Germany). All reagents mentioned above were used as received without any treatment. Deionized water was used in all of the experiments, from cleaning glassware to making the solutions.
2.2. Preparation of triangular Ag nanoplates
The triangular Ag nanoplates were synthesized by using the seed-mediated growth method reported previously.30 In a typical synthesis, 1 ml of 0.01 M silver nitrate (AgNO3) solution, 0.3 ml of PVP solution (0.0067 M) and 0.2 ml of 0.3 M trisodium citrate (TSC, Na3C6H5O7) solution were mixed together and combined with deionized water to the total volume of the reaction solution of 100 ml under vigorous magnetic stirring for 10 min under ice cold condition. The freshly made NaBH4 aqueous solution was ice bathed before use. Next, 0.5 ml of 0.05 M ice cold aqueous NaBH4 solution was added dropwise into the reaction mixture under continuously stirring to initiate the reduction. The colour change of the reaction solution was observed in the sequential order, from colourless to light-yellow and yellow within 3 min of reaction, suggesting the formation of silver hydrosol due to Ag+ ions reduction. The resultant solution was placed in water bath at 60 °C for 10 min to decompose excess NaBH4 present in the solution. The resulting bright yellow Ag colloid solution was aged at room temperature for 2 h before using as the seeds for the photochemical reaction. 20 ml of colloidal suspension was poured into a glass tube and subsequently irradiated by green light emitting diode (green LED) with wavelength centered at 520 nm and output power of 0.5 mW cm−2 for duration of 55 min to obtain triangular Ag nanoplates. After illumination of LED, the colour changes from bright yellow to moss green within 30 min and finally dark blue, illustrating the silver nanoplates are formed rapidly. Upon illumination of LED, Ag nanoparticles support localized surface plasmon resonance (LSPR) which creates intense localized electric field, enhancing light–molecule interaction at the nanoparticle surface. The collective oscillation of electrons at the surface depends on the size, geometry and material of nanoparticle.1
2.3. Preparation of Ag/Au nanoframes
Silver/gold nanoframes (Ag/Au Frs) were prepared according to a reported method with some minor modification,31 using silver nanoplates as the template, L-AA as a reducing agent and PVP as a capping agent. In a typical synthesis procedure, 0.15 ml 10 mM L-AA solution in 13 ml deionized water was added to 2 ml as-prepared triangular silver nanoplates colloidal solution in a 20 ml glass vial. Then, a certain amount of 0.2 M HNO3 was added to the reaction solution under magnetic stirring at room temperature to adjust the pH value to 4. The Au shells were deposited onto the triangular Ag nanoplates by injecting the aqueous HAuCl4 at a rate of 10 μl per droplet, and the mixture was vigorously stirred for 1 h to ensure complete oxidization of gold precursor. The HAuCl4 amounts of the stock solution used in the reaction were 0.2, 0.6, 0.65, 0.75, 0.8, and 0.9 μmol corresponding to 6 desired products. The Ag/Au nanoframe samples were denoted as Table 1 below. After that, the final products were collected by filtration and washed several times with deionized water.
Table 1 Symbols of Ag/Au nanoframes prepared from different amounts of HAuCl4 precursor
| Symbol of Ag/Au nanoframes |
HAuCl4 amount (μmol) |
| Ag/Au Fr1 |
0.2 |
| Ag/Au Fr2 |
0.6 |
| Ag/Au Fr3 |
0.65 |
| Ag/Au Fr4 |
0.75 |
| Ag/Au Fr5 |
0.8 |
| Ag/Au Fr6 |
0.9 |
2.4. Materials characterization
The morphological properties of the as-prepared nanostructures were analyzed by JEOL JEM-1010 (Japan) transmission electron microscope (TEM) operating at 80 kV and Hitachi S4800 (Japan) scanning electron microscope (SEM) operating at 10 kV. A X-ray energy dispersive spectrometer (EDS, Nova 450) was used to determine the elemental composition in the nanostructures. X-ray diffraction (XRD) patterns were recorded between scan angles 30° and 80° on an X-ray diffractometer (Bruker D8 Advance, Germany) operated at 30 kV using Cu-Kα line λ = 0.154056 nm to confirm the crystalline nature and phase of the samples. A few drops of the sample suspensions were placed either on carbon film coated copper grids for TEM, on silicon wafer for SEM and on glass slide for XRD, then letting dry in air at room temperature. Ultraviolet-visible-near infrared (UV-Vis-NIR) absorption spectra were recorded on a Jasco V770 spectrophotometer in the range of 300–1100 nm. The size distribution of Ag seeds in the medium was evaluated by particle size analyzer (PSA, Delta Nano C, Beckman) using the dynamic light scattering (DLS) technique. X-ray photoelectron spectroscopy (XPS) was performed on 09A2 U5 spectrometer at the National Synchrotron Radiation Research Center (NSRSC, Taiwan). The samples were prepared in powder and covered on the silicon wafer before XPS measurement. Fourier transform infrared spectroscopy (FTIR) was obtained with a PerkinElmer spectrophotometer. The samples were thoroughly mixed with KBr before forming a pellet at high pressure.
In SERS measurements, methyl red (MR) dye with the concentration in the range of 10−6 to 10−4 M was used as probing molecules. 50 μl Ag/Au nanoframes colloid (0.6 mg ml−1) was incubated with 10 μl of MR at various desired concentrations for 30 min. Then the solution was deposited onto an 1 cm2 silicon substrate and dried at room temperature to evaporate the solvent of the mixture. SERS measurements were performed via Raman microscope (Horiba XploRA Plus spectrometer, France) equipped with a solid state excitation laser source (Nd:YAG) of 532 nm in wavelength. The laser beam of 4 μm in diameter was focused on the silicon substrate. The power of laser was set at 3.2 mW, and a signal accumulation time was kept at 8 s for all experiments. Five SERS spectra were collected at different locations for repeat SERS measurement then averaged them to reduce random errors. The spectra were measured in the range from 300 to 2000 cm−1.
3. Results and discussion
3.1. Synthesis of Ag/Au nanoframes and growth stage
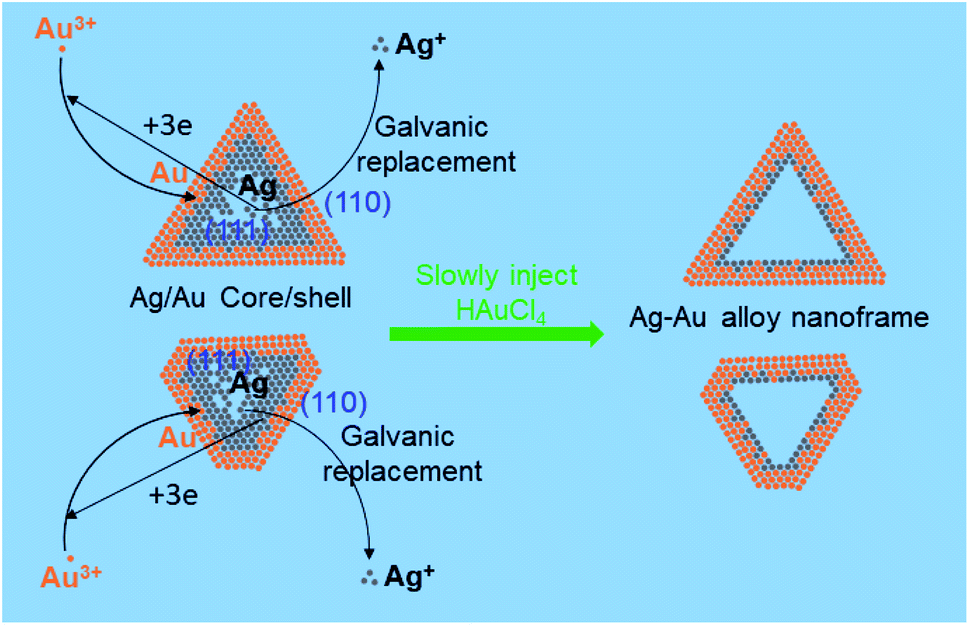
Fig. 1 shows the steps involved in the formation of Ag/Au nanoframes prepared via a galvanic replacement reaction. In the first step, Ag nanoplates were employed as the template for the controlled deposition of Au. In the deposition process, HAuCl4 was reduced with L-AA to form Au atoms which are preferentially deposited at the edges or tips of the triangular Ag nanoplates, Au atoms were coated on the (110) side-facets where the coordination number is low and the surface energy is high.32 The deposited Au atoms at the edges of the Ag nanoplates formed Ag–Au core–shell nanoplates. In the second step, the silver cores were selectively etched at (111) facet in a face-centered-cubic lattice via galvanic exchange between Ag and Au3+. The reduction potential of AuCl4−/Au is 1.498 V, higher than that of Ag+/Ag as 0.779 V,33,34 resulting in the formation of a galvanic cell with Au as positive electrode and Ag nanoplates as negative electrode. Ag atoms are oxidized by Au3+ as following reactions:| | |
HAuCl4(aq) → H+(aq) + AuCl4−(aq)
| (1) |
| | |
3Ag(s) − 3e → 3Ag+(aq)
| (2) |
| | |
AuCl4−(aq) + 3e → Au(s) + 4Cl−(aq)
| (3) |
| | |
3Ag+(aq) + 3Cl−(aq) → 3AgCl(s)
| (4) |
Combining eqn (1)–(4) gives the reaction:| | |
3Ag(s) + HAuCl4(aq) → 3AgCl(s) + Au(s) + HCl(aq)
| (5) |
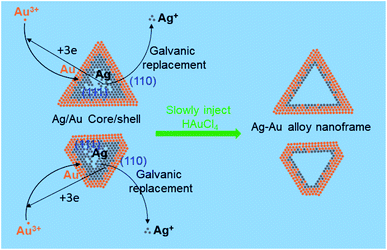 |
| | Fig. 1 Schematic illustration of the synthetic steps for the preparation of Ag/Au nanoframes. | |
This reaction is stoichiometric, where one Au atom can replace three Ag atoms, thus Ag is consumed faster than the deposition of Au which leads to create hole in the middle of the silver nanoplates, and finally form Au frame-like nanostructures. During this stage, the galvanic replacement reaction is dominant compared to reduction of Au3+ by L-AA because the reduction power of L-AA is suppressed at low pH.35 Ag+ and Cl− ions released in the galvanic reaction at the same time rapidly precipitated as AgCl, which grew on the triangular Ag seeds and served as secondary template for deposition of Au atoms. The silver core size is reducible by adding more HAuCl4 to the reaction mixture.
3.2. Characterization of Ag/Au nanoframes
In order to comprehend the growth mechanism of the Ag/Au nanoframes, TEM was used to monitor the morphology evolution of the nanostructures from silver nuclei to nanoplates and nanoframes at various stages during the growth reaction. Fig. 2a shows the TEM image of the initial silver seeds synthesized by reduction of silver nitrate with sodium borohydride in the presence of PVP as a surface ligand. The resulting particles were nearly spherical with the average diameter of about 9 nm. The yellow colour of as-prepared colloid at the initial stage was indicated by the left-bottom inset in Fig. 2a. The right-top inset in Fig. 2a shows the histogram of the size distribution of the Ag seeds by DLS technique, which reveals that AgNPs obtained are monodispersed in nature, with average diameter ∼9 nm. DLS method measured the hydrodynamic diameter of NPs, thus illustrating a larger size than that from TEM characterization. Fig. 2b shows the size and morphology of the as-synthesized silver nanoplates produced by seed-mediated growth approach in aqueous solvent under excitation of green LED for 50 min. The morphology of silver nanoplates is a mixture of triangle and truncated triangle with 8 nm in thickness and average edge length of 50 nm. The colour of solution changed from bright yellow to blue as shown in inset of Fig. 2b.
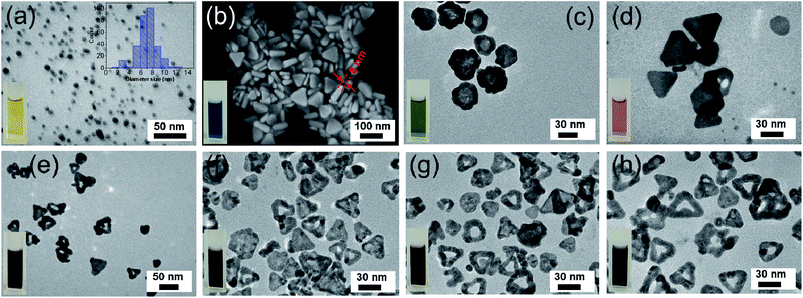 |
| | Fig. 2 (a) TEM image of Ag seeds, inset as histogram of size distribution, (b) SEM image of Ag nanoplates; and TEM images of Ag/Au nanoframes prepared with different amounts of HAuCl4 (c) Ag/Au Fr1, (d) Ag/Au Fr2, (e) Ag/Au Fr3, (f) Ag/Au Fr4, (g) Ag/Au Fr5, (h) Ag/Au Fr6. | |
The Ag nanoplates were coated with Au shells through the redox reaction using HAuCl4 as a gold source in HNO3. When the amount of HAuCl4 precursor is low (0.2 μmol), the product is the triangular Ag core–Au shell nanostructure (Ag/Au Fr1), where Ag atoms in the core and Au atoms located around the edge of the Ag nanoplate template. The TEM image in Fig. 2c unambiguously confirms the contrast between the Ag core and Au shell. The triangular shape of Ag nanoplates was maintained due to the chemical stability provided by the deposited Au atoms at the edges which resist the etching events by oxidative dissolution. PVP served as the capping agent which favored rapid growth of Au on the side facets of the Ag nanoplates while suppressed the growth of Au on the corner, resulting in the truncated triangular ones. The colloidal solution colour changed to moss green as the inset of Fig. 2c. When the amount of HAuCl4 increased to 0.6 μmol (Ag/Au Fr2), 0.65 μmol (Ag/Au Fr3), 0.75 μmol (Ag/Au Fr4), 0.8 μmol (Ag/Au Fr5), and 0.9 μmol (Ag/Au Fr6), the morphology of the products changed from solid nanoplates to hollow nanoframes, the hollow part gradually widened and the colour of the colloidal solution transformed to light pink, purple, deep purple and dark purple (photographs inset in Fig. 2d–h). When the HAuCl4 amount was 0.8 μmol, most of the triangular silver nanoplates are completely converted into hollow Ag/Au nanoframes with an average diameter of 20 nm and the rough surface (Fig. 2g). The thickness of the nanoframes with different amounts of HAuCl4 is almost the same (∼8 nm). Excess amount of HAuCl4 (0.9 μmol) leaded to the complete removal of the silver core, the size of the frame and the hollow inner part no longer changed. According to our experimental results, the suitable HAuCl4 amount is 0.8 μmol to synthesize Ag/Au nanoframes. The resulted products were stable in water for more than one year.
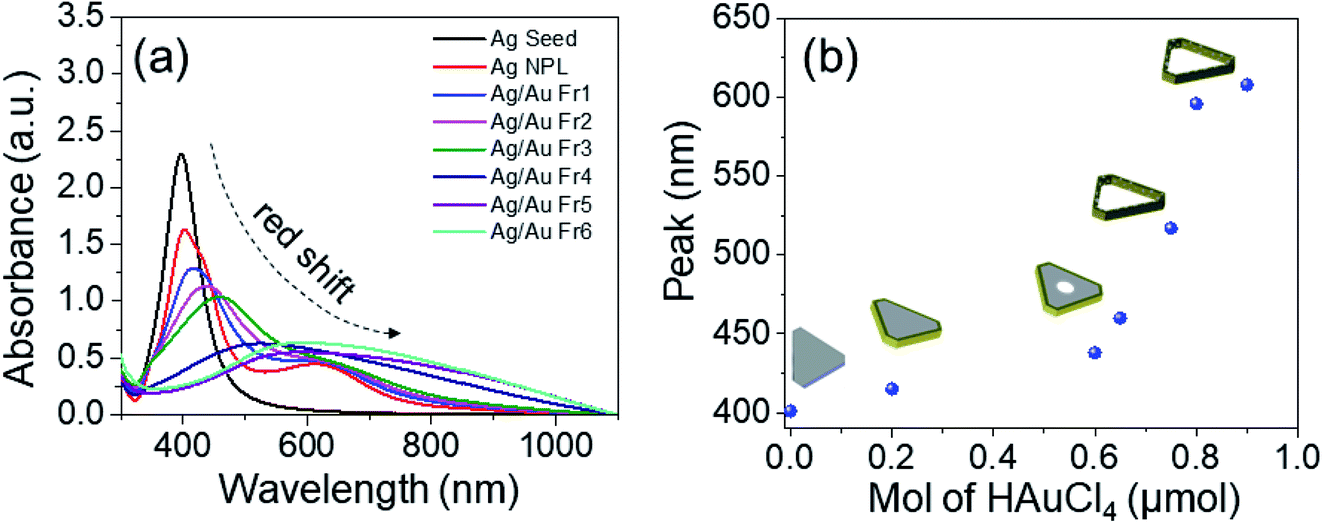
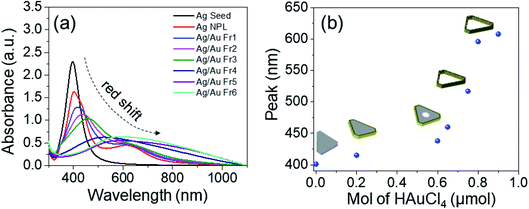
The UV-Vis absorption spectra were recorded at a wavelength range of 300–1100 nm to study the optical properties of the as-prepared Ag/Au nanoframes. Fig. 3a shows the UV-Vis spectra of the original Ag seeds, Ag triangular nanoplates and Ag/Au nanoframes with various HAuCl4 amounts. A single, strong and narrow surface plasmon resonance (SPR) peak of Ag seeds sample located around 400 nm (black line in Fig. 3a) confirmed the synthesis of AgNPs. This peak could be attributed to spherical nanoparticles.36 The UV-Vis spectrum of Ag nanoplates exhibits two LSPR bands located at 405 nm and 650 nm corresponding to out-of-plane and in-plane dipolar resonance mode.30 The absorbance in the original 400 nm peak decreased with a bathochromic shift to a longer wavelength and broadened after green LED irradiation. The UV-Vis extinctions of Ag/Au nanoframes appear at 420–620 nm. Intermetallic effect between these two metals leads to optical behavior distinct from that of pure silver. The UV-Vis spectrum red-shifted, lost intensity and broadened in spectral shape. The out-of-plane dipolar LSPR band of Ag/Au Fr1, Ag/Au Fr2 and Ag/Au Fr3 samples red-shifted from 410 nm to 465 nm as the hollow core diameter increased, while the in-plane dipolar LSPR band almost unchanged. The UV-Vis spectra of Ag/Au Fr4, Ag/Au Fr5 and Ag/Au Fr6 exhibits only one broad band and the peak maximum gradually shifted to longer wavelength, from 517 to 641 nm. The probability of interband transition in catalytic metal dampens the LSPR at all frequencies, making it spectrally broad and lower in intensity, i.e. it has wider plasmon peak than its monometallic counterpart (Ag nanoplates).1 This nanostructure atomically mixed Ag and Au metals with random distribution of the two atoms, also known as a solid solution. The size of hollow center of Ag/Au nanoplates increases with HAuCl4 amount, which is in good agreement with previous report.37
 |
| | Fig. 3 (a) The UV-Vis spectra of Ag seeds, Ag nanoplates, Ag/Au nanoframes; (b) LSPR peak position as a function of HAuCl4 amount. | |
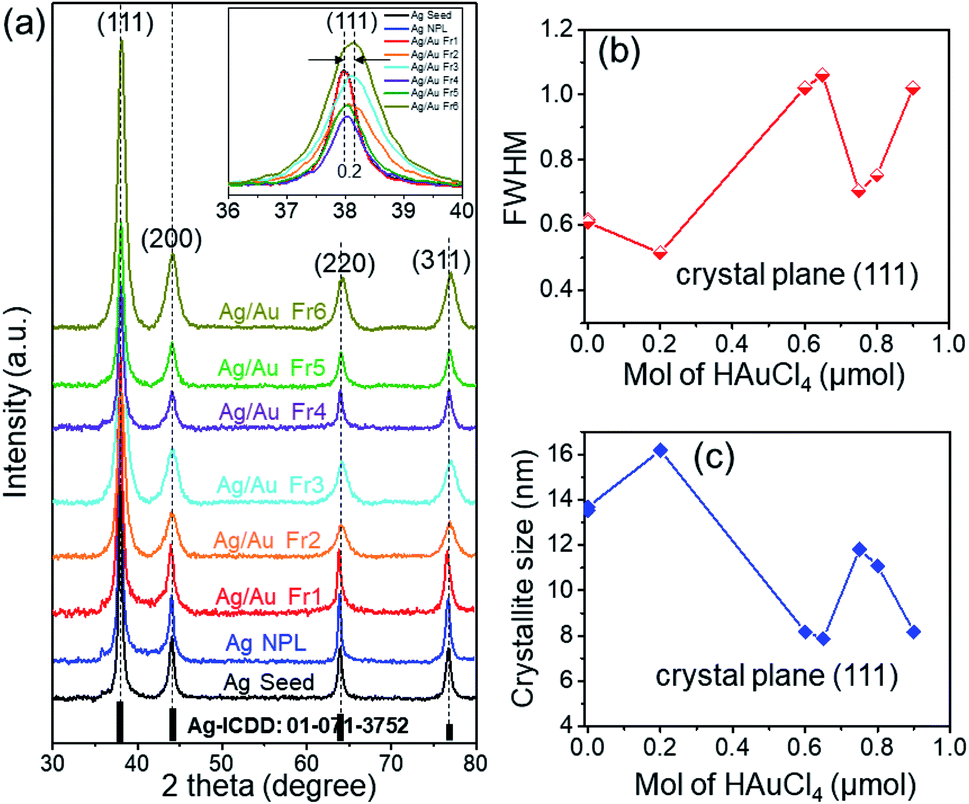
Fig. 3b presents the dependence of LSPR peak position of Ag/Au nanoframes on the HAuCl4 amount, these peaks red-shifted from 410 nm to 600 nm as gold precursor amount increased from 0.2 to 0.9 μmol. After Ag/Au nanoframe formation, the large variation in the collective oscillations of the surface free electrons results in this shift of the UV-Vis band. The SPR peak shifts insignificantly in the high amount of HAuCl4 because Ag is etched almost completely. The crystalline nature of products was confirmed by X-ray crystallography. The diffracted intensities were recorded from 30° to 80°. X-ray diffraction (XRD) pattern in Fig. 4a exhibits a common pattern of silver with the face centered cubic (FCC) structure. Four strong Bragg reflections located at 2θ angles of 38.02°, 44.07°, 64° and 76.7° correspond to {111}, {200}, {220} and {311} diffractive planes of silver, respectively, which is consistent with the standard data file ICDD no. 01-071-3752. The intensity of (111) diffraction peak is 3.4 times higher than those of other peaks, which indicated that the silver strongly crystallized along [111] direction.38 The products are single crystals with {111} facets as the basal planes (the top and bottom surfaces). Fig. 4b shows a typical full-width at half maximum (FWHM) of (111) diffraction peak as a function of HAuCl4 amount. The added amount of HAuCl4 affected on crystallization and crystal size of the product. The average crystalline size was evaluated using Debye–Scherrer formula:36
| |
 | (6) |
where
k = 0.893 is the Scherrer constant or geometric factor,
λ = 0.154056 nm is the wavelength of X-ray radiation source,
β is the angular FWHM of the XRD peak (rad) and
θ is the diffraction angle of the corresponding peak. The crystalline sizes of Ag nanoplates, Ag/Au Fr1, Ag/Au Fr2, Ag/Au Fr3, Ag/Au Fr4, Ag/Au Fr5, Ag/Au Fr6 samples are 13.9 nm, 16.17 nm, 8.16 nm, 7.68 nm, 11.82 nm, 11.07 nm, and 8.17 nm, respectively (
Fig. 4c).
 |
| | Fig. 4 (a) XRD patterns of Ag seeds, Ag nanoplates and Ag/Au nanoframes samples, the inset is the enlarged (111) peak of all samples, (b) FWHM of (111) peak and (c) crystalline size as a function of HAuCl4 amount. | |
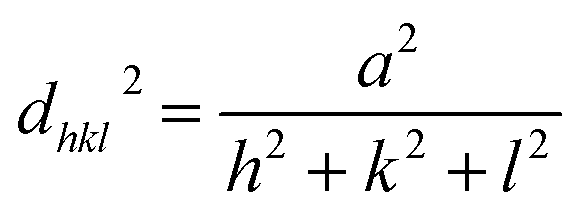
The crystalline feature of Ag nanoplates was explored by high-resolution transmission electron microscopy (HRTEM). The HRTEM image in Fig. 5b shows the high degree of crystallinity proved by the distinct lattice fringes over an extensive area. All the surfaces in the HRTEM image in Fig. 5b can be assigned to the crystal (111) faces, implying a good single-crystal characteristic of Ag nanoplates. The lattice constant (a) was calculated from d-spacing of d111 = 0.234 nm (lattice distance corresponding to [111] direction) following the equation:
| |
 | (7) |
The cell parameter is
a = 0.405 nm in agreement with the literature value.
39 Compositional analysis by energy dispersive X-ray spectroscopy (EDS) of Ag nanoplates shown in
Fig. 5c reveals strong signal approximately at 3 keV for silver along with weak peaks for carbon, sodium and chlorine elements which may originate from precursor in the preparation process of Ag nanoplates. There were no peaks observed for silver compounds, which confirms the complete reduction of silver compounds to AgNPs. These results indicate the purity of Ag nanoplates.
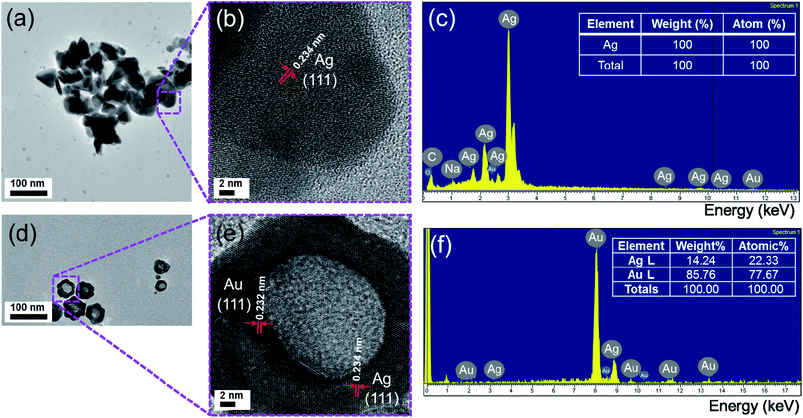 |
| | Fig. 5 (a) TEM, (b) HRTEM images and (c) EDS spectrum of Ag nanoplates; (d) TEM, (e) HRTEM images and (f) EDS spectrum of Ag/Au Fr5 nanoframes. | |
HRTEM image of Ag/Au Fr5 in Fig. 5e gives the {111} lattice plane separation as 0.232 nm and corresponding lattice constant as 0.401 nm. The elemental composition variation of the products after galvanic replacement reaction was characterized by energy-dispersive X-ray spectra (EDS). As shown in Fig. 5f, the silver–gold content (atom percentage) ratio of Ag/Ag Fr5 was 22:78, confirming the occurrence of galvanic replacement reaction. The high mole percentage of Au may play a lead role in the stability of nanoframes.
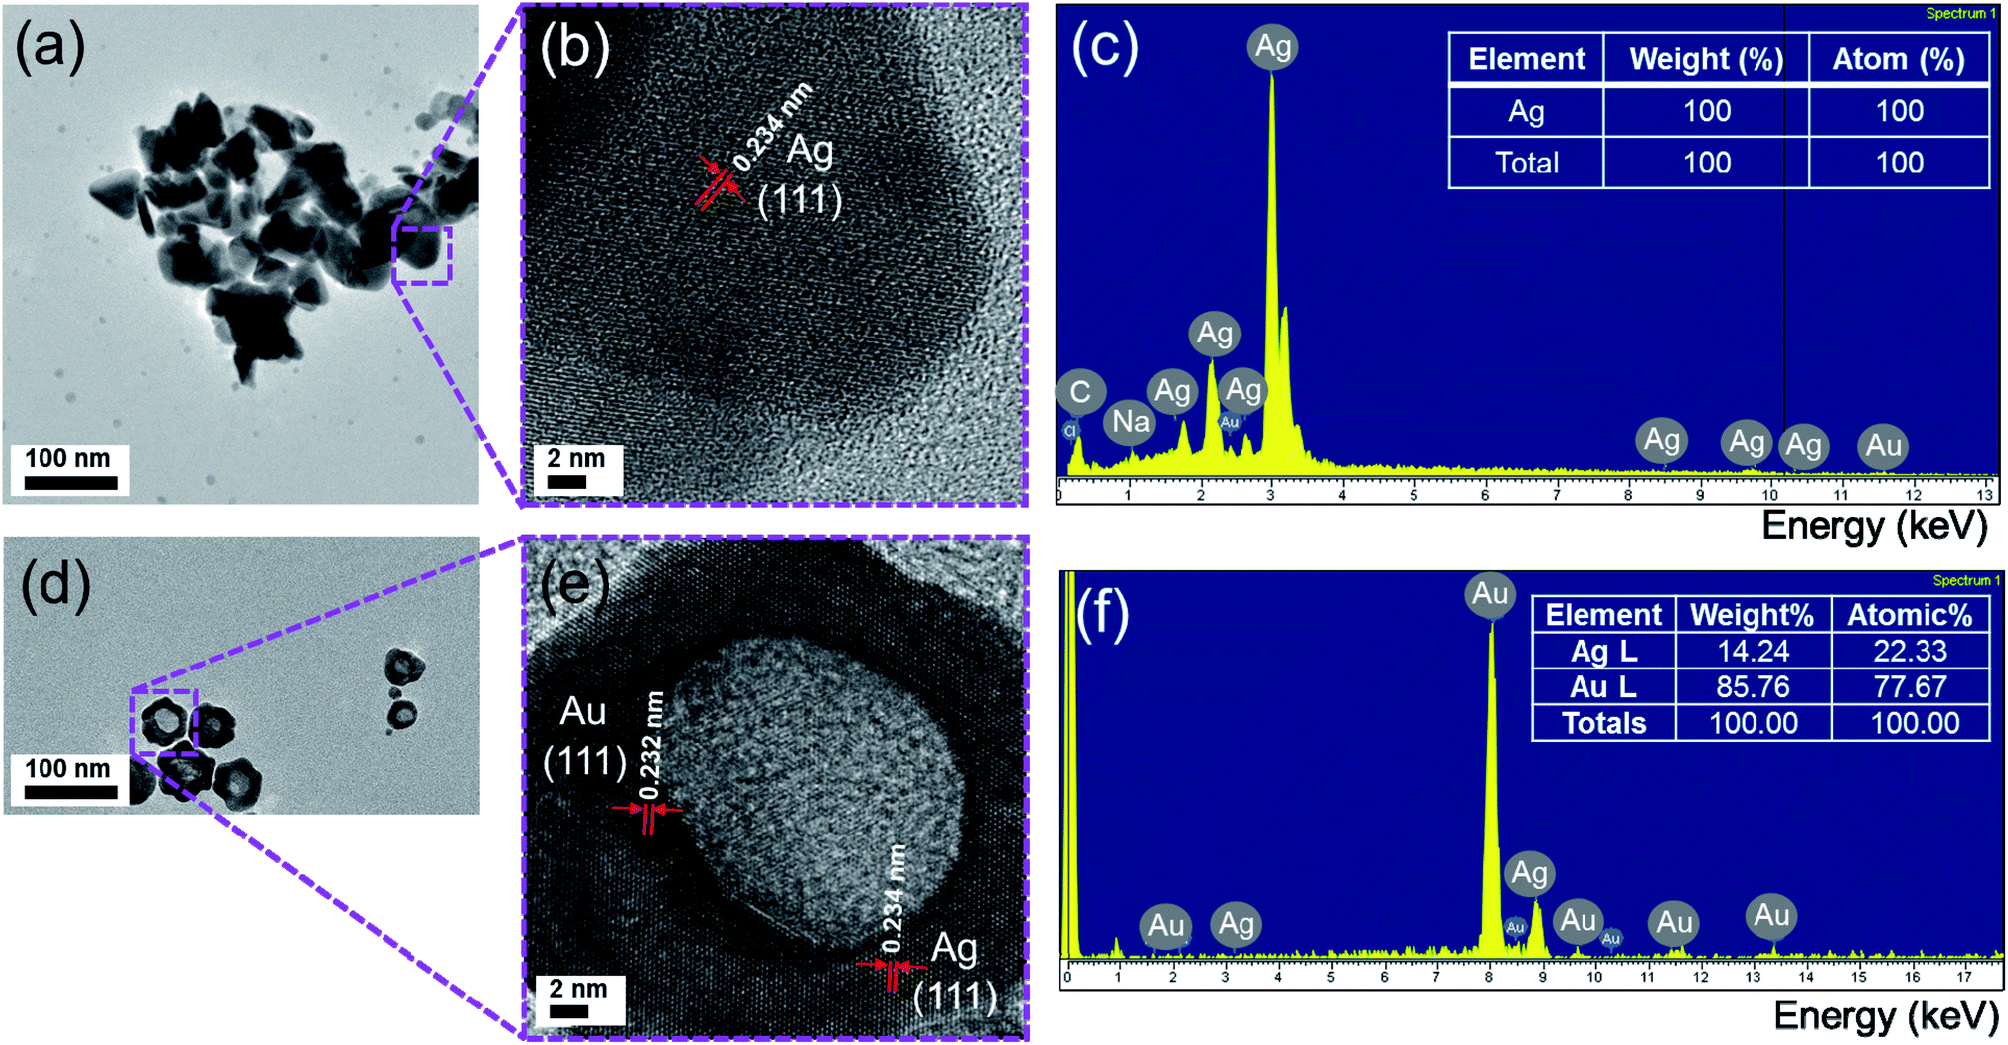
The Ag/Au Fr5 was obtained by the growth of Au on Ag nanoplates with the size of synthetic triangle of about 50 nm (Fig. 6a). The TEM image of an individual nanoplate in Fig. 6a displays a bright triangular zone in the center enclosed by a gray zone on the edge, which can be attributed to the void and Ag/Au nanoframe, respectively. It is clear from the contrast of the image between its edge and inside part that Au frame has been formed on the Ag nanoplate and its void can be observed suggesting the presence of galvanic replacement and oxidation etching. The elemental distribution of the synthesized Ag/Au bimetallic nanoframe structure was identified by energy dispersive X-ray (EDX) spectroscopy elemental mapping technique in Fig. 6b–d.
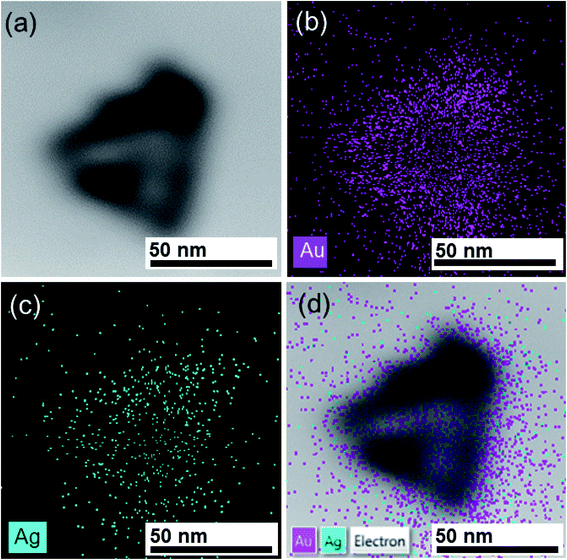 |
| | Fig. 6 (a) TEM image and corresponding EDX-elemental mapping images of (b) Au, (c) Ag, (d) an overlay of Au and Ag. | |
In EDX, each element has a unique atomic structure, so the interaction of a highly energetic electron beam with the sample produced a unique set of X-ray emission peaks.28 EDX mapping conducted on a single particle indicates the presence of Au elements in red colour (Fig. 6b) and Ag elements in green colour (Fig. 6c), which reveals that the edge of the Ag/Au nanoframe are composed of bimetallic Ag/Au (Fig. 6d). Thus, the EDX mapping results confirmed the formation of Ag/Au bimetallic structure.
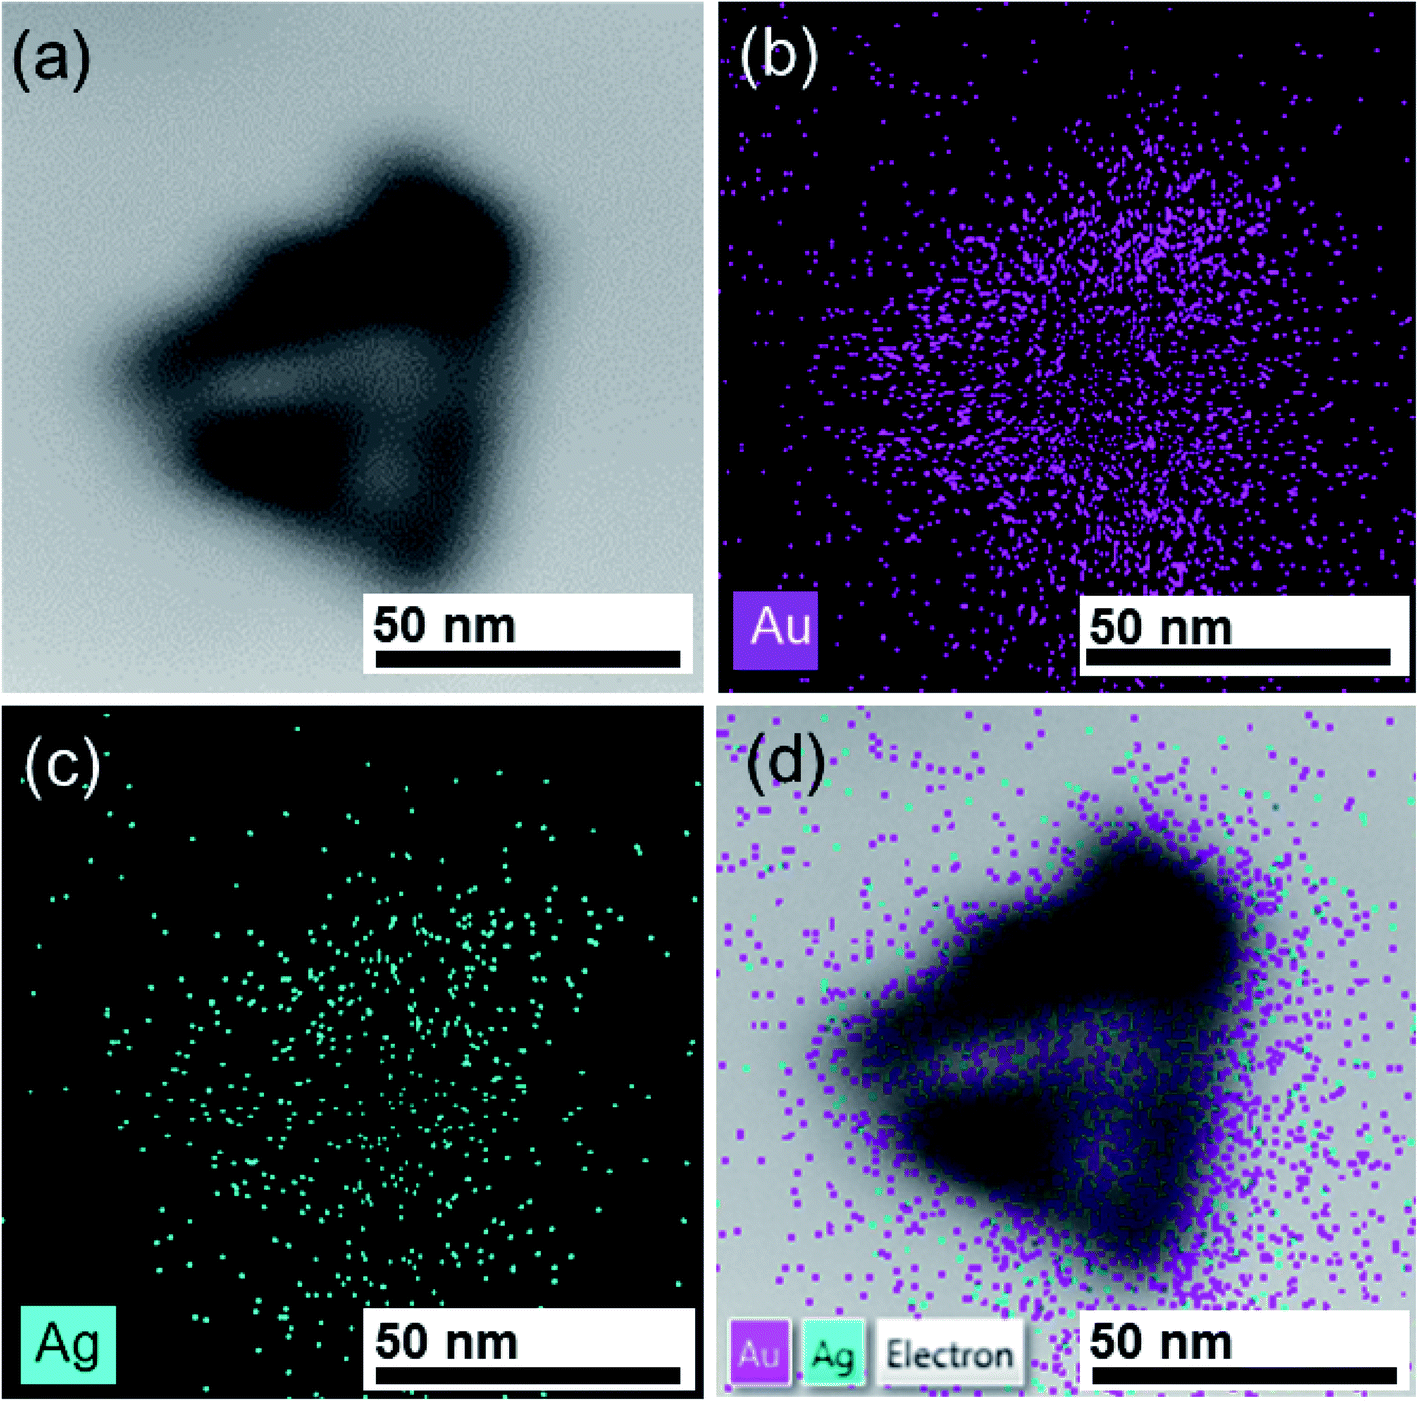
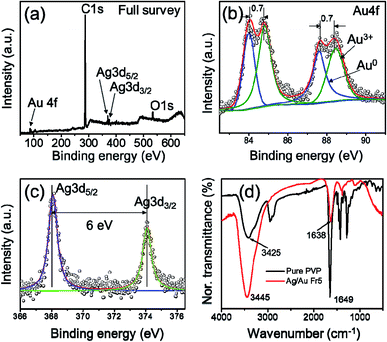
X-ray photoelectron spectroscopy (XPS) was used to analyze the valence states of the components in the product and investigate the element distribution in the layer near surface. The results shown in Fig. 7 provided evidence about the presence of Ag, Au elements in the bimetallic nanoframe of Ag/Au Fr5 sample, where the layer near surface of Ag/Au nanoframe is rich in Au. C 1s and O 1s peaks come from PVP surfactant in the Ag nanoplates preparation process. Fig. 7b shows the magnified part of Fig. 7a in the range of 82.5–91 eV. The emission of 4f photoelectrons from Au is identified in four peaks of the XPS spectra. Au 4f peak was resolved into two spin–orbit components Au 4f7/2 and Au 4f5/2 with the corresponding binding energies of 84.1 eV and 87.6 eV, which are assigned to Au0. The binding energy of Au3+ shifted 0.7 eV to higher energy compared to Au0, and two corresponding components as 84.8 eV and 88.3 eV.40 This energy shift can be attributed to the interaction between the carboxyl oxygen in PVP with the Au atoms in the surface. Fig. 7c shows the peaks of Ag 3d5/2 and Ag 3d3/2 with the corresponding binding energy of 368.1 eV and 374.1 eV, in good agreement with previously reported values.41
 |
| | Fig. 7 (a) XPS spectrum of the Ag/Au Fr5 sample, (b and c) high-resolution XPS spectrum of Au 4f and Ag 3d peaks, respectively, (d) FTIR spectra of pure PVP and Ag/Au Fr5. | |
FTIR measurement was carried out in order to identify the presence of various functional groups in Ag/Au Fr5 by comparing the observed intense bands with standard values. The infrared spectra (IR) of PVP and Ag/Au Fr5 are shown in Fig. 7d. One can be seen that all peaks are identical in both Ag/Au Fr5 and pure PVP, indicating the presence of capping agent (PVP) with nanoframes. The peak at 1649 cm−1 corresponds to carbonyl group (C![[double bond, length as m-dash]](https://www.rsc.org/images/entities/char_e001.gif) O) stretching vibration of pure PVP. The corresponding absorption peak of Ag/Au Fr5 (1638 cm−1) is shifted 11 cm−1 to the left in comparison with that of pure PVP, indicating that the IR character of PVP can be affected by the action of gold atoms. This shift to high frequency is due to the interaction between the pyrrolidone rings of PVP molecules and surface Au atoms to form –CO–Au bonds.
O) stretching vibration of pure PVP. The corresponding absorption peak of Ag/Au Fr5 (1638 cm−1) is shifted 11 cm−1 to the left in comparison with that of pure PVP, indicating that the IR character of PVP can be affected by the action of gold atoms. This shift to high frequency is due to the interaction between the pyrrolidone rings of PVP molecules and surface Au atoms to form –CO–Au bonds.
3.3. SERS application in MR detection
The Raman enhancing ability of Ag/Au nanoframes was investigated by recording SERS spectra and comparing absorption peak intensity with that from Ag nanoplates of the same Raman reporter concentration. The bimetallic nanoframes exhibit largely enhanced SERS activity because the sharp tips and edges can serve as active hot spots for enhancing the SERS signals.7 The SERS analysis was carried out on the as-prepared Ag nanoplates and Ag/Au nanoframes using methyl red (MR) as dye agent and a laser excitation wavelength of 532 nm. MR was diluted in ethanol with various concentrations (10−6 to 10−4 M) and pH of the solution was adjusted to 7.2 using NaOH solution (0.1 M in water) before being absorbed onto Ag nanoplates or Ag/Au nanoframes. MR molecules bind naturally to the metallic surface without any chemical modification. The high SERS efficiency of Ag/Au nanoframes can be ascribed to the effective coupling of LSPR peaks with the laser used to excite the Raman spectra.
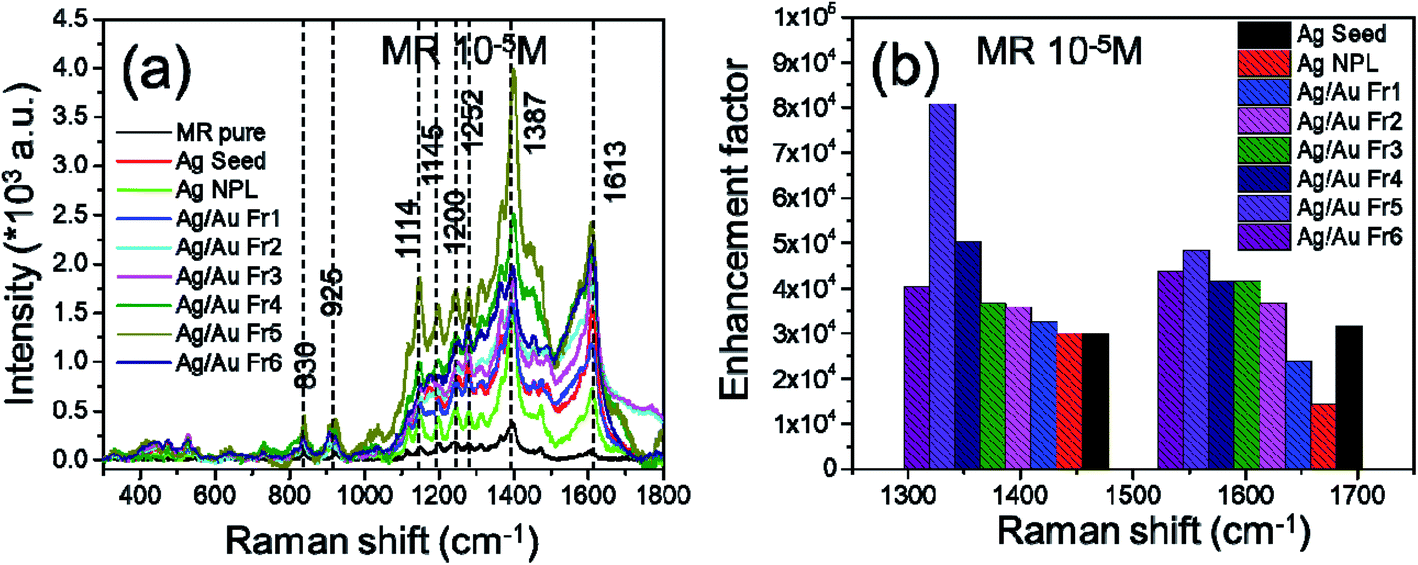
Fig. 8a illustrates the Raman spectrum of pure methyl red (MR). Several prominent peaks at 830, 925, 1114, 1145, 1200, 1252, 1315, 1387, 1470 and 1613 cm−1 correspond to the characteristic peak position of MR molecules, where 1387 cm−1 was the most prominent peak. The strongest band at 1387 cm−1 is attributed to NN vibration, the band at 1613 cm−1 is assigned to CC and CN vibration of the quinonoid ring system.42 The 1315, 1275 and 1200 cm−1 bands are assigned to C–N stretch, C-ring in-plane bend and N–N bend, respectively.43 The bands at 830 cm−1, 1114 cm−1 and 1315 cm−1 are attributed to the N-ring mode, the peak at 925 cm−1 belongs to CNC. The UV-Vis spectra of MR, Ag/Au Fr5 and MR + Ag/Au Fr5 complex have been measured (Fig. 8b). The UV-Vis spectrum of MR + Ag/Au Fr5 complex shows main absorption peaks at 415, 508 and 650 nm, where 415 nm has the strongest resonance and 650 nm has the weakest resonance.
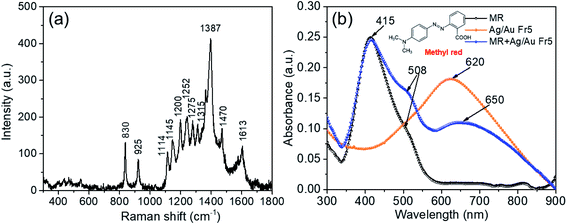 |
| | Fig. 8 (a) Raman spectrum of pure methyl red (MR); (b) the UV-Vis spectrum of pure methyl red (MR), Ag/Au Fr5 and the MR + Ag/Au Fr5 complex sample. MR concentration was 10−5 M. | |
Fig. 9a shows the SERS spectra of MR (10−5 M) absorbed on all the nanoplates and nanoframes samples. All of samples were excited by laser at 532 nm which is in LSPR region from 400 to 650 nm. The small shift in the characteristic peaks is due to the interaction of MR molecules with Ag/Au substrates. Ag/Au Fr5 sample exhibited well-defined SERS signal compared to other samples. This means that this sample created many roughness, defects, cages provided more “hot spots” than other samples in the same area, the magnetoelectric filed was enhanced which induced extremely enhanced Raman signals. The observed SERS effect is due to charge transfer resonance between Ag/Au Fr5 and the adsorbed MR molecules. The enhancement factor (EF) for dye molecules adsorbed on Ag/Au nanoframes was estimated according to the following equation:44
| |
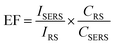 | (8) |
where
ISERS is the signal intensity of SERS at the scattering band of interest,
i.e. at 1387 cm
−1,
CSERS represents the concentration of MR that is chemisorbed on the substrate and contributes to SERS signal,
IRS is the Raman intensity at the same band when the MR concentration of 10
−2 M on Si wafer without using Ag/Au nanoframes or Ag nanoplates,
CRS = 10
−2 M is the normal concentration of MR which produced Raman signal (
IRS). Here, we presume that the MR molecules were evenly distributed in the aqueous solution. Based on the intensity of the peak located at 1387 cm
−1, the estimated EF for Ag nanoplates and Ag/Au nanoframes are displayed in
Fig. 9b. The enhancement factor (EF) values were calculated by dividing the intensity of the Raman characteristic peak of the organic dye on the SERS substrates to the intensity on a glass slide. Ag/Au Fr5 showed the EF of
ca. 8 × 10
4 toward the MR concentration of 10
−5 M, approximately two times magnitude higher than those of other samples, due to the high surface area of the large Ag/Au Fr5 and the large fraction of low coordination metal sites such as vertices, edges, kinks can lead a significant increase of active surface atom fractions which promote adsorption of MR molecules. The SERS response is significantly affected by the chemical adsorption of analytic molecules on the nanoparticle surface. MR molecules strongly adsorbed onto the Ag/Au nanoframe surface could contribute to the improvement in the SERS signal intensity. The high SERS activity originates from the large surface roughness due to the stepwise etching of the silver core which generated more defect sites on the surface. Ag/Au nanoframes have a broad absorption cross-section matching the wavelength of the laser line and the absorption peak of Raman reporters for resonant signal enhancement.
45,46 Additionally, intense electromagnetic field can be localized within the crevices or gaps between the nanoframes, rendering inherent electromagnetic (EM) hot-spots. Target molecules entering this gap feel a strong EM field and produce strong signals, giving rise to increased SERS.
47 Further growth of the gold amount in Ag/Au Fr6 sample weakens the electromagnetic coupling between silver and gold in accordance with plasmon hybridization.
8 Weaker EFs of other samples are due to weak coupling between their free electrons to the excitation laser. The comparison plot of obtained EFs for MR recorded from 1387 and 1613 cm
−1 peaks is depicted in
Fig. 9b. The peak of 1387 cm
−1 of Ag/Au Fr5 demonstrated more than two orders of magnitude stronger EFs than other samples.
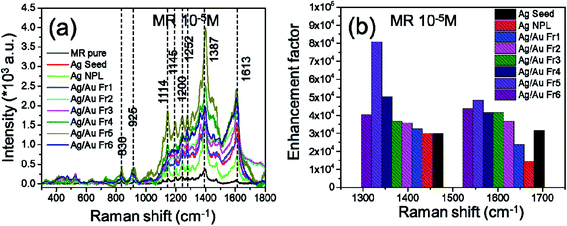 |
| | Fig. 9 (a) SERS spectra of MR (10−5 M) on Ag/Au nanoframes substrates, (b) enhancement factors of 1387 cm−1 and 1613 cm−1 peaks. | |
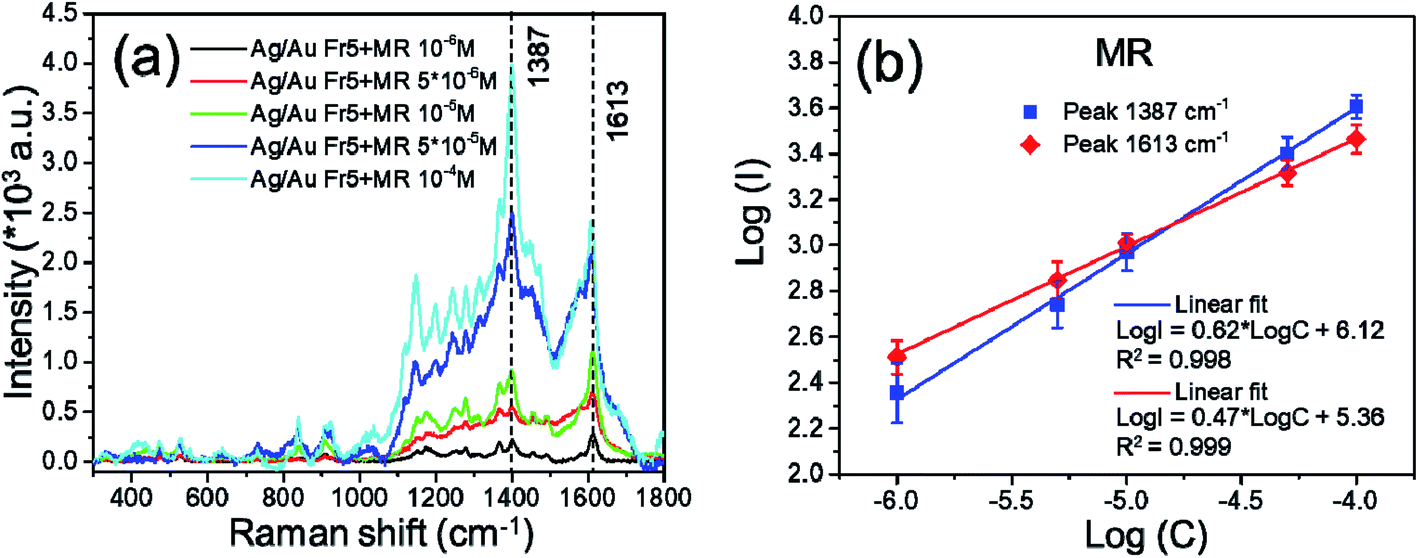
To test the sensitivity of Ag/Au Fr5 substrate, a series of SERS measurements were conducted for MR different concentrations from 10−6 M to 10−4 M. Fig. 10a illustrates the variation in the SERS intensity with varying analyte concentration was recorded and the SERS intensity increased as the concentration of MR increased. In addition, there exists a linear dependence between the logarithm of MR concentration (logC) and the logarithm of SERS signal intensity (logI) for the characteristic peak of 1387 cm−1 of Ag/Au Fr5 sample as follow: logI = 0.62logC + 6.12 with the correlation factor R2 = 0.998 within the concentration range investigated. Here, logI was proportional to logC, rather than directly proportional to MR concentration. The slope of straight line estimated from Fig. 10b varied from 0.62 and 0.47 corresponding to 1387 cm−1 and 1613 cm−1 bands, respectively. SERS intensity of 1387 cm−1 peak changed more sensitively with MR concentration change than that of 1613 cm−1 peak. The Raman signals for MR are clearly recognized even at the concentration of 10−6 M, therefore, the limit of detection (LOD) for MR using Ag/Au Fr5 as substrate is 10−6 M (Fig. 10b).
 |
| | Fig. 10 (a) Raman spectra of Ag/Au Fr5 toward various concentrations of MR, (b) dependence of logarithm of SERS intensity on logarithm of MR concentration. | |
3.4. SERS reproducibility and stability
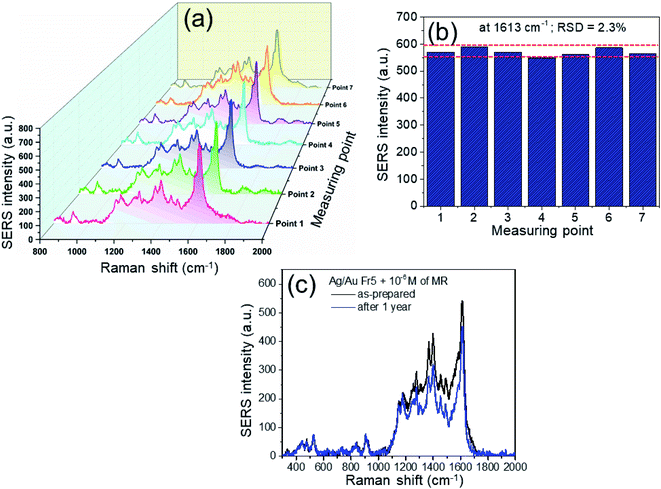
The reproducibility and stability of the substrate are also crucial in realizing a successful SERS substrate for practical application. The SERS signals were collected from 7 different points on Ag/Au Fr5 substrate. Fig. 11a and b depicts the 3D SERS spectra of MR (10−5 M) and their corresponding histogram. The estimated relative standard deviation (RSD) for SERS intensity of 1613 cm−1 peak is 2.3%. The excellent reproducibility is demonstrated by slight variation of SERS signal from different batches (not shown here). This RSD indicates the reproducibility and suggests that the Ag/Au Fr5 is a good SERS substrate for detecting MR. To determine the specificity of the SERS substrates, we also examined the intensity SERS signal at 1613 cm−1 versus methyl red (MR), methylene blue (MB), rhodamine 6G (R6G). The finding confirmed that the SERS intensity toward MR was much stronger than that of MB and R6G, exhibiting the specificity of this SERS substrate toward MR (not shown here). Pure silver is prone to oxidation and becomes unstable in oxidative environment, so SERS activity on silver substrate will be reduced over a period of time.
 |
| | Fig. 11 SERS reproducibility and stability. | |
Bimetallic nanomaterials can merge the advantages from silver and gold, where gold atoms help protect silver atoms against oxidation, so the presence of Au in these bimetallic nanoframes displays stable property. Thus, Ag/Au substrate offers a stable platform surpassing SERS enhancement. SERS capability of Ag/Au nanoframes benefited by the advantages the strong plasmonic electric field enhancement of Ag and the chemical stability of Au. The substrate was exposed to ambient environment for a period of time, then treated with MR and the SERS intensity was measured to grade its stability. There was a bit degradation observed in Fig. 11c, a reduction in SERS intensity about 10% after 1 year. The presence of stable Au in bimetallic nanoframes leads to stable and reproducible SERS substrate. This result substantiates the potential of Ag/Au Fr5 for use in long-term sensing and for on-site and field-based detection in combination with portable Raman spectrometer.
4. Conclusions
In conclusion, we have successfully fabricated bimetallic Ag/Au nanoframes with hollow structure through the chemical route. Ag nanoplates transformed to Ag/Au nanoframes via the galvanic replacement reaction at low pH value (pH = 4), where the galvanic replacement rate dominates compared to the reduction rate by the L-AA and yielded well-defined hollow nanoframes. The phase and composition of fabricated nanoframes were determined from XRD, TEM, SEM, EDS, EDX mapping. These nanoframes acted as efficient SERS platforms for detection of methyl red (MR) dye molecules. Interestingly, Ag/Au Fr5 (0.8 μmol HAuCl4) exhibited superior SERS response compared to Ag nanoplates and other Ag/Au nanoframes. Moreover, this nanomaterial exhibited the good reproducibility, stability, specification toward MR with low LOD and high EF. The present results open an avenue for promising to create nanoscale materials with desired architectures for on-field applications in detection of methyl red. Studying of similar framework syntheses as well as their applications for various chemical dyes is in progress.
Conflicts of interest
There are no conflicts to declare.
Acknowledgements
This research is funded by Vietnam National Foundation for Science and Technology Development (NAFOSTED) under grant number 103.03-2020.43.
References
- K. Sytwu, M. Vadai and J. A. Dionne, Adv. Phys.: X, 2019, 4, 1619480 CAS.
- H. Liu, T. Liu, L. Zhang, L. Han, C. Gao and Y. Yin, Adv. Funct. Mater., 2015, 25, 5435–5443 CrossRef CAS.
- S. Mohan, A. C. Sekar and B. Subramanian, Procedia Eng., 2014, 92, 19–25 CrossRef CAS.
- T. U. T. Dieu and L. N. Quang, Adv. Nat. Sci.: Nanosci. Nanotechnol., 2020, 11, 015010 CAS.
- X. Guo, Z. Guo, Y. Jin, Z. Liu, W. Zhang and D. Huang, Microchim. Acta, 2012, 178, 229–236 CrossRef CAS.
- C. Zhang, S. Z. Jiang, C. Yang, C. H. Li, Y. Y. Huo, X. Y. Liu, A. H. Liu, Q. Wei, S. S. Gao, X. G. Gao and B. Y. Man, Sci. Rep., 2016, 6, 25243 CrossRef CAS PubMed.
- S. Kumar-Krishnan, M. Estevez-Gonzalez, R. Perez, R. Esparza and M. Meyyappan, RSC Adv., 2017, 7, 27170–27176 RSC.
- C. Y. Fu, K. W. Kho, U. S. Dinish, Z. Y. Koh and O. Malini, J. Raman Spectrosc., 2012, 43, 977–985 CrossRef CAS.
- X. Yang, M. Yang, B. Pang, M. Vara and Y. Xia, Chem. Rev., 2015, 115, 10410–10488 CrossRef CAS PubMed.
- L. Bi, X. Wang, X. Cao, L. Liu, C. Bai, Q. Zheng, J. Choo and L. Chen, Talanta, 2020, 220, 1–8 CrossRef PubMed.
- R. Mei, Y. Wang, Q. Yu, Y. Yin, R. Zhao and L. Chen, ACS Appl. Mater. Interfaces, 2020, 12, 2059–2066 CrossRef CAS PubMed.
- X. Su, Y. Wang, W. Wang, K. Sun and L. Chen, ACS Appl. Mater. Interfaces, 2016, 8, 10201–10211 CrossRef CAS PubMed.
- Y. Yang, Q. Zhang, Z.-W. Fu and D. Qin, ACS Appl. Mater. Interfaces, 2014, 6, 3750–3757 CrossRef CAS PubMed.
- M. K. Singh, P. Chettri, J. Basu, A. Tripathi, B. Mukherjee, A. Tiwari and R. K. Mandal, Mater. Lett., 2019, 249, 33–36 CrossRef CAS.
- D. E. Charles, D. Aherne, M. Gara, D. M. Ledwith, Y. K. Gunko, J. M. Kelly, W. J. Blau and M. E. Brennan-Fournet, ACS Nano, 2010, 4, 55–64 CrossRef CAS PubMed.
- M. Fan, F.-J. Lai, H.-L. Chou, W.-T. Lu, B.-J. Hwang and A. G. Brolo, Chem. Sci., 2013, 4, 509–515 RSC.
- M. Sun, H. Qian, J. Liu, Y. Li, S. Pang, M. Xu and J. Zhang, RSC Adv., 2017, 7, 7073–7078 RSC.
- T. T. H. Pham, X. H. Vu, N. D. Dien, T. T. Trang, N. V. Truong, T. D. Thanh, P. M. Tan and N. X. Ca, RSC Adv., 2020, 10, 24577–24594 RSC.
- R. Kuladeep, L. Jyothi, K. S. Alee, K. L. N. Deepak and D. N. Rao, Opt. Mater. Express, 2012, 2, 161–172 CrossRef CAS.
- C. Xue, J. E. Millstone, S. Li and C. A. Mirkin, Angew. Chem., Int. Ed., 2007, 46, 8436–8439 CrossRef CAS PubMed.
- O. Olea-Mejia, M. Fernandez-Mondragon, G. R.-d. l. Concha and M. Camacho-Lopez, Appl. Surf. Sci., 2015, 348, 66–70 CrossRef CAS.
- M. M. Shahjamali, E. Martinsson, W. Marcello, L. Yin, B. Liedberg, F. Boey and C. Xue, Proc. SPIE, 2012, 8351, 83511S CrossRef.
- L. M. Moreau, C. A. Schurman, S. Kewalramani, M. M. Shahjamali, C. A. Mirkin and M. J. Bedzyk, J. Am. Chem. Soc., 2017, 139, 12291–12298 CrossRef CAS PubMed.
- C.-H. Tsai, S.-Y. Chen, J.-M. Song, M. Haruta and H. Kurata, Nanoscale Res. Lett., 2015, 10, 438 CrossRef PubMed.
- P. Ye, W. Xin, I. M. D. Rosa, Y. Wang, M. S. Goorsky, L. Zheng, X. Yin and Y.-H. Xie, ACS Appl. Mater. Interfaces, 2020, 12, 22050–22057 CrossRef CAS PubMed.
- R. V. William, G. M. Das, V. R. Dantham and R. Laha, Sci. Rep., 2019, 9, 10771 CrossRef CAS PubMed.
- M. A. Uppal, M. B. Ewing and I. P. Parkin, Eur. J. Inorg. Chem., 2011, 4534–4544 CrossRef CAS.
- M. S. S. Bharati, C. Byram and V. R. Soma, Front. Phys., 2018, 6, 28 CrossRef.
- M. Z. Si, Y. P. Kang and R. M. Liu, Appl. Surf. Sci., 2012, 258, 5533–5537 CrossRef CAS.
- T. T. H. Pham, N. D. Dien, X. H. Vu, T. T. Tran, N. X. Ca, N. V. Truong, P. M. Tan, H. T. Van and P. V. Do, J. Electron. Mater., 2020, 49, 5009–5027 CrossRef CAS.
- C. M. Cobley and Y. Xia, Mater. Sci. Eng., R, 2010, 70, 44–62 CrossRef PubMed.
- M. M. Shahjamali, M. Salvador, M. Bosman, D. S. Ginger and C. Xue, J. Phys. Chem. C, 2014, 118, 12459–12468 CrossRef CAS.
- L. Xu, Z. Luo, Z. Fan, X. Zhang, C. Tan, H. Li, H. Zhang and C. Xue, Nanoscale, 2014, 6, 11738–11743 RSC.
- M. M. Shahjamali, M. Bosman, S. Cao, X. Huang, S. Saadat, E. Martinsson, D. Aili, Y. Y. Tay, B. Liedberg, S. C. J. Loo, H. Zhang, F. Boey and C. Xue, Adv. Funct. Mater., 2012, 22, 849–854 CrossRef CAS.
- J. Li, J. Liu, Y. Yang and D. Qin, J. Am. Chem. Soc., 2015, 137, 7039–7042 CrossRef CAS PubMed.
- K. Jyoti, M. Baunthiyal and A. Singh, J. Radiat. Res. Appl. Sci., 2016, 9, 217–227 CrossRef CAS.
- G. Si, Z. Ma, K. Li and W. Shi, Plasmonics, 2011, 6, 241–244 CrossRef CAS.
- J.-Y. Lin, Y.-L. Hsueh and J.-J. Huang, J. Solid State Chem., 2014, 214, 2–6 CrossRef CAS.
- Y. Zhao, Z. Jian-bo, H. Hua, X. Xi-bin, L. Bing-chi, L. Xi-bo, L. Kai, N. Gao, T. Xiu-lan, L. Jiang-shan, T. Yong-jian, W. Wei-dong and Y. You-gen, Trans. Nonferrous Met. Soc. China, 2012, 22, 865–872 CrossRef.
- T. F. Jaramillo, S.-H. Baeck, B. R. Cuenya and E. W. McFarland, J. Am. Chem. Soc., 2003, 125, 7148–7149 CrossRef CAS PubMed.
- S. Das, B. Satpati, T. S. Bhattacharya and T. Bala, Nano-Struct. Nano-Objects, 2020, 22, 100438 CrossRef CAS.
- R. Giustetto, A. Idone and E. Diana, J. Raman Spectrosc., 2017, 48, 507–517 CrossRef CAS.
- C.-S. Liu, B.-H. Li, C.-H. Chen, J.-W. Peng and S. Lee, J. Raman Spectrosc., 2014, 45, 332–337 CrossRef CAS.
- S. Kundu, W. Dai, Y. Chen, L. Ma, Y. Yue, A. M. Sinyukov and H. Liang, J. Colloid Interface Sci., 2017, 498, 248–262 CrossRef CAS PubMed.
- A. McLintock, C. A. Cunha-Matos, M. Zagnoni, O. R. Millington and A. W. Wark, ACS Nano, 2014, 8, 8600–8609 CrossRef CAS PubMed.
- A. Garcia-Leis, A. Torreggiani, J. V. Garcia-Ramos and S. Sanchez-Cortes, Nanoscale, 2015, 7, 13629–13637 RSC.
- A. Jaiswal, L. Tian, S. Tadepalli, K.-k. Liu, M. Fei, M. E. Farrell, P. M. Pellegrino and S. Singamaneni, Small, 2014, 10, 4287–4292 CAS.
|
| This journal is © The Royal Society of Chemistry 2021 |
Click here to see how this site uses Cookies. View our privacy policy here. 
 Open Access Article
 This Open Access Article is licensed under a Creative Commons Attribution-Non Commercial 3.0 Unported Licence
 a,
Nguyen Dac Dienb,
Thi Thu Ha Pham*c,
Nguyen Van Truongd,
Nguyen Xuan Ca
a,
Nguyen Dac Dienb,
Thi Thu Ha Pham*c,
Nguyen Van Truongd,
Nguyen Xuan Ca