
 Open Access Article
 This Open Access Article is licensed under a Creative Commons Attribution-Non Commercial 3.0 Unported Licence
Thermal degradation of mango (Mangifera indica) wood sawdust in a nitrogen environment: characterization, kinetics, reaction mechanism, and thermodynamic analysis
Ajay Sharma * and
Bikash Mohanty
* and
Bikash Mohanty
Department of Chemical Engineering, Indian Institute of Technology, Roorkee, India 247667. E-mail: asharma@ch.iitr.ac.in
First published on 12th April 2021
Abstract
For better utilization of 11 million tonnes of Mangifera indica wood (MIW) sawdust produced annually in India, the present study was planned for its characterization followed by determination of its pyrolysis kinetics from TGA data under a N2 atmosphere. The characterization process included proximate-, ultimate-, biopolimeric components-, and heating value-analysis, as well as TG/DTG analysis. The distributed activation energy (DAE)- and Starink-methods were implemented on non-isothermal thermograms to compute the isoconversional values of activation energy for the pyrolysis of MIW. Further, the reaction mechanism for the pyrolysis of MIW was predicted using the Coats–Redfern (C–R) model-fitting method. Two distinct pyrolysis regions, region-I from 0.05–0.5 and region-II from 0.51–0.7, were observed in the complete conversion ranges. The estimated activation energy for region-I ranged from 143.03 to 176.46 kJ mol−1 with an average value of 157.12–157.97 kJ mol−1 and that of region-II varied between 143.03 and 161.68 kJ mol−1 with an average of 151.51–152.45 kJ mol−1. The one-dimensional diffusion model (D1) followed by the five and a half reaction order model (F5.5) were recommended to describe the pyrolysis reaction mechanism of MIW for the two above regions, respectively. Further, the activation energies obtained via the DAE and Starink methods were used for the computation of thermodynamic parameters such as frequency factor, and change in-enthalpy, -entropy, and -Gibbs free energy.
1 Introduction
Due to an increase in population as well as industrial globalization, the energy sectors worldwide are facing challenges to fulfill the demand and supply gap of energy. Biomass – a carbon-neutral renewable resource, which can be derived from the carbonaceous waste of various human and natural activities, has become the third primary energy resource after coal and oil to bridge the above energy gap. Biomass can be derived from numerous sources, including the by-products from the timber industry, agro crops, raw material from the forest, major parts of household waste and wood. Therefore, the focus of research communities is now shifting from coal and oil to biomass which will not only produce energy which will be carbon neutral but also solve many problems including solid waste management, health hazards, wildfires, etc.Parikka estimated the total worldwide energy potential from biomass, on a sustainable basis, to be 104 EJ per year, of which woody biomass, energy crops, and straw constituted 40.1%, 36%, and 16.6%, respectively.1 Only about 40% of potential biomass energy is currently utilized. The present global energy demand is about 470 EJ per year.1 Forest residues, which remain largely unutilized, present solid waste disposal problems. Among these residues, wood sawdust, which is created as byproducts of the wood processing at wood cutting and furniture making industry, are generally generated in large quantity every year.2 India is producing around 149 million cubic meters (≈100 million tonnes) of Mangifera indica wood per year,3 which when converted into planks will produce 11 million tonnes of sawdust. This sawdust is typically used in making of particle board and road laying. Still, a large amount of its waste is dumped around roadside, water bodies, and/or burn directly in an open environment, which creates anthropogenic hazard for all the living species and thus are an unacceptable solution. Mangifera indica wood is increasingly being used in furniture making, due to its pros as hardwood furniture material as well as its sustainability quotient. Mangifera indica species are found all around the world (major contributors are Bangladesh, Burma, Cambodia, China, Hawaii (US), India, Indonesia, Laos, Malaysia, Papua New Guinea, Philippines, Thailand, and Vietnam). Mangifera indica wood is readily available and is affordable compared to other timber species.
Reaction kinetics, which includes the computations of kinetic triplets (the activation energy, pre-exponential factor and reaction models), is essentially required in order to understand the chemistry behind the thermal degradation of material and further to transform laboratory-scale studies to large-scale reactor conditions.4 The procedures used for the computation of kinetic parameters (A, E, and n) of material degradation during solid–gas heterogeneous reactions include model-fitting and model-free methods, which have been extensively used in the thermal decomposition of solids, thermal degradation of polymers and crystallization of glasses.5 TG-DTG coupled FTIR and/or GC-MS is widely used to extract information about material degradation and further to interpret the products released from the pyrolyzer unit.6 The reaction kinetics provide deeper insights into the mechanism of solid thermal degradation which is important for the proper selection-, optimization- and operation – of a reactor.7 Moreover, kinetic analysis of pyrolysis reaction further opens the path for the estimation of various thermodynamic parameters enthalpy (ΔH), Gibbs free energy (ΔG), and entropy (ΔS) of the pyrolysis process.8 The thermodynamic parameters are essentially needed to design an efficient pyrolysis system and also for choosing the target biofuels.9
Amongst all thermochemical processes such as combustion, gasification, and pyrolysis, pyrolysis is the least energy-consuming process thus, the assessment of thermodynamic parameters on pyrolysis conditions is imperative. In all, kinetic parameters, reaction mechanism and thermodynamic parameters (change in-enthalpy, -Gibbs free energy, and -entropy) are important for the design, optimization, and scaling of process reactor.
Even though India is the largest producer of mango (Mangifera indica) wood in the world, scientific management of waste mango wood created during processing needs special attention. From literature review, it has been observed that there is hardly any research work conducted to study pyrolysis kinetics and its thermodynamic analysis for Mangifera indica wood (MIW). Also, a few research papers are available in an open literature that provides systematic kinetic and thermodynamic data of wood pyrolysis with detailed explanations of phenomena. Hence, the present study was planned to investigate the characterization of MIW sawdust, determination of pyrolysis kinetics and reaction mechanism. In addition, the thermodynamic parameters were computed to assess the feasibility of MIW pyrolysis for effective process designs and operations.
2 Materials and methods
2.1 Feedstock preparation
The MIW sawdust used as a raw material in this study was obtained from a sawmill at Meerut, Uttar Pradesh (India). The sawdust sample was then heated in an air oven at 35 °C for 24 hours and sieved to obtain an average particle size of 100 μm. The sieved sample (100 μm) was kept in a closed plastic zip-bag for the thermogravimetric analysis.2.2 Chemical characterization of MIW
This section includes proximate-, ultimate-, heating value-, and biopolimeric components-analysis of MIW sample. The proximate analysis is the easiest and the fastest way of investigating the fuel potential of solid materials. It determines the moisture, volatile matter, ash, and fixed carbon content of the sample. The detailed evaluation of these on 1 g initial sample mass basis is given in Table 1.| Moisture content (MC) | Volatile matter (VM) | Ash | |
|---|---|---|---|
| a Where m1 = mass of the sample after moisture removal, m2 = mass of sample after the removal of moisture and volatile matter, and m3 = mass of ash content present in the sample.b All mass should be measured after cooling down the sample in a desiccator up to room temperature. | |||
| Standard | ASTME871 | ASTME872 | ASTMD1102 |
| Sample mass (initial) | 1 g | m1 g | m2 g |
| Temperature | 103 ± 2 °C | 925 ± 5 °C | 580–600 °C |
| Holding time | Until constant mass | 7 min | 4 h |
| Crucible | Silica spherical | Silica cylindrical | Silica cylindrical |
| Sample mass (final) | m1 g | m2 g | m3 g |
| Calculation (%) | (1 − m1) × 100 | (m1 − m2)×100 | m3 × 100 |
| Fixed carbon (mass%) = 100 − MC − VM − ash = (m2 − m3) × 100 | |||
Further, the elemental compositions (CHNS/O) of MIW sawdust were determined using an elemental analyzer (Perkin Elmer 2400, USA). The elemental compositions which include the determination of the mass% of carbon, hydrogen, nitrogen, sulfur, and oxygen content were then used for the computation of calorific value. The calorific value of material can be categorized as higher and lower heating values (HHV and LHV). The HHV and LHV measure the amount of energy which can be obtained from the unit quantity of material. The HHV and LHV were computed using the analytical expressions given by Channiwala and Parikh10 and Basu,11 respectively. In addition to it, mass% of extractives, hemicellulose, cellulose, and lignin were determined using Li et al.12 The detailed experimental procedure is given elsewhere.13
2.3 Thermogravimetric/differential thermogravimetric (TG/DTG) analysis
In order to determine the thermal stability of material over the temperature range of 30 °C to 650 °C, the MIW sample was passed through a thermogravimetric (TG/DTG) analyzer (Seiko Model: SII 6300 EXSTAR, Japan). A non-isothermal TG/DTG analysis of the MIW sample was carried out at four different heating rates of 10, 20, 30, and 40 °C min−1. For a given heating rate, 10 mg sample of MIW was taken in an alumina (Al2O3) crucible and was heated from ambient temperature to 650 °C. During the whole experiment, the flow of nitrogen gas (N2(g); purity = 99.999%) was maintained at 100 ml min−1, which created an inert environment around the sample. The TG-DTG data was further used for the computation of activation energy, frequency factor, change-of enthalpy, -entropy, and -Gibbs free energy. A detailed description of the methodology used for the determination of kinetics parameters is given in the next section.2.4 Non-isothermal kinetic model for the pyrolysis reaction
To define the complete pyrolysis process is challenging as it involves enormous variations due to physical and chemical transformations while producing a large number of product species. As a result, thermal degradation of biomass is a heterogeneous reaction and as single-step global kinetics, it can be modeled as:where a and b are the yield coefficients of the different products (bio-char and volatiles) of the pyrolysis. The rate expression for the above reaction:14

 | (1) |
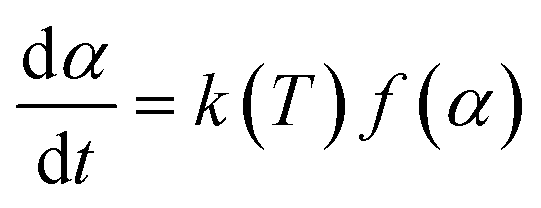
 ; m(Ti) = initial sample mass, m(Tf) = final sample mass, and m(T) = instantaneous sample mass. The Arrhenius equation is useful for describing reaction rate constant ‘k(T)’ of many thermally activated, heterogeneous solid-state reactions such as diffusion, nucleation and nuclei growth, presumably because the system has to overcome an energy barrier and energy distribution along the relevant coordinate is controlled by Boltzmann statistics. Therefore, k(T) = A
![[thin space (1/6-em)]](https://www.rsc.org/images/entities/char_2009.gif) exp(−Ea/RT); A = frequency factor, exp(−Ea/RT) = Boltzmann factor, Ea = apparent activation energy, R = universal gas constant. The factor f(α) represents the differential form of reaction model, which is a function of conversion and reaction order.
exp(−Ea/RT); A = frequency factor, exp(−Ea/RT) = Boltzmann factor, Ea = apparent activation energy, R = universal gas constant. The factor f(α) represents the differential form of reaction model, which is a function of conversion and reaction order.
Therefore,
 | (2) |
Further, a constant term β (=dT/dt) called heating rate is introduced as a conversion factor, used whenever required for the transformation of dynamic form into non-isothermal form. As in the present case, for non-isothermal TG kinetics, eqn (2) converts as below:
 | (3) |
Integrating above on both sides:


The second term in R.H.S is comparatively small. So, neglecting low-temperature end of the interval, the general form of all the integral isoconversional kinetic methods,
 | (4) |
 | (5) |
 whereas, in Starink method:16
  of
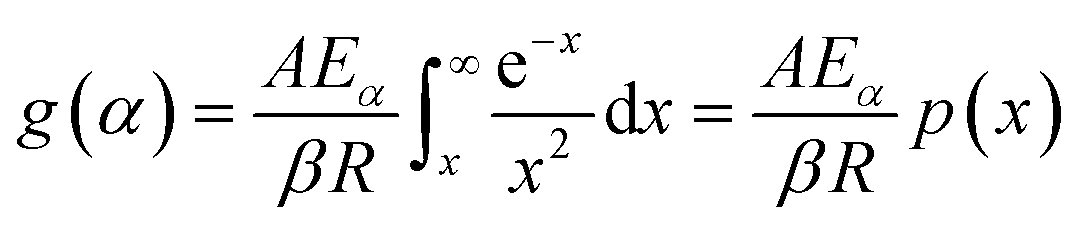
of  . Further, the Eα values obtained from these methods were used to predict the reaction mechanism. For this purpose, the Coats–Redfern (C–R) expression17 was used. The details for the method is given below:
From eqn (4),
 | (6) |
Assuming (1 − 2RT/Ea) ≈ 1 and taking loge of eqn (6), the final expression becomes:
| ln[g(α)/Tα2] = −(Ea/RTα) + ln(AR/βEa) | (7) |
Based on mechanistic assumptions, reaction models are divided into nucleation, geometrical contraction, diffusion, and reaction order.18 Under nucleation models, the formation and growth of nuclei are considered to be rate-limiting. In geometrical contraction, the progress of product layer from the surface to the inner boundary is considered to be rate-limiting. In diffusion, the diffusion of reactant or product is considered to be rate-limiting. And finally, in reaction order based model, the rate law is based on homogeneous kinetics. Based on the above mechanisms, the integral form of the reaction model [g(α)] was decided. Table 2 lists different models as a function of the extent of conversion. Here, g(α) is approximated to defined linear or non-linear expressions based on conversion (α) and order of reaction (n). Corresponding to each kinetic mechanism, a global value of activation energy (Ea) and pre-exponential factor (A) was obtained.
| Degradation mechanisms | Differential form: f(α) |
|
|
|---|---|---|---|
| Nucleation models | |||
| A2 | Avrami–Erofe'ev | 2(1 − α)[−ln(1 − α)]1/2 | [−ln(1 − α)]1/2 |
| A3 | Avrami–Erofe'ev | 3(1 − α)[−ln(1 − α)]2/3 | [−ln(1 − α)]1/3 |
| A4 | Avrami–Erofe'ev | 4(1 − α)[−ln(1 − α)]3/4 | [−ln(1 − α)]1/4 |
|
|||
| Reaction-order models | |||
| F0/R1 | Zero-order | 1 | α |
| F1 | First-order | (1 − α) | −ln(1 − α) |
| F2 | Second-order | (1 − α)2 | [1 − (1 − α)−1]/−1 |
| F3 | Third-order | (1 − α)3 | [1 − (1 − α)−2]/−2 |
| F4 | Fourth-order | (1 − α)4 | [1 − (1 − α)−3]/−3 |
| F5 | Fifth-order | (1 − α)5 | [1 − (1 − α)−4]/−4 |
 |
Five and a half-order | (1 − α)5.5 | [1 − (1 − α)−4.5]/−4.5 |
|
|||
| Diffusion models | |||
| D1 | One dimensional | (1/2)α | α2 |
| D2 | Two dimensional (Valensi) | [−ln(1 − α)]−1 | (1 − α)ln(1 − α) + α |
| D3 | Three dimensional (Jander) | 3(1 − α)2/3/2(1 − (1 − α)1/3) | [1 − (1 − α)1/3]2 |
| D4 | Three dimensional (Ginstling–Brounshtein) | (3/2) [(1 − α)−1/3 − 1] | [1 − (2/3) α] − (1 − α)2/3 |
|
|||
| Geometrical contraction models | |||
| R2 | Contracting area | 2(1 − α)1/2 | 1 − (1 − α)1/2 |
| R3 | Contracting volume | 3(1 − α)2/3 | 1 − (1 − α)1/3 |

2.5 Thermodynamic parameters calculation
With the obtained activation energy from isoconversional methods, the value of Tm from DTG curve and Tα from TGA thermogram, the thermodynamic parameters including the frequency factor (A), change-of enthalpy (ΔH), -entropy (ΔS), and -Gibbs free energy (ΔG) are all functions of heating rates, and can be computed by the following equations:8
 | (8) |
| ΔHα = Eα − RTα | (9) |
 | (10) |
 | (11) |
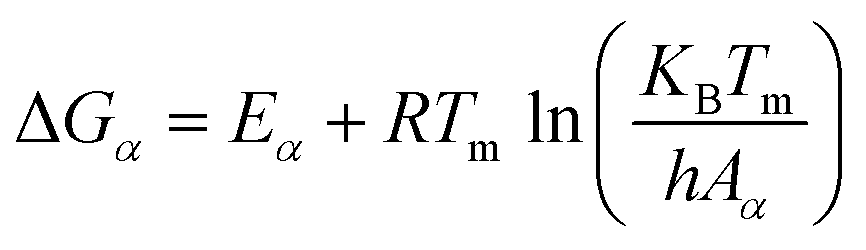
Moreover, the energy barriers (EB) for the formulation of activated complex from the initial reactants were also computed.
Mathematically,
| EB = Eα − ΔHα. | (12) |
3 Results and discussion
3.1 Characterization of MIW
Table 3 exhibits the results of the chemical characterization of MIW.| MIW | |
|---|---|
| a O2 content (mass%) = 100 − C (mass%) − H (mass%) − N (mass%) − S (mass%) − ash (mass%) − moisture (mass%).b Empirical formula of MIW was developed using its ultimate analysis data. | |
| Proximate analysis (mass%) | |
| Moisture content | 7.06 |
| Volatile matter | 73.38 |
| Ash | 4.47 |
| Fixed carbon | 15.09 |
|
|
| Ultimate analysis (mass%) | |
| C | 38.98 |
| H | 5.065 |
| N | 0.08 |
| S | 0.00 |
| Oa | 44.345 |
| HHV (MJ kg−1) | 14.89 |
| LHV (MJ kg−1) | 13.64 |
| H/C molar ratio | 1.559 |
| O/C molar ratio | 0.853 |
| Empirical formulab | CH1.559O0.853N0.002 |
|
|
| Biopolimeric components (mass%) | |
| Extractives | 5 |
| Hemicellulose | 25 |
| Cellulose | 46.25 |
| Lignin | 23.75 |
The proximate analysis of MIW shows volatiles and fixed carbon as 73.38 mass% and 15.09 mass% with moisture and ash content as 7.06 mass% and 4.47 mass%, respectively. The adequate amount of volatiles (73.38 mass%) in MIW facilitates the thermal conversion process, as they lead to more combustible gases during the conversion, which further converts to bio-oil by the condensation process. The fixed carbon in MIW (15.09 mass%) is also an important element as it gets converted into biochar during the pyrolysis.21 Further, the moisture content of 7.06 mass%, in MIW can be considered as low,22 meaning that it can be removed with a small amount of additional energy. The low ash content in MIW (4.47 mass%) indicates its fast thermal degradation since with high ash content biomass will tend to form slag and may cause fouling problems in many thermal conversion conveying parts. The moisture and ash content found in proximate analysis refers to the same moisture and ash as reported in the ultimate analysis. However, in the proximate analysis, obtained fixed carbon as 15.09 mass% differs from the reported carbon in the ultimate analysis which is 38.98 mass%. The plausible reason for this difference is that %C measured in ultimate analysis is the total mass% of carbon in MIW, including the carbon in volatile matter. Also, the sulfur content in MIW is 0 mass%. This indicates its favorability as there are no concerns related to SO2 emission & equipment corrosion when using it as a fuel. The HHV and LHV of MIW were computed as 14.89 MJ kg−1 and 13.64 MJ kg−1, respectively. The empirical formula of MIW was obtained as CH1.559O0.853N0.002. Moreover, the biopolimeric components of MIW such as extractives, hemicellulose, cellulose and lignin (in mass%) were found as 5, 25, 46.25 and 23.75, respectively.
3.2 Interpretation of TG-DTG plots for MIW pyrolysis
The mass loss curves (TG) and rate of mass loss curves (DTG) for MIW sample in nitrogen atmosphere over a period of temperature, at four heating rates of 10, 20, 30, and 40 °C min−1, are presented in part a and b of Fig. 1, respectively. The thermal decomposition profiles show that the entire pyrolysis of MIW can be divided into three zones (Fig. 1a).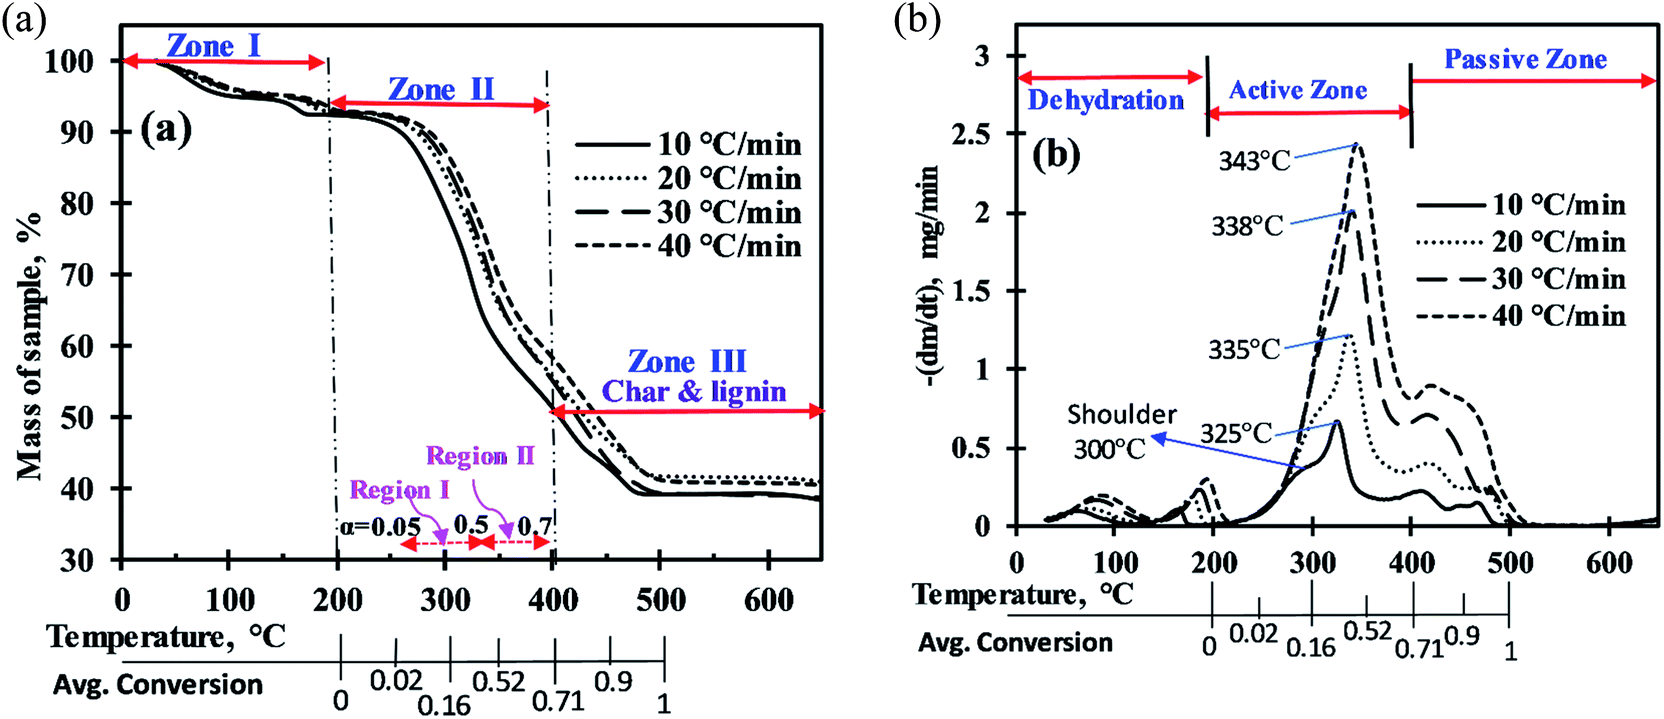 | ||
| Fig. 1 (a) Mass loss (%) of MIW with rise in temperature, (b) mass loss rate (mg min−1) of MIW with rise in temperature. | ||
3.3 Kinetic analysis
For the computation of kinetic parameters during the pyrolysis of MIW in the temperature range of 200 °C to 500 °C, the associated range of conversion was divided into a number of differential sub-zones having conversion difference (Δα) equal to 0.05 and for each sub-zone kinetic parameters were computed based on TG-DTG thermograms. The activation energies were determined by DAE and Starink methods using non-isothermal TG-DTG thermograms at four different heating rates (10, 20, 30, and 40 °C min−1).Fig. 2a and b depict the regression line plots of DAE and Starink methods, respectively. Fig. 2a and b shows that for conversions between 0.05 and 0.7, the correlation coefficients (R2) for above linear fit methods are close to unity. In the present study, depending upon the heating rates [β(1–4) = 10, 20, 30, and 40 °C min−1], the kinetic parameters were computed in the conversion range 0.05 to 0.7 which corresponds to a temperature range of 200 °C to 395 ± 15 °C. After a fractional conversion of 0.7, the computed activation energies (Eα) were not taken into consideration as these were unreliable due to low value of correlation coefficient (R2). The average activation energy (in kJ mol−1) computed using DAE and Starink methods were found to be 154.86 and 155.74, respectively. Table 4 enlists the comparison of average activation energy of MIW with other biomass reported in the literature using isoconversional methods. The matching of average E-values of MIW with other biomass such as poplar wood,26 eucalyptus wood,27 European beech wood,28 and sal wood29 makes it suitable for the co-pyrolysis with several other biomass feedstocks.
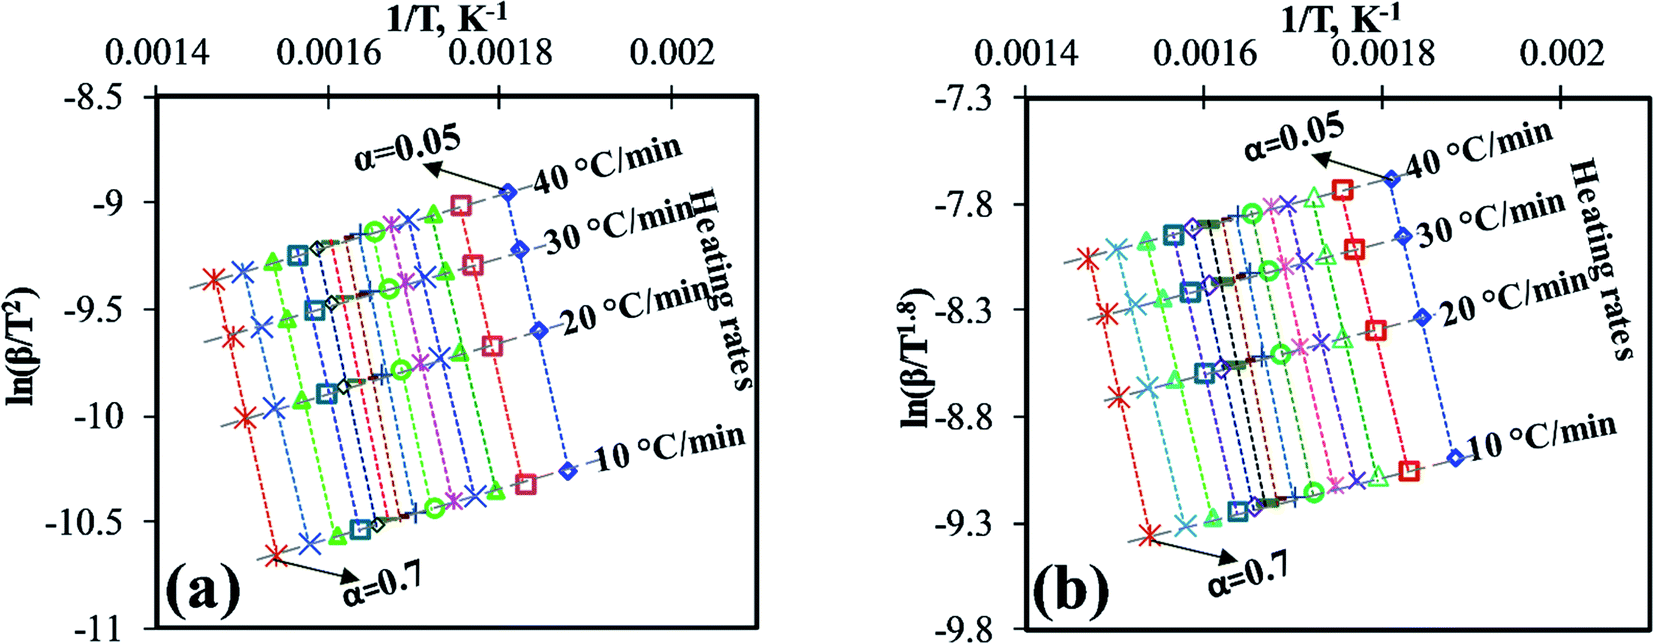 | ||
| Fig. 2 (a) DAE plot for Eα, (b) Starink plot for Eα. | ||
| Biomass feedstock | Heating rates (°C min−1) | Average activation energy (kJ mol−1) | References |
|---|---|---|---|
| MIW | 10, 20, 30, 40 | 154.86–155.74 | Present work |
| Dalbergia sissoo wood | 5, 10, 15, 20, 30 | 136.06–147.75 | 30 |
| Pine wood | 5, 10, 20, 40 | 181.00–181.28 | 31 |
| Babool wood | 10, 15, 20 | 91.6 ± 4.7 to 102.7 ± 6.06 | 32 |
| Wood sawdust | 5, 10, 20 | 164.24–173.41 | 33 |
| Poplar wood | 2, 5, 10, 15 | 157.27–158.58 | 26 |
| Eucalyptus wood | 10, 40 | 108.39–192.93 | 27 |
| European beech wood | 5, 10, 15, 25, 35, 50 | 157.20–185.40 | 28 |
| Pine sawdust | 5, 10, 15, 20, 25 | 168.58–206.62 | 29 |
| Sal wood | 148.44–181.53 | ||
| Areca nut husk | 160.45–184.61 | ||
| Olive wood | 5, 10, 20, 40, 100 | 54.05–116.78 | 34 |
| Invasive Reed Canary | 10, 20, 30, 40 | 159.61–161.29 | 35 |
In reference to Fig. 3, For 0.05 ≤ α ≤ 0.1 (avg. temperature from 270 to 288 °C), the decrease in activation energy was noticed which indicates first breaking of the strong hemicellulose–lignin linkage then the comparatively weaker hemicellulose–cellulose and lignin–cellulose linkage.36,37 Then, the activation energy remains almost constant for 0.1<α ≤ 0.2 (289 to 306 °C), indicating no severe bond cracking in this conversion range (Fig. 1b). After that, for 0.2 < α ≤ 0.4 (307 to 334 °C), an increase in activation energies attributes to the thermal cracking of strong bonds (aromatic rings, C![[double bond, length as m-dash]](https://www.rsc.org/images/entities/char_e001.gif) O, C(O)OH, C–C bonds within and between the alkyl chains) inside the biopolimeric components.38 Further, for 0.4 < α ≤ 0.65 (335 to 379 °C), the decrement in activation energies might be due to the breaking of C–OH and aliphatic groups, which requires comparatively less energy to break.39 After that, for 0.65 < α ≤ 0.7 (380 to 395 °C), the increment in activation energy indicates requirement of additional energy to benzene ring, aliphatic groups, methyl groups, and methoxy groups at ortho position of hydroxyl group in MIW.38 In the present study, the pattern of change in activation energies with conversion values is more consistent with the other biowastes such as Prosopis juliflora,40 pine, sal and areca nut sawdust.29 The change in activation energy with respect to conversion (Fig. 3) was due to the complex nature of pyrolysis reaction which shows the involvement of parallel, complex and competitive reactions.41
O, C(O)OH, C–C bonds within and between the alkyl chains) inside the biopolimeric components.38 Further, for 0.4 < α ≤ 0.65 (335 to 379 °C), the decrement in activation energies might be due to the breaking of C–OH and aliphatic groups, which requires comparatively less energy to break.39 After that, for 0.65 < α ≤ 0.7 (380 to 395 °C), the increment in activation energy indicates requirement of additional energy to benzene ring, aliphatic groups, methyl groups, and methoxy groups at ortho position of hydroxyl group in MIW.38 In the present study, the pattern of change in activation energies with conversion values is more consistent with the other biowastes such as Prosopis juliflora,40 pine, sal and areca nut sawdust.29 The change in activation energy with respect to conversion (Fig. 3) was due to the complex nature of pyrolysis reaction which shows the involvement of parallel, complex and competitive reactions.41
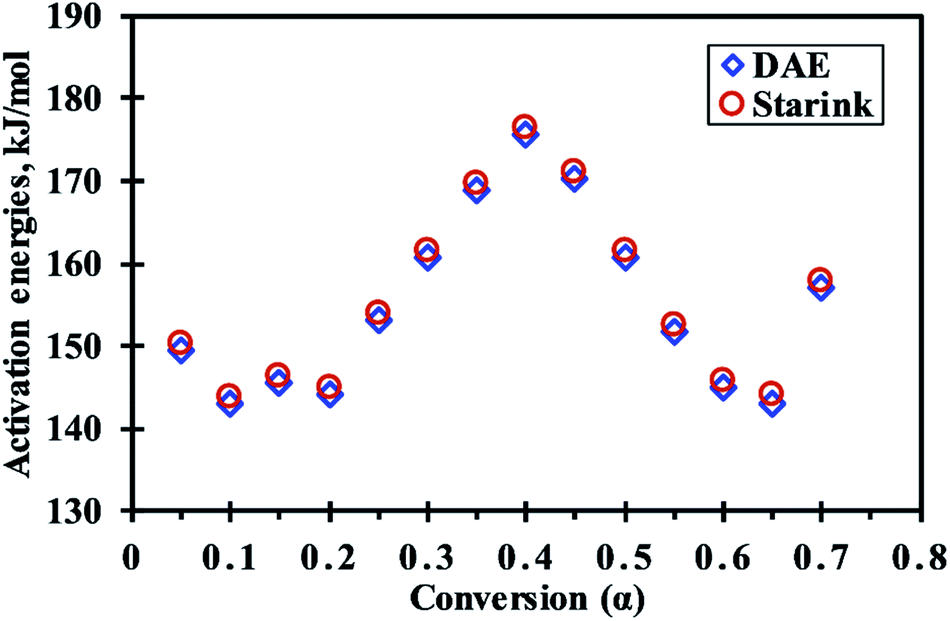 | ||
| Fig. 3 Variation of activation energies (Eα) with conversion (α) during progress of reaction. | ||
3.4 Prediction of degradation mechanism for the pyrolysis reaction of MIW
The C–R method was applied on thermogravimetric analysis (TGA) data at four different heating rates (10, 20, 30, and 40 °C min−1) to obtained E-values based on various solid-state thermal degradation mechanisms (Table 5).| Region | Reaction model | g(α) | 10 °C min−1 | 20 °C min−1 | 30 °C min−1 | 40 °C min−1 | Average E-values | |||||
|---|---|---|---|---|---|---|---|---|---|---|---|---|
| E, kJ mol−1 | R2 | E, kJ mol−1 | R2 | E, kJ mol−1 | R2 | E, kJ mol−1 | R2 | E, kJ mol−1 | R2 | |||
| I | A2 | [−ln(1 − α)]1/2 | 37.35 | 0.99 | 37.46 | 0.99 | 40.15 | 0.99 | 39.28 | 0.99 | 38.56 | 0.99 |
| A3 | [−ln(1 − α)]1/3 | 21.76 | 0.98 | 21.76 | 0.99 | 23.52 | 0.99 | 22.91 | 0.99 | 22.49 | 0.99 | |
| A4 | [−ln(1 − α)]1/4 | 13.96 | 0.98 | 13.91 | 0.99 | 15.20 | 0.99 | 14.72 | 0.99 | 14.45 | 0.98 | |
| F0 | α | 73.09 | 0.98 | 73.49 | 0.98 | 78.30 | 0.98 | 76.83 | 0.99 | 75.43 | 0.98 | |
| F1 | −ln(1 − α) | 84.15 | 0.99 | 84.56 | 0.99 | 90.04 | 0.99 | 88.38 | 0.99 | 86.78 | 0.99 | |
| F2 | [1 − 1/(1 − α)]/−1 | 96.56 | 1.00 | 96.96 | 1.00 | 103.19 | 1.00 | 101.32 | 1.00 | 99.51 | 1.00 | |
| F3 | [1 − 1/(1 − α)2]/−2 | 110.27 | 1.00 | 110.67 | 1.00 | 117.72 | 1.00 | 115.62 | 1.00 | 113.57 | 1.00 | |
| F4 | [1 − 1/(1 − α)3]/−3 | 125.22 | 1.00 | 125.61 | 1.00 | 133.56 | 1.00 | 131.22 | 1.00 | 128.90 | 1.00 | |
| F5 | [1 − 1/(1 − α)4]/−4 | 141.30 | 0.99 | 141.68 | 0.99 | 150.60 | 0.99 | 148.00 | 0.99 | 145.39 | 0.99 | |
| F5.5 | [1 − 1/(1 − α)4.5]/−4.5 | 149.73 | 0.99 | 150.10 | 0.99 | 159.53 | 0.99 | 156.79 | 0.99 | 154.04 | 0.99 | |
| D1 | α2 | 155.61 | 0.98 | 156.62 | 0.99 | 166.35 | 0.99 | 163.49 | 0.99 | 160.52 | 0.99 | |
| D2 | (1 − α)ln(1 − α) + α | 162.56 | 0.99 | 163.57 | 0.99 | 173.71 | 0.99 | 170.74 | 0.99 | 167.65 | 0.99 | |
| D3 | [1 − (1 − α)1/3]2 | 170.08 | 0.99 | 171.09 | 0.99 | 181.68 | 0.99 | 178.58 | 0.99 | 175.36 | 0.99 | |
| D4 | [1 − (2/3)α] − (1 − α)2/3 | 165.07 | 0.99 | 166.07 | 0.99 | 176.36 | 0.99 | 173.36 | 0.99 | 170.21 | 0.99 | |
| R2 | 1 − (1 − α)1/2 | 78.45 | 0.99 | 78.86 | 0.99 | 84.00 | 0.99 | 82.43 | 0.99 | 80.94 | 0.99 | |
| R3 | 1 − (1 − α)1/3 | 80.32 | 0.99 | 80.72 | 0.99 | 85.97 | 0.99 | 84.38 | 0.99 | 82.85 | 0.99 | |
| II | A2 | [−ln(1 − α)]1/2 | 8.76 | 0.91 | 8.98 | 0.96 | 8.90 | 0.97 | 8.00 | 0.95 | 8.66 | 0.95 |
| A3 | [−ln(1 − α)]1/3 | 2.37 | 0.61 | 2.43 | 0.79 | 2.35 | 0.84 | 1.70 | 0.67 | 2.21 | 0.73 | |
| A4 | [−ln(1 − α)]1/4 | — | — | — | — | — | — | — | — | — | — | |
| F0 | α | 12.82 | 0.89 | 13.20 | 0.94 | 13.15 | 0.96 | 12.07 | 0.94 | 12.81 | 0.93 | |
| F1 | −ln(1 − α) | 27.93 | 0.96 | 28.61 | 0.98 | 28.56 | 0.99 | 26.89 | 0.98 | 28.00 | 0.98 | |
| F2 | [1 − 1/(1 − α)]/−1 | 48.64 | 0.98 | 49.70 | 0.99 | 49.64 | 1.00 | 47.18 | 0.99 | 48.79 | 0.99 | |
| F3 | [1 − 1/(1 − α)2]/−2 | 74.47 | 0.99 | 75.99 | 1.00 | 75.91 | 1.00 | 72.46 | 1.00 | 74.71 | 1.00 | |
| F4 | [1 − 1/(1 − α)3]/−3 | 104.22 | 0.99 | 106.27 | 1.00 | 106.19 | 1.00 | 101.59 | 1.00 | 104.57 | 1.00 | |
| F5 | [1 − 1/(1 − α)4]/−4 | 136.62 | 0.99 | 139.24 | 1.00 | 139.14 | 1.00 | 133.31 | 1.00 | 137.08 | 1.00 | |
| F5.5 | [1 − 1/(1 − α)4.5]/−4.5 | 153.46 | 1.00 | 156.39 | 1.00 | 156.28 | 1.00 | 149.80 | 1.00 | 153.98 | 1.00 | |
| D1 | α2 | 36.07 | 0.94 | 37.07 | 0.97 | 43.18 | 0.95 | 35.02 | 0.97 | 37.83 | 0.96 | |
| D2 | (1 − α)ln(1 − α) + α | 44.41 | 0.96 | 45.58 | 0.98 | 52.11 | 0.96 | 43.22 | 0.98 | 46.33 | 0.97 | |
| D3 | [1 − (1 − α)1/3]2 | 54.97 | 0.97 | 56.35 | 0.99 | 63.24 | 0.97 | 53.58 | 0.99 | 57.04 | 0.98 | |
| D4 | [1 − (2/3)α] − (1 − α)2/3 | 47.90 | 0.96 | 49.14 | 0.98 | 55.79 | 0.97 | 46.64 | 0.98 | 49.87 | 0.97 | |
| R2 | 1 − (1 − α)1/2 | 19.69 | 0.94 | 20.21 | 0.97 | 23.54 | 0.95 | 18.80 | 0.97 | 20.56 | 0.96 | |
| R3 | 1 − (1 − α)1/3 | 22.28 | 0.95 | 22.85 | 0.98 | 26.27 | 0.96 | 21.34 | 0.98 | 23.19 | 0.97 | |
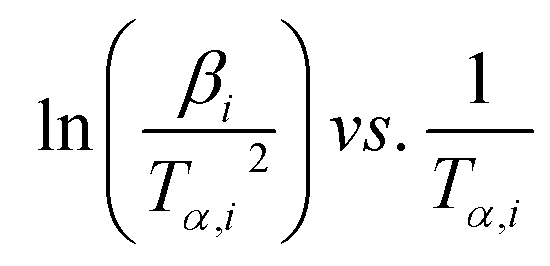
For better linear trend fitting (R2 > 0.97) of data between ln[g(α)/Tα2] against 1/Tα for all four heating rates, the conversion (α) range can be divided into two regions (Fig. 1a), region-I (0.05 ≤ a ≤ 0.5) and region-II (0.51 ≤ α ≤ 0.7). These ranges were based on primary analysis.
Depending on the degradation mechanism, the functional relationship of the function g(α) changes as can be seen from Table 5. As per C–R method, plots between ln[g(α)/Tα2] against 1/Tα were created for various degradation mechanisms to determine the value of E (slope of the linear trend line in Fig. 4a and b) for each of these degradation mechanisms at different heating rates as reported in Table 5. Then the E-values of a given degradation mechanism for all the four heating rates were added to produce an average E-value to be compared with average E-values determined using DAE and Starink methods. As per C–R method, if for a given degradation mechanism, these two average values match well, then the given degradation mechanism is considered to be the prevailing one.
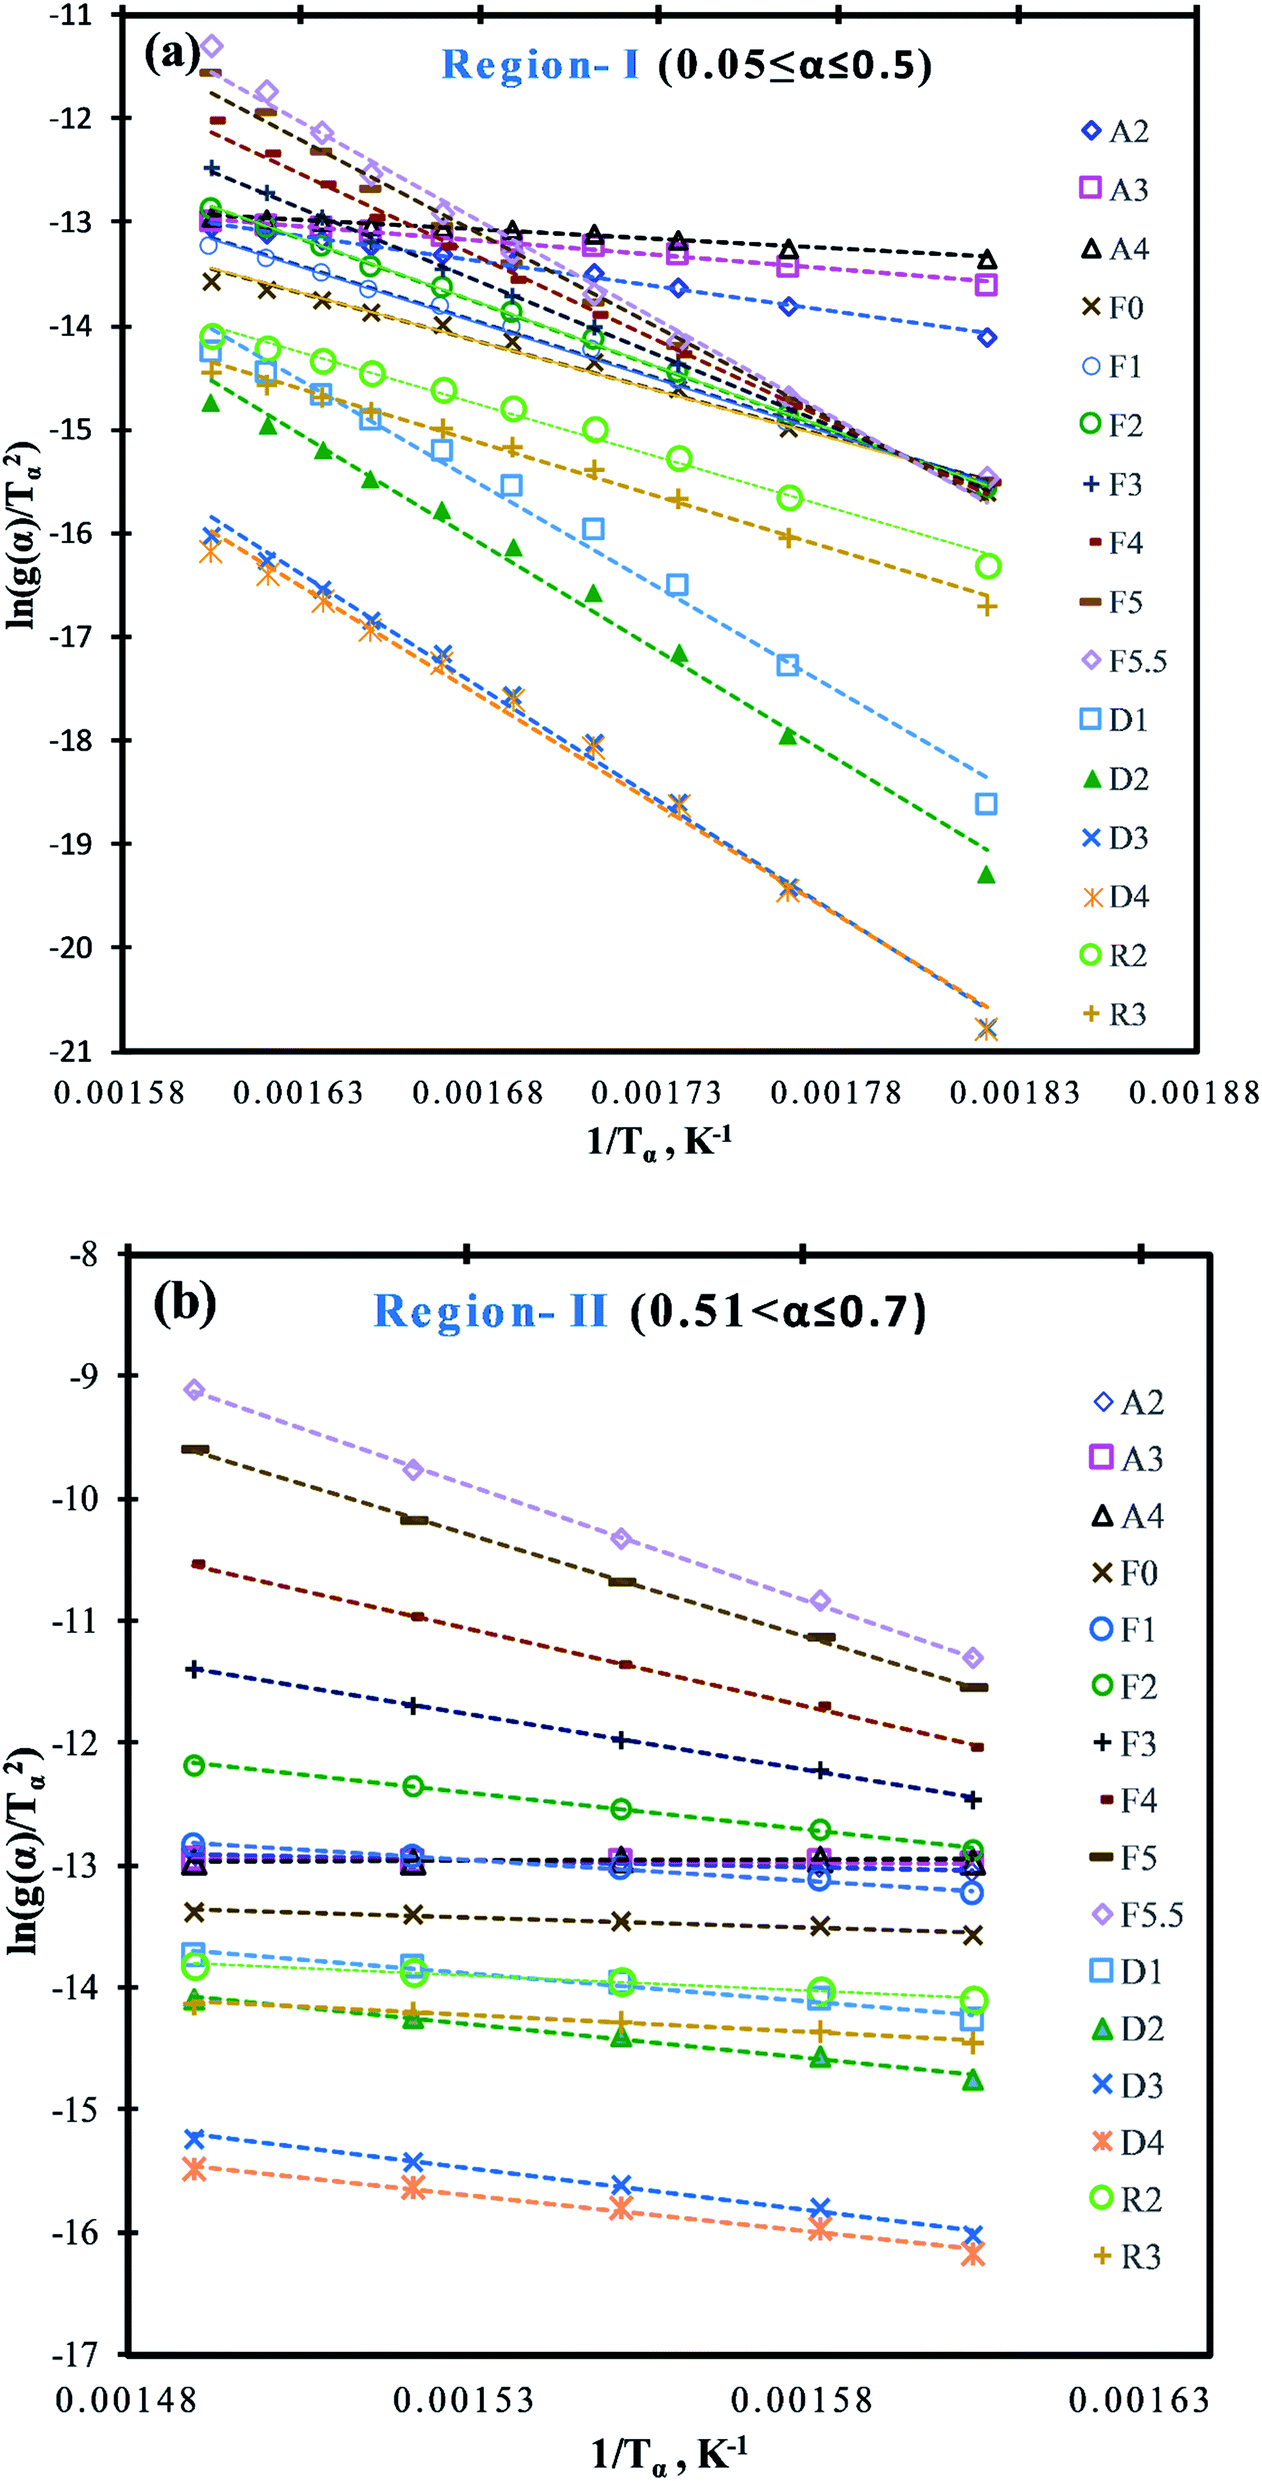 | ||
| Fig. 4 C–R plots for the pyrolysis of MIW; (a) region-I (0.05 ≤ α ≤ 0.5) and (b) region-II (0.51 ≤ α ≤ 0.7). | ||
It is shown from Table 5 that in region-I, the average E-values are different for different reaction mechanisms characterized by different functional relationship of g(α), under all the four different heating rates. For random nucleation (A2, A3, and A4) and contraction geometry (R2 and R3) mechanisms, the average E-values ranged from 14.45 to 38.56 kJ mol−1 and 80.94 to 82.85 kJ mol−1 respectively. Further, for the reaction order model (F0, F1, F2, F3, F4, F5, and F5.5), the average E-values of four heating rates ranged from 75.43 to 154.04 kJ mol−1, whereas in the diffusion model (D1, D2, D3, and D4) these values ranged from 160.52 to 175.36 kJ mol−1 which were closest to the average E-values obtained from DAE (157.12 kJ mol−1) and Starink (157.97 kJ mol−1) methods. Thus it can be safely concluded that diffusion appears to be the rate-determining step for the pyrolysis reaction of MIW at the initial stage (0.05 ≤ α ≤ 0.5), denoted by region-I.
Diffusion based models assume that the reaction rate is higher than reaction front propagation throughout the pyrolysis medium. Accordingly, the pyrolytic degradation reaction occurs at the boundary of the two phases like solid and gas. Therefore, the gas must diffuse into the formed product layer around the sample to reach to the unreacted solid for a reaction to progress and thus makes diffusion the rate-determining step.
Similarly, for region-II (0.51 ≤ α ≤ 0.7) the average E-values for different reaction order models ranged from 12.81 for zeroth order (F0) to 153.98 kJ mol−1 for five and a half order reaction (F5.5) model. However, it can be seen that the E-values obtained from DAE (=151.51 kJ mol−1) and Starink methods (=152.45 kJ mol−1) were close to the five and half order reaction model indicating that region-II is a five and a half order reaction controlled region.
Therefore, the mechanism for the pyrolysis reaction of MIW was one-dimensional diffusion model (D1; region-I: 0.05 ≤ α ≤ 0.5) followed by five and a half order (F5.5; region-II: 0.51 ≤ α ≤ 0.7) reaction, which is proportional to the concentration of reactant(s) in a particular reaction. The reaction mechanism obtained in present work for pyrolysis of MIW is consistent with the earlier research30,42,43 (i.e. for Dalbergia sissoo wood30 it was governed by D3 followed by F3 controlled, for waste tea42 D3 followed by F2, and for four different wood species43 D1,2,3 followed by F1).
3.5 Estimation of thermodynamic parameters
In order to check the feasibility of the pyrolysis reaction, the thermodynamic parameters are essentially needed. The frequency factor, change-in enthalpy, -Gibbs free energy, and -entropy corresponding to the value of α were computed using eqn (8)–(11), respectively for DAE and Starink methods, and the obtained results from the analysis are presented in Table 6 and have been illustrated in Fig. 5a, b, d and e, respectively.| α | DAE method | Starink method | ||||||||||||
|---|---|---|---|---|---|---|---|---|---|---|---|---|---|---|
| Eα, kJ mol−1 | Aα, min−1 | k, min−1 | ΔHα, kJ mol−1 | Energy barrier, kJ mol−1 | ΔGα, kJ mol−1 | ΔSα, J mol−1 K−1 | Eα, kJ mol−1 | Aα, min−1 | k, min−1 | ΔHα, kJ mol−1 | Energy barrier, kJ mol−1 | ΔGα, kJ mol−1 | ΔSα, J mol−1 K−1 | |
| 0.05 | 149.54 | 8.8 × 10¹² | 0.05 | 144.98 | 4.56 | 151.43 | −10.57 | 150.33 | 1.0 × 10¹³ | 0.05 | 145.77 | 4.56 | 151.40 | −9.23 |
| 0.1 | 143.03 | 2.3 × 10¹² | 0.15 | 138.32 | 4.71 | 151.66 | −21.83 | 143.84 | 2.8 × 10¹² | 0.15 | 139.13 | 4.71 | 151.63 | −20.45 |
| 0.15 | 145.43 | 3.8 × 10¹² | 0.25 | 140.64 | 4.79 | 151.57 | −17.90 | 146.25 | 4.5 × 10¹² | 0.25 | 141.46 | 4.79 | 151.54 | −16.51 |
| 0.2 | 144.20 | 3.0 × 10¹² | 0.38 | 139.34 | 4.86 | 151.62 | −20.09 | 145.04 | 3.5 × 10¹² | 0.38 | 140.18 | 4.86 | 151.59 | −18.66 |
| 0.25 | 153.03 | 1.8 × 10¹³ | 0.56 | 148.11 | 4.92 | 151.31 | −5.25 | 153.88 | 2.1 × 10¹³ | 0.56 | 148.96 | 4.92 | 151.29 | −3.81 |
| 0.3 | 160.68 | 8.5 × 10¹³ | 0.83 | 155.70 | 4.98 | 151.07 | 7.58 | 161.53 | 1.0 × 10¹⁴ | 0.83 | 156.55 | 4.98 | 151.04 | 9.02 |
| 0.35 | 168.79 | 4.4 × 10¹⁴ | 1.26 | 163.75 | 5.04 | 150.82 | 21.17 | 169.65 | 5.2 × 10¹⁴ | 1.27 | 164.61 | 5.04 | 150.79 | 22.62 |
| 0.4 | 175.59 | 1.7 × 10¹⁵ | 1.72 | 170.51 | 5.08 | 150.62 | 32.56 | 176.46 | 2.1 × 10¹⁵ | 1.73 | 171.38 | 5.08 | 150.59 | 34.02 |
| 0.45 | 170.17 | 5.8 × 10¹⁴ | 2.28 | 165.04 | 5.13 | 150.77 | 23.35 | 171.05 | 7.0 × 10¹⁴ | 2.30 | 165.92 | 5.13 | 150.75 | 24.83 |
| 0.5 | 160.78 | 8.7 × 10¹³ | 2.88 | 155.60 | 5.18 | 151.06 | 7.42 | 161.68 | 1.0 × 10¹⁴ | 2.91 | 156.50 | 5.18 | 151.03 | 8.94 |
| 0.55 | 151.72 | 1.4 × 10¹³ | 3.96 | 146.47 | 5.25 | 151.36 | −8.01 | 152.64 | 1.7 × 10¹³ | 4.01 | 147.39 | 5.25 | 151.33 | −6.45 |
| 0.6 | 144.99 | 3.5 × 10¹² | 6.05 | 139.64 | 5.35 | 151.59 | −19.56 | 145.93 | 4.2 × 10¹² | 6.15 | 140.58 | 5.35 | 151.56 | −17.97 |
| 0.65 | 143.03 | 2.3 × 10¹² | 9.95 | 137.57 | 5.46 | 151.66 | −23.06 | 144.00 | 2.8 × 10¹² | 10.15 | 138.54 | 5.46 | 151.63 | −21.42 |
| 0.7 | 157.04 | 4.0 × 10¹³ | 24.32 | 151.46 | 5.58 | 151.18 | 0.45 | 158.02 | 4.9 × 10¹³ | 24.90 | 152.44 | 5.58 | 151.15 | 2.11 |
 | ||
| Fig. 5 (a) Pre-exponential factor with conversion during MIW pyrolysis, (b) change in enthalpy with conversion during MIW pyrolysis, (c) energy barrier over the range of conversion, (d) change in Gibbs free energy with conversion, (e) change in entropy with conversion, (f) reaction rate constant with conversion. | ||
The frequency factor (Aα) for each value of a were computed using eqn (8) and found to vary from 2.3 × 10¹² min−1 to 1.7 × 10¹⁵ min−1 for DAE and 2.8 × 10¹² min−1 to 2.1 × 10¹⁵ min−1 for Starink methods for α value varying from 0.1 (around 293 °C) to 0.4 (around 338 °C). It is a fact that if Aα < 109 min−1, it is considered as low and often indicates less surface reactivity of the system.44 In present case, higher Aα values were noticed for 0.3 ≤ α ≤ 0.5 (from 8.5 × 10¹³ min−1 to 2.1 × 10¹⁵ min−1), which corresponds to the temperature range of 326–350 °C, indicating high surface reactivity of MIW particle along with formation of a simple activated complex.45 From Fig. 5a and Table 6, the value of Aα was relatively lower at hemicellulose shoulder (at α = 0.25, T = 320 °C, Aα = 1.8 × 10¹³ or 2.1 × 10¹³ min−1) than the main peak of cellulose (at α = 0.4, T = 338 °C, Aα = 1.7 × 10¹⁵ or 2.1 × 10¹⁵ min−1) for the pyrolysis of MIW, indicating a comparative lower rate of molecular collisions for the hemicellulose component.
Fig. 5b shows that all values of ΔHα are positive. This indicates the endothermic nature of the pyrolysis reaction. The highest and lowest values of ΔHα recorded were 171.38 kJ mol−1 at α = 0.4 (338 °C) and 137.57 kJ mol−1 at α = 0.65 (384 °C), respectively. The highest and lowest positive value of ΔHα attributes to the maximum and minimum dissociation of MIW during its pyrolysis at 338 °C and 384 °C, respectively and it is also evident from DTG thermogram of MIW (Fig. 1b). The ΔHα value increased for α from 0.2 to 0.4 and 0.65 to 0.7 indicating an increase in endothermicity of MIW pyrolysis in these ranges. However, for other ranges of α such as 0.05 to 0.1 and 0.4 to 0.65, it gradually decreased indicating a comparative decrease in endothermicity of reaction in these ranges. For α ranging from 0.05 to 0.7, the average ΔH values determined by DAE and Starink methods were 149.79 and 150.67 kJ mol−1. For the present case, values of ΔHα and activation energy (Eα) values followed the same trend. This trend is similar to the trends observed for pyrolysis process of lignocellulosic biomass, such as castor residue46 and garlic stalk.47 The difference between ΔHα and Eα corresponds to the energy barriers (EB) for the formation of activated complex for the reactants.48 A reaction having a higher energy barrier requires a higher temperature to be conducted. In the present case, the energy barrier for reaction increases (from 4.56 to 5.58 kJ mol−1) as evident from Fig. 5c when conversion increases from 0.05 to 0.7. During this, the temperature also increases from 276 to 398 °C and thus helps to overcome the energy barrier of required for the reactions to take place. The small value of EB (≈5.06 kJ mol−1) during complete reaction period indicates that small amount of energy is required to form the activated complex, indicating that the product formation would be easier to achieve and thus bioenergy production through pyrolysis of MIW will be easier.
Further, the degree of stability of a system may be estimated by the value of change in Gibbs free energy (ΔG). The higher values indicate the harder reactivity and thus more energy will be absorbed by the system during the whole reaction process, and lower values indicate that the product can be produced with lower energy supply because of its reactive nature. Fig. 5d depicts the change in Gibbs free energy (ΔGα) computed by DAE and Starink methods. In the present case, all ΔGα values are positive indicating a non-spontaneous behavior of the pyrolytic process which consumes a considerable amount of energy to occur. The ΔGα values varied with the conversion rate (0.05 ≤ α ≤ 0.7), indicating that the system passed through ups and downs of the degree of difficulty [Fig. 5d; 0.05–0.1 (up), 0.1–0.15 (down), 0.15–0.2 (up), 0.2–0.4 (down), 0.4–0.65 (up), 0.65–0.7 (down)] for the MIW pyrolysis. The average values of ΔG were computed as 151.27 and 151.24 kJ mol−1 for DAE and Starink methods.
The entropy, being a state function, is an index to indicate degree of randomness or disorderness associated with the reaction system. The change of reaction entropy (ΔSα) reflects how near the system is to its own thermodynamic equilibrium. The lower value of entropy (ΔSα) signifies that the reactive system is approaching to its own thermodynamic equilibrium state. In this case, the substance shows low reactivity and thus, takes more reaction time to form the activated complex.49 On the other hand, a large value of ΔSα means the system is far from its thermodynamic equilibrium. In this case, the reactivity of material is high, and the reaction system will react faster to produce activated complex, and consequently, takes short reaction time to form the activated complex. For MIW pyrolysis, the ΔSα values were found both positive as well as negative. The ΔSα values were negative for each value of conversion (α) except α ranging from 0.3 to 0.5 (Fig. 5e).
Pyrolysis is a complex process and is governed by a set of parallel, complex and competitive reactions taking place simultaneously which involve the disintegration of natural polymers (hemicellulose, cellulose, and lignin) within the biomass material as well as integration of smaller molecules to form bigger molecules with the increase in temperature. The entropy of the system increases when bulky polymer molecules break to form a large number of volatiles/gas molecules and decrease when the smaller molecules combine to create a larger molecule during the pyrolysis process. The increment in ΔSα values for conversion from 0.2 to 0.4 (311 to 338 °C) was largely due to the formation of a large number of molecules, owing to the simultaneous dissociation of hemicellulose, cellulose and lignin molecules.50 The increment in ΔSα values for above conversion range shows increase in reactivity which is supported by the fact that in this range ΔGα values decrease monotonously indicating decrease in endothermicity of reaction. For, above conversion range, the increase in activation energy (Eα) and ΔHα values show an increase in EB values as well as endothermicity of the reactive system. It is indicative of the fact that the system absorbs large amount of energy for dissociation of larger molecules in this range for which the entropy of the system has increased. After the above conversion range, the system entropy decreases up to a conversion value of 0.65 (384 °C), which is indicative of the association of small molecules to form product molecules within the reactive system.44 This is consistent with the decrease in ΔHα values that show a decrement in endothermicity of the reactive system. This supports the fact that in this region the entropy of the system decreases due to the dominance of reaction in which association of molecules takes place. In this range, EB slightly increases which is taken care of by the rising temperature.
For the conversion range (0.05 ≤ α ≤ 0.7), the maximum negative value of ΔSα was −23.06 J mol−1 K−1 for DAE method at α = 0.65 and maximum positive value of 34.02 J mol−1 K−1 for Starink method at a = 0.4 (Table 6). This indicates that the system was in the highest state of stability at conversion value 0.65 (T = 384 °C) and most reactive around conversion value of 0.4 (T = 338 °C). It is interesting to see that the value of ΔGα around conversion value 0.65 is also highest (Fig. 5d and Table 6) indicating that the endothermicity is very high and thus conducting reaction is difficult. Also around α = 0.4, the Aα vs. α plot (Fig. 5a) showed the highest peaks, confirming that the system was most reactive around the conversion value at 0.4 which is also confirmed by DTG plot shown in Fig. 1b. For the rest of the conversion points, the negative value of ΔSα reflects that activated complex needs comparatively more thermal energy to propagate the reaction in the forward direction or we can say that more or less the thermal equilibrium has been reached and a thermally stable product has been produced.51 This statement are in accordance of the lower values of Aα as demonstrated in Aα vs. α plot (Fig. 5a), confirming the less reactivity of the system in the conversion range from 0.05 ≤ α < 0.3 and further for 0.5 < α ≤ 0.7.
The reaction rate constant (k) was computed using the Arrhenius correlation and found to be continuously increasing with conversion value up to 0.7 (Fig. 5f). The lowest and highest value of the rate constant for the pyrolysis of MIW was estimated to be ranged from 0.05 to 24.90 min−1. It was expected as the temperature continuously increased in the range 0.05 ≤ α ≤ 0.7 and reaction rate constant is a strong function of temperature.
4 Conclusions
The following salient conclusions can be drawn from the present investigation:1. The characterization for as-received MIW revealed high volatile content, fixed carbon, and higher heating value as 73.38 mass%, 15.09 mass%, and 14.89 MJ kg−1, respectively. Further, no sulfur was detected in MIW sawdust.
2. There was no major discrepancy in apparent activation energy values computed by DAE (154.86 kJ mol−1) and Starink (155.74 kJ mol−1) methods.
3. The reaction mechanism for the pyrolysis of MIW can be classified as one-dimensional diffusion type (D1; g(α) = α2) for 5–50% conversion followed by five and a half order (F5.5; g(α) = [1 − 1/(1 − α)4.5]/−4.5) heterogeneous rate expression up to the rest conversion value of 70%.
4. The average values of A, ΔH and ΔG obtained were 2.2 × 10¹⁴ min−1, 149.79 kJ mol−1 and 151.27 kJ mol−1 for DAE method and 2.6 × 10¹⁴ min−1, 150.67 kJ mol−1 and 151.24 kJ mol−1 for Starink method, respectively.
Nomenclature
| α | Conversion or reaction progress, dimensionless |
| β | Heating rate, °C min−1 |
| Ea | Apparent activation energy, kJ mol−1 |
| Eα | Activation energy at conversion α, kJ mol−1 |
| A | Frequency factor, min−1 |
| k | Reaction rate constant, min−1 |
| n | Order of reaction, dimensionless |
| R | Universal gas constant, kJ mol−1 K−1 |
| T | Temperature, K in all equations and °C elsewhere |
| p(x) | Exponential/temperature integral approximation |
| f(α) | Differential form of reaction model |
| g(α) | Integral form of reaction model |
| R2 | Correlation coefficient, dimensionless |
Abbreviations
| MIW | Mangifera indica wood |
| TG | Thermogravimetric analysis/thermogravimetry |
| DTG | Derivative thermogravimetry |
| DAE | Distributed activation energy |
| C–R | Coats–Redfern |
| ASTM | American Society for Testing and Materials |
| HHV | Higher heating value or gross calorific value |
| LHV | Lower heating value or net calorific value |
| EB | Energy barrier |
Conflicts of interest
There are no conflicts to declare.Acknowledgements
The current research work in the Department of Chemical Engineering, Indian Institute of Technology Roorkee, Roorkee, India, has been financially supported by the Ministry of Education (MoE), Government of India, New Delhi.References
- M. Parikka, Biomass Bioenergy, 2004, 27, 613–620 CrossRef.
- A. Sharma and B. Mohanty, Int. J. Energy Res., 2021, 1–15 Search PubMed.
- S. Shrivastava and A. K. Saxena, Wood is good: But, is India doing enough to meet its present and future needs? Centre for Science and Environment, New Delhi, 2017 Search PubMed.
- B. Ling, J. Tang, F. Kong, E. J. Mitcham and S. Wang, Food Bioprocess Technol., 2015, 8, 343–358 CrossRef CAS.
- S. Vyazovkin and N. Sbirrazzuoli, Macromol. Rapid Commun., 2006, 27, 1515–1532 CrossRef CAS.
- M. Labus and I. Matyasik, J. Therm. Anal. Calorim., 2019, 136, 1185–1194 CrossRef CAS.
- B. Saha, A. K. Maiti and A. K. Ghoshal, Thermochim. Acta, 2006, 444, 46–52 CrossRef CAS.
- E. Müsellim, M. H. Tahir, M. S. Ahmad and S. Ceylan, Appl. Therm. Eng., 2018, 137, 54–61 CrossRef.
- X. Xu, R. Pan, P. Li and R. Chen, Appl. Biochem. Biotechnol., 2020, 191, 1605–1623 CrossRef CAS PubMed.
- S. A. Channiwala and P. P. Parikh, Fuel, 2002, 81, 1051–1063 CrossRef CAS.
- P. Basu, Biomass gasification and pyrolysis, practical design and theory, 2010 Search PubMed.
- S. Li, S. Xu, S. Liu, C. Yang and Q. Lu, Fuel Process. Technol., 2004, 85, 1201–1211 CrossRef CAS.
- A. Sharma and B. Mohanty, Energy Sources, Part A, 2020, 42, 1–18 CrossRef.
- O. Bianchi, J. D. N. Martins, R. Fiorio, R. V. B. Oliveira and L. B. Canto, Polym. Test., 2011, 30, 616–624 CrossRef CAS.
- J. Li, C. Zhang, R. Yin and W. Zhang, RSC Adv., 2019, 9, 8415–8425 RSC.
- M. J. Starink, Thermochim. Acta, 2003, 404, 163–176 CrossRef CAS.
- A. W. Coats and J. P. Redfern, Nature, 1964, 201, 68–69 CrossRef CAS.
- A. Khawam and D. R. Flanagan, J. Phys. Chem. B, 2006, 110, 17315–17328 CrossRef CAS PubMed.
- J. M. Criado, J. Málek and A. Ortega, Thermochim. Acta, 1989, 147, 377–385 CrossRef CAS.
- L. Núñez, F. Fraga, M. R. Núñez and M. Villanueva, Polymer, 2000, 41, 4635–4641 CrossRef.
- M. U. H. Joardder, M. S. Uddin and M. N. Islam, Adv. Mech. Eng., 2011, 2012, 316806 Search PubMed.
- K. Parmar, IRA Int. J. Appl. Sci., 2017, 7, 42 CAS.
- B. Cagnon, X. Py, A. Guillot, F. Stoeckli and G. Chambat, Bioresour. Technol., 2009, 100, 292–298 CrossRef CAS.
- J. Zhang, T. Chen, J. Wu and J. Wu, RSC Adv., 2014, 4, 17513–17520 RSC.
- J. J. A. Flores, J. G. R. Quiñones, M. L. Á. Rodríguez, J. V. A. Vera, J. E. Valencia, S. J. G. Martínez, F. M. Montesino and A. A. Rosas, Energies, 2020, 13, 969 CrossRef CAS.
- K. Slopiecka, P. Bartocci and F. Fantozzi, Appl. Energy, 2012, 97, 491–497 CrossRef CAS.
- Z. Chen, Q. Zhu, X. Wang, B. Xiao and S. Liu, Energy Convers. Manage., 2015, 105, 251–259 CrossRef CAS.
- A. Soria-Verdugo, M. T. Morgano, H. Mätzing, E. Goos, H. Leibold, D. Merz, U. Riedel and D. Stapf, Energy Convers. Manage., 2020, 212, 112818 CrossRef.
- R. K. Mishra and K. Mohanty, Bioresour. Technol., 2018, 251, 63–74 CrossRef CAS PubMed.
- A. Sharma and B. Mohanty, J. Therm. Anal. Calorim., 2020, 141, 1–15 CrossRef.
- X. Xu, R. Chen, R. Pan and D. Zhang, Energy Fuels, 2020, 34, 1859–1869 CrossRef CAS.
- P. Ghodke and R. N. Mandapati, Fuel, 2019, 236, 1008–1017 CrossRef CAS.
- A. K. Varma and P. Mondal, Energy Sources, Part A, 2016, 38, 2536–2544 CrossRef CAS.
- A. Garcia-Maraver, J. A. Perez-Jimenez, F. Serrano-Bernardo and M. Zamorano, Renewable Energy, 2015, 83, 897–904 CrossRef.
- H. Alhumade, J. C. G. da Silva, M. S. Ahmad, G. Çakman, A. Yıldız, S. Ceylan and A. Elkamel, J. Anal. Appl. Pyrolysis, 2019, 140, 385–392 CrossRef CAS.
- X. Zhang, W. Yang and W. Blasiak, Energy Fuels, 2011, 4786–4795 CrossRef CAS.
- J. Zhang, Y. S. Choi and C. G. Yoo, ACS Sustainable Chem. Eng., 2015, 3, 293–301 CrossRef CAS.
- F. X. Collard and J. Blin, Renewable Sustainable Energy Rev., 2014, 38, 594–608 CrossRef CAS.
- K. Werner, L. Pommer and M. Broström, J. Anal. Appl. Pyrolysis, 2014, 110, 130–137 CrossRef CAS.
- A. Chandrasekaran, S. Ramachandran and S. Subbiah, Bioresour. Technol., 2017, 233, 413–422 CrossRef CAS PubMed.
- Z. Ma, D. Chen, J. Gu, B. Bao and Q. Zhang, Energy Convers. Manage., 2015, 89, 251–259 CrossRef CAS.
- H. Cai, J. Liu, W. Xie, J. Kuo, M. Buyukada and F. Evrendilek, Energy Convers. Manage., 2019, 184, 436–447 CrossRef CAS.
- M. Poletto, A. J. Zattera and R. M. C. Santana, Bioresour. Technol., 2012, 126, 7–12 CrossRef CAS PubMed.
- Y. F. Chang, NeuroQuantology, 2013, 11, 189–196 Search PubMed.
- X. Yuan, T. He, H. Cao and Q. Yuan, Renewable Energy, 2017, 107, 489–496 CrossRef CAS.
- R. Kaur, P. Gera, M. K. Jha and T. Bhaskar, Bioresour. Technol., 2018, 250, 422–428 CrossRef CAS PubMed.
- R. K. Singh, T. Patil and A. N. Sawarkar, Bioresour. Technol. Rep., 2020, 12, 100558 CrossRef.
- L. T. Vlaev, V. G. Georgieva and S. D. Genieva, J. Therm. Anal. Calorim., 2007, 88, 805–812 CrossRef CAS.
- R. Kaur, P. Gera, M. K. Jha and T. Bhaskar, Bioresour. Technol., 2018, 250, 422–428 CrossRef CAS PubMed.
- H. Yang, R. Yan, H. Chen, D. H. Lee and C. Zheng, Fuel, 2007, 86, 1781–1788 CrossRef CAS.
- A. Shahid, M. Ishfaq, M. S. Ahmad, S. Malik, M. Farooq, Z. Hui, A. H. Batawi, M. E. Shafi, A. A. Aloqbi, M. Gull and M. A. Mehmood, Bioresour. Technol., 2019, 289, 121701 CrossRef CAS.
| This journal is © The Royal Society of Chemistry 2021 |