 Open Access Article
A label-free electrochemical biosensor based on 3D cubic Eu3+/Cu2O nanostructures with clover-like faces for the determination of anticancer drug cytarabine
Mohammad Mehdi Foroughi *a,
Shohreh Jahani
 b,
Zahra Aramesh-Broujenic and
Meisam Rostaminasab Dolatabadd
aDepartment of Chemistry, Islamic Azad University, Kerman Branch, Kerman, Iran. E-mail: foroughi@iauk.ac.ir; Tel: +98 34331321750
bNoncommunicable Diseases Research Center, Bam University of Medical Sciences, Bam, Iran
cDepartment of Clinical Laboratory, AlZahra Hospital, Isfahan University of Medical Sciences, Isfahan, Iran
dDepartment of Medical Science, Islamic Azad University, Kerman Branch, Kerman, Iran
First published on 13th May 2021
Abstract
The present research utilized a simplified procedure for developing a novel electro-chemical DNA biosensor based on a carbon paste electrode (CPE) modified with three-dimensional (3D) cubic Eu3+/Cu2O nanostructures with clover-like faces (Eu3+/Cu2O CLFNs). The modified electrode was applied to monitor electro-chemical interactions between dsDNA and cytarabine for the first time. Then, the decreased oxidation signal of guanine following the interactions between cytarabine and dsDNA was utilized as an indicator for selectively determining cytarabine using differential pulse voltammetry (DPV). According to the findings, the oxidation peak current of guanine was linearly proportionate with the cytarabine concentration in the range between 0.01 and 90 μM. Additionally, the limit of quantification (LOQ) and the limit of detection (LOD) respectively equaled 9.4 nM and 2.8 nM. In addition, the repeatability, applicability and reproducibility of this analysis to drug dosage forms and human serum samples were investigated. Furthermore, UV-vis spectroscopy, DPV, docking and viscosity measurements were applied to elucidate the interaction mechanism of dsDNA with cytarabine. It was found that this DNA biosensor may be utilized to sensitively, accurately and rapidly determine cytarabine.
1. Introduction
A major therapeutic method of cancer is chemotherapy, in which low molecular weight medicines are utilized to limit the proliferation or rapid growth of tumour cells.1 Therefore, cytostatic drugs (CDs) that maintain their chemical structures in the long term have been developed. These drugs are capable of direct or indirect interaction with DNA and alteration of its structure.2 Hence, they have greater susceptibility to aquatic organisms by exerting genotoxic, teratogenic, and mutagenic impacts. Compared to other drug compounds, CDs show lower concentrations (ng to mg L−1) in the environment. However, a majority of these drugs have higher biochemical and photochemical stability in water bodies; therefore, they are among the most persistent pollutants.3 Moreover, incomplete mineralization of CDs and metabolites of their parent compounds may be involved in the aquatic environment.4 For example, cytarabine (CBN) is an anti-cancer medicine that has been categorized as an anti-metabolite. In fact, it is a structural analogue of purine and pyrimidine bases, and its functional principle is considered to be the obstruction of the growth of unregulated cancer cells via interference with the DNA synthesis of the cells.5Consequently, experts in the field have been mainly attracted by DNA bio-sensors for developing novel procedures to determine several prominent molecules, such as drugs, pathogens and organic dyes.6–8 In addition, electro-chemical DNA bio-sensors are made by immobilizing DNA over the surface of an electrode.9 Moreover, researchers have significantly focused on the electrochemical examination of DNA and its interaction with medicines for their fast, convenient and reliable determination.10 Additional, direct supervision of the modifications in the electro-chemical features of DNA, such as guanine and adenine oxidation, results in the detection of interactions between tiny molecules and the DNA over the surface of the electrode.11,12 Furthermore, electro-chemical procedures raise difficulties in detecting nucleic bases, such as slower electron transfer kinetics, higher overpotential and overlapping of their oxidation peaks. To resolve these problems, it is useful to apply chemically modified electrodes.13–17 On the one hand, for modification of biosensors, nano-materials are usually utilized because of their superior catalytic features and higher electrical conductivity. Consequently, more active sites and considerable functional groups on the surface of nano-materials result in higher activities for catalysis and adsorption.18–34
One significant kind of metal oxide semi-conductor is cuprous oxide (Cu2O), which enjoys several benefits, such as nontoxicity, adjustable size, affordability, quick response and recovery rates, and particular electrical and optical features. Moreover, cuprous oxides have widespread utilization in producing sensors, superconductors, and catalytic and solar cells.35
Cu2O is considered to be a very good catalyst material in electro-catalysis; its catalytic capacity will be influenced by the respective morphology because structure-associated bandgap energy is essential for improving its performance. For instance, Cu2O with various morphologies, from cuboctahedra and truncated octahedra to octahedra, showed diverse o-chlorophenol catalytic capabilities.36 Additionally, it is possible to easily tune the morphological, optical, electrical, and magnetic characteristics of metal oxide nanostructures by reinforcing them with transition and rare earth elements.37–39
Molecular recognition, including enzyme–substrate, drug–nucleic acid, drug–protein, protein–nucleic acid, and protein–protein interactions, plays an essential role in many biological processes, such as signal transduction, cell regulation, and other macromolecular assemblies. Therefore, determining the binding mode and affinity between the constituent molecules in molecular recognition is crucial to understanding the interaction mechanisms and to designing therapeutic interventions. Due to the difficulties and economic cost of the experimental methods for determining the structures of complexes, computational methods such as molecular docking are desired to predict putative binding modes and affinities. In molecular docking, based on the DNA structure, thousands of possible poses of the association are tried and evaluated; the pose with the lowest energy score is predicted as the “best match”, i.e., the binding mode.40
The present research reports a simplified and surfactant-free technique to fabricate 3D cubic Eu3+/Cu2O nano-structures with clover-like faces (Eu3+/Cu2O CLFNs) while preserving its morphology. Herein, we thoroughly describe structural and morphological assessments that may be advantageous for additional examinations and promising for intended architectures in the coming years. Furthermore, simplified Eu3+/Cu2O CLFNs-modified CPE (Eu3+/Cu2O CLFNs/CPE) was procured and dsDNA immobilization was performed over the surface of Eu3+/Cu2O CLFNs/CPE via an adsorption technique in ABS at a pH of 4.8. This new DNA bio-sensor (dsDNA/Eu3+/Cu2O CLFNs/CPE) was initially utilized to electrochemically determine cytarabine. Moreover, the present selective and sensitive electro-chemical DNA bio-sensor displayed wider linear ranges and lower LODs to detect cytarabine, which was carried out based on modifications in the guanine signal. Consequently, the interaction mechanisms of dsDNA with cytarabine were explored via UV-vis spectroscopy, DPV, docking studies, and viscosity measurements. Ultimately, this new DNA bio-sensor was substantially utilized to detect cytarabine in drug formulations and human sera specimens.
2. Experimental
2.1. Materials
The chosen purchased Sigma-Aldrich chemicals were double-stranded fish sperm DNA (dsDNA), CH3COOH, Tris–HCl, EDTA, CH3COONa, NaOH, NaCl, PVP, CuCl2·2H2O, Na3C6H5O7, K2CO3 and cytarabine hydrochloride. Additionally, EuCl3·6H2O was provided by Merck. Each material was of analytical grade with increased purity.The salmon-sperm dsDNA was obtained from stock solution (100 mg L−1) in Tris–HCl buffer at a pH of 7.2) and stored in the frozen state. Afterwards, more diluted solutions of dsDNA were prepared with an acetate buffer solution at a pH of 4.8 containing 0.02 M NaCl.
After that, 1.0 mM stock solution of cytarabine was procured via dissolution of a precisely weighed amount of cytarabine, and consequently, a cytarabine working solution for the voltammetric analyses was obtained via diluting the stock with acetate buffer at a pH of 4.8 which contained 0.02 M NaCl. According to the research design, all measurements were performed at room temperature.
2.2. Apparatus
A Philips analytical PC-APD X-ray diffractometer and Kα radiation (α2, λ2 = 1.54439 Å), graphite mono-chromatic Cu radiation (α1, λ1 = 1.54056 Å) were utilized for the X-ray powder diffraction (XRD) to demonstrate the organization of the product. Subsequently, SEM and energy-dispersive X-ray spectroscopy (KYKY and EM 3200) were applied to observe the Eu3+/Cu2O CLFNs. Moreover, EIS, and DPV were employed on a SAMA 500 electro-analyzer with a 3-electrode system that contained a platinum counter electrode, Ag/AgCl reference electrode, and carbon paste working electrode. Finally, a pH meter (pHS-3C; Shanghai REX Instrument Factory, China) was employed for pH value measurements, and each test was performed at room temperature (ca. 25 °C).In this stage, a Shimadzu 1700 (Pharma Spec) double-beam spectro-photometer (Shimadzu Corporation; Tokyo: Japan) was used with quartz cuvettes of 1 cm path length at the room temperature in the wavelength range of 200 nm to 500 nm UV-vis for obtaining adsorption spectra. These spectra were registered for dsDNA–cytarabine and free dsDNA to compute the binding constant of the reaction of cytarabine with dsDNA.
Additionally, an Ubbelohde viscometer at 25 ± 0.1 °C in a thermo-static water-bath was used for the viscosity tests. Therefore, the cytarabine concentration in the ranges between 0 mg L−1 and 30 mg L−1 was added to the viscometer for a specific molar ratio of cytarabine to dsDNA. Thus, the dsDNA concentration was constant at 30 mg L−1. Following the addition of cytarabine, we left the solution undisturbed to reach thermal equilibrium and waited for sixty minutes. Afterwards, the specimen flow-time via capillary was gauged with a digital chrono-meter, and the relative viscosity values of dsDNA were computed by eqn (1) in the presence and absence of cytarabine:
| η/η0 = (t − t0)/(tdsDNA − t0) | (1) |
2.3. Synthesis of 3D cubic Eu3+/Cu2O nanostructures with clover-like faces
Eu3+/Cu2O CLFNs were synthesized via a hydrothermal approach. 10.0 mL PVP (0.30 g) solution, 10.0 mL solution of europium chloride (0.01 M, EuCl3·6H2O), and 10.0 mL solution of cupric chloride (0.2 M, CuCl2·2H2O) were combined to synthesize the Cu2O/Eu3+ CLFNs and then dissolved in 70.0 mL deionized water. Afterwards, the mixture was shaken for 10 min; then, 10.0 mL solution of trisodium citrate (0.6 M, Na3C6H5O7) and 10.0 mL solution of potassium carbonate (1.0 M, K2CO3) were dropped in the mixture under constant stirring. After the abovementioned mixture became blue, a mixture of 10.0 mL glucose (1.0 M) was added, and the mixture was stirred for 5 min.Afterwards, the obtained solution was transferred with a Teflon liner into a 150.0 mL autoclave. The autoclave was sealed and maintained for 2 h at 80 °C. Finally, after this reaction, the autoclave was cooled to room temperature. The centrifugation procedure was applied to collect the product. Then, the product was repeatedly washed with ethanol and dried subsequently for 8 hours at a temperature of 80 °C.
2.4. Preparing the electrode
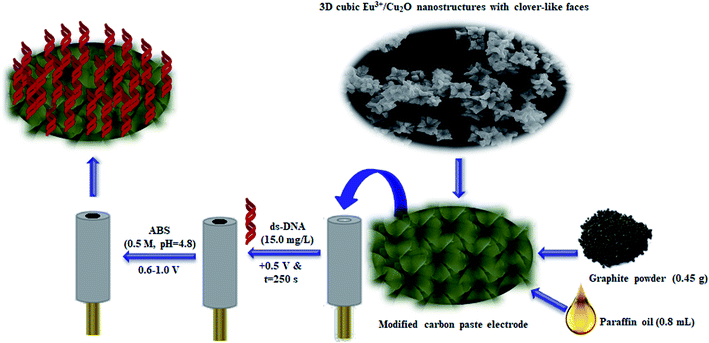
A mixture of 0.8 mL paraffin oil and 0.45 g graphite powder was used to prepare 0.50 g of paste; then, the paste was pressed into a glassy tube to procure the CPEs. After that, we placed a copper wire on it from the opposite end of the tube to cast it as a conductor. Additionally, we smoothed the CPE surface by rubbing its outer surface on a paper segment before it was used. Then, we prepared modified CPEs, such as Eu3+/Cu2O CLFNs/CPE and Cu2O CLFNs/CPE, with the same technique and added 0.05 g of Eu3+/Cu2O CLFNs as well as 0.05 g of Cu2O CLFNs to the two electrodes (Scheme 1).2.5. Immobilizing the dsDNA on the surface of the modified CPE
In order to immobilize the dsDNA at the Eu3+/Cu2O CLFNs/CPE surface, the modified CPE in the shaken 15.0 mg L−1 dsDNA was submerged, and a potential of +0.50 V was applied for 250 seconds. Next, we employed acetate buffer solution at a pH of 4.8 to wash the dsDNA-modified CPE (dsDNA/Eu3+/Cu2O CLFNs/CPE) to remove the un-bonded dsDNA. Afterwards, dsDNA/Eu3+/Cu2O CLFNs/CPE was submerged in 0.5 M acetate buffer solution at a pH of 4.8. Then, the potential from +600 to +1000 mV was scanned to register the guanine oxidation current (Scheme 1).2.6. Electro-chemical measurements
CV of the various modified electrodes was performed in a redox probe solution consisting of 5 mM Fe(CN)63−/4− with 0.1 M KCl via scanning of the potentials between −0.5 and +0.9 V at a 50 mV s−1 scan rate. Moreover, EIS measurements were registered in the redox probe solution at a potential equal to +0.20 V in the frequency range from 0.1 Hz to 100 kHz based on 10 mV amplitude.According to the research design, DPV measurements were registered to detect dsDNA as well as to study the drug–DNA bio-interactions in ABS at a pH of 4.8 for measuring the guanine oxidation signal via scanning the potential from +0.40 to +1.20 V at a pulse amplitude of 50 mV and a 50 mV s−1 scan rate. Finally, the anodic current relative to guanine oxidation of +1.0 V (versus SCE) was used as the analytical signal.
2.7. Molecular docking
Crystal structures of the DNA duplex (entry codes 1BNA and a dodecamer with the sequence d(CGCGAATTCGCG)2) were downloaded from the Brookhaven protein data bank. Optimization of the structure was computed with Gaussian 09 at the 6-31 G** level using B3LYP hybrid-density functional theory (DFT) to provide the most stable geometry of cytarabine. Moreover, Auto-dock 4.2.6 was utilized with a semi-flexible docking procedure, and each cytarabine bond was set as free whereas the DNA maintained rigidly. Additionally, a grid-point spacing equal to 0.375 Å as well as a grid-map with 70 Å × 70 Å × 70 Å points were provided. Finally, docking showed the greatest 25 million energy calculations; thus, 200 separate docking runs were performed by Lamarckian genetic algorithm local searching.412.8. Preparing the real samples
The commercial drug formulation specimen of cytarabine (100 mg in 5 mL) was chosen to analyze cytarabine, and an adequate amount of cytarabine was dissolved in 10 mL ultra-pure water. Moreover, the aliquot of the sample solution was transferred into a volumetric vial and diluted with ABS. Consequently, the suggested technique was utilized to determine the volume of cytarabine.Afterwards, samples of human sera were provided from chosen healthy people and were maintained at −20 °C until the assay process. Upon the transfer of a 2.5 mL volume of serum into a vial containing 22.5 mL acetate buffer solution, a specific amount of stock solution of cytarabine was poured into the vial; then, the mixture was transferred into an electro-chemical cell and set aside to interact with dsDNA/Eu3+/Cu2O CLFNs/CPE until the determined time. Upon the interaction, the dsDNA/Eu3+/Cu2O CLFNs/CPE was washed and placed in blank ABS, and the DPVs were recorded.
3. Results and discussion
3.1. Characterization of the Eu3+/Cu2O CLFNs
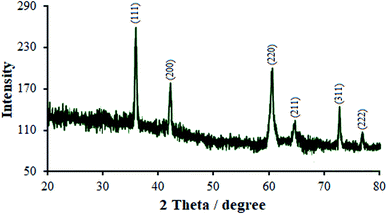
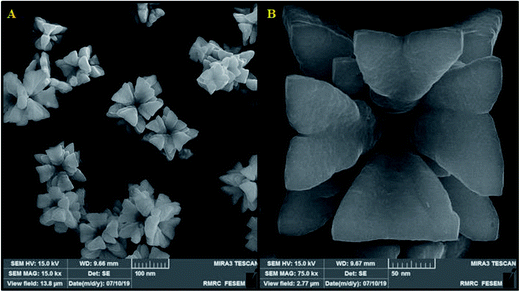
The relative intensity and the position of all diffraction peaks toward the cubic Cu2O phase can be indexed in the as-synthesized products with the XRD pattern (Fig. 1). Three specific peaks can be appointed to the (111), (200), and (220) planes, which is highly consistent with the standard PDF database (JCPDS card no. 77-0199).42 No further impurity phase was discovered, which demonstrated the purity of the Eu3+/Cu2O CLFNs which were synthesized in the recent experimental situation. The diffraction peaks of the samples are narrow and sharp, indicating an approximately suitable crystallinity, and there is no particular peak available according to the europium oxide step (Fig. 1). On the contrary, this may demonstrate the doping of Eu3+ into the Cu2O structure. Compared to pure Cu2O, the diffraction peaks showed an apparent shift to a lower angle, which implies slight doping of the europium ions into the lattice of Cu2O. This was likely induced via the ionic radius of Eu3+ (0.1087 nm); compared to the ionic radius of Cu+ (0.096 nm), it is noticeably larger, and the growth of the lattice in the Eu-doped Cu2O was rendered crystalline via the abovementioned material. This insignificant switch was foreseen for the substitution of Cu ions with Eu ions with no alterations in the crystal lattice.The morphology of the typical as-synthesized products indicated that the average diameters of the obtained Eu3+/Cu2O CLFNs are ∼80–140 nm, with a low spread in dimensions and shape and a smooth surface (Fig. 2(a)). A higher magnification FESEM image of the Eu3+/Cu2O CLFNs was obtained (Fig. 2(b)). In particular, each observed Eu3+/Cu2O nanostructure consists of four-pointed arrows (each with a length ∼80–100 nm) hinting at four directions which are orthogonal, and the nanostructures have clear, fine surfaces. This result is compatible with the FESEM observations.
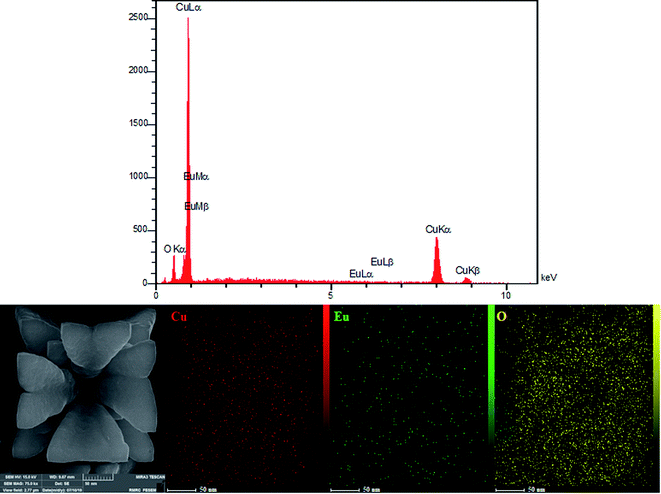
A representative EDX spectrum clearly illustrates the prominent characteristics attributed to europium, copper and oxygen, therefore displaying the satisfactory formation of the Eu3+/Cu2O CLFNs. The Eu contents of the as-obtained Eu3+-doped Cu2O nanostructures were determined from the ED spectra. Furthermore, an elemental map (EM) was obtained, which indicates homogeneous distribution of the elements on the surface (Fig. 3).
3.2. Characterizing the modified electrode
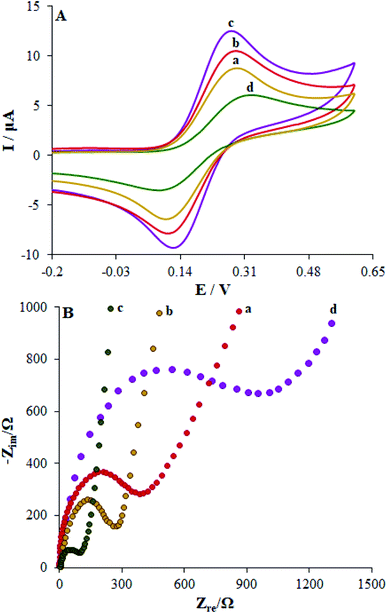
We recorded cyclic voltammograms of the Fe(CN)63−/4- redox couple as an index to immobilize DNA at the surface of bare CPE, Cu2O CLFNs/CPE, Eu3+/Cu2O CLFNs/CPE and dsDNA/Eu3+/Cu2O CLFNs/CPE to characterize the modified electrode. The redox peak current and reversibility at the Cu2O CLFNs/CPE (curve b) are augmented in comparison to those at the unmodified electrode (curve a) (Fig. 4(A)). Therefore, this condition can be triggered by the faster electron transfer and larger surface area of Cu2O CLFNs/CPE, leading to a higher current response. Moreover, the Eu3+/Cu2O CLFNs/CPE (curve c), ΔEp, diminished and the peak current was considerably enhanced compared to those of the CPEs and Cu2O CLFNs/CPE. These outputs can be attributed to the synergic impact of Cu2O and Eu3+, resulting in increased modified electrode functions such as faster electron transfer rates, higher conductivity and acceptable anti-fouling features. Upon immobilization of DNA at the surface of the Eu3+/Cu2O CLFNs/CPE, the two anodic and cathodic peak currents were remarkably reduced by enhancing the peak-to-peak potential separation (curve d). The outputs indicated resistance of phosphate groups with the negative charge of the immobilized DNA for access of the redox couple to the electrode. In addition to this electrostatic repulsion, the immobilized dsDNA may function as a physical blocker to transfer electrons. Accordingly, the current was reduced. Finally, we obtained DNA immobilization at the surface of Eu3+/Cu2O CLFNs/CPE.EIS is a flexible technique for revealing the impedance properties of electrode/solution interfaces using a redox probe, Fe(CN)63−/4−. In general, the semicircle diameter in a Nyquist plot can be illustrated via the charge transfer resistance (Rct). Nyquist plots of the impedance spectra registered on CPE in the surface layer are shown in Fig. 4(B). The electron Rct-value for the bare CPE equalled 580 Ω (curve a), which declined significantly to 310 Ω (curve b) for the Cu2O CLFNs/CPE and 135 Ω (curve c) for Eu3+/Cu2O CLFNs/CPE; this verifies the acceptable electrical conductivity of the provided film, reflecting the more robust capability of the electron transfer of the redox ions to the surface of the electrode (Fig. 4(B)). When dsDNA was immobilized on the Eu3+/Cu2O CLFNs/CPE (curve d), a gradual enhancement in the Rct-value (1552 Ω) was registered, denoting lower ability to transfer electrons at the surface of the electrode; this was caused mainly by the non-conductive behaviors of dsDNA, which create an obstacle to prevent ferro/ferricyanide ions from reaching the electrode.
3.3. Absorbing dsDNA over the Eu3+/Cu2O CLFNs/CPE
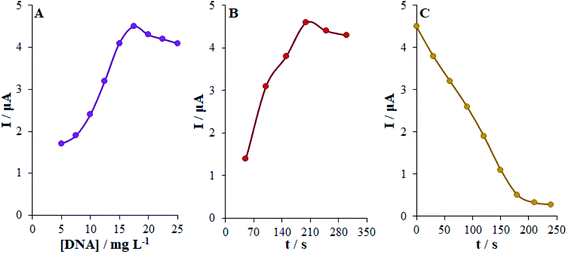
The direct adsorption method was used to immobilize dsDNA over the Eu3+/Cu2O CLFNs/CPE surface. The intensities of the guanine oxidation signals of the dsDNA/Eu3+/Cu2O CLFNs/CPE electrodes in the dsDNA concentration range between 5 and 25 mg L−1 are indicated in Fig. 5. Moreover, we observed the enhanced peak current of guanine oxidation as the dsDNA concentration was elevated to 17.5 mg L−1 and consequently leveled off (Fig. 5(A)). Hence, the optimal dsDNA concentration was chosen as 17.5 mg L−1. A significant factor to immobilize dsDNA has been proposed to be the absorption time. The intensities of the oxidation signal of guanine at the dsDNA/Eu3+/Cu2O CLFNs/CPE for 17.5 mg L−1 of dsDNA at various accumulation time points (50–300 s) was demonstrated (Fig. 5(B)). As shown, the intensity of the signal of guanine was enhanced up to 200 s of absorption time and subsequently leveled off. Hence, we chose 200 s as the optimal absorption time of dsDNA to procure dsDNA/Eu3+/Cu2O CLFNs/CPE.3.4. Electro-chemical examination of the interaction between cytarabine and dsDNA at Eu3+/Cu2O CLFNs/CPE
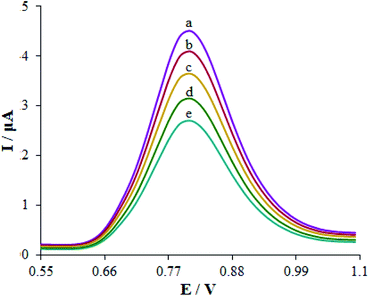
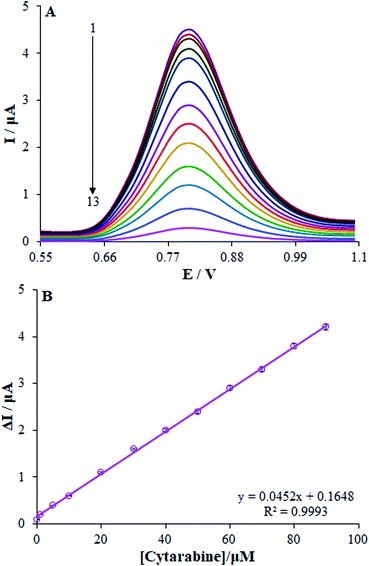
The optimized conditions for dsDNA to interact with cytarabine were determined by investigating the impact of the interaction time and cytarabine concentration. Therefore, we initially optimized the interaction time of cytarabine with dsDNA at Eu3+/Cu2O CLFNs/CPE. Upon the interaction with cytarabine, the guanine oxidation signal declined up to 210 seconds, and it nearly leveled off from 210 to 240 seconds. Therefore, we assumed 210 s to be the optimum time for cytarabine to interact with dsDNA (Fig. 5(C)).Afterwards, we assessed the effects of cytarabine concentration on DPV signals in the absence and the presence of dsDNA within the concentration range of 0–35.0 μM. The DPVs of dsDNA at the Eu3+/Cu2O CLFNs/CPE electrode for diverse concentrations of cytarabine are represented in Fig. 6. As observed, the increased concentration of cytarabine decreased the oxidation peak current for guanine; thus, the lower guanine oxidation peak current can be assigned to the binding of cytarabine to dsDNA. Therefore, we can justify this decline as probably being due to damage to the oxidizable groups of the electro-active bases of DNA, whereas cytarabine interacted with dsDNA at the surface of Eu3+/Cu2O CLFNs/CPE.43,44 In addition, negative or positive shifts in the guanine oxidation peak potential demonstrated the binding form, which can be intercalation or electro-static binding.45 There was no measurable shift in the oxidation peak potential of guanine when cytarabine was added to it. Thus, the binding mode of cytarabine to dsDNA cannot exist in intercalative binding or electro-static interactions.
The oxidation peak current of guanine showed linearity with the concentration of cytarabine within the range between 0.01 and 90 μM, with a linear equation of I (μA) = 0.0452C + 0.1639 with R2 = 0.9993 (n = 3), in which C represents the cytarabine concentration in μM (Fig. 7). Finally, the LOQ and the LOD from the calibration curve equalled 9.4 nM and 2.8 nM, respectively; consequently, the LOD and LOQ values verified the modified electrode sensitivity that was computed by eqn (2).46
| LOD = 3s/m, LOQ 10s/m | (2) |
3.5. Selectivity examinations
The effect of foreign species on the guanine signals was analyzed with DPV in the presence of 10.0 μM cytarabine to assess the selectivity of the sensor. Additionally, the maximum interfering material concentration resulting in errors under ±5% to detect guanine was described as the tolerance limit. Regarding the analyses, up to a 500-fold excess of uric acid, sucrose, citrate, ascorbic acid, epinephrine, dopamine, L-tyrosine, and folic acid had no impact on the guanine oxidation current (Fig. 8). Finally, the dsDNA/Eu3+/Cu2O CLFNs/CPE bio-sensor showed excellent cytarabine determination.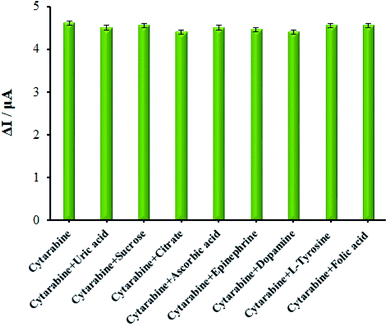 | ||
| Fig. 8 The oxidation current diagram of dsDNA/Eu3+/Cu2O CLFNs/CPE in the presence of 10.0 μM cytarabine in ABS (0.1 M, pH 4.8) and other investigated interferences. | ||
3.6. UV-visible adsorption analyses
Adsorption spectrophotometry was utilized to clarify the interactions of cytarabine with the dsDNA. Moreover, UV-visible adsorption spectra of the dsDNA–cytarabine system and dsDNA were gauged in ABS at a pH of 4.8. The results showed an adsorption peak of cytarabine at nearly 271 nm that approximated the adsorption peak of dsDNA at 260 nm (Fig. 9(A)). When dsDNA (5–40 mg L−1) was added to the fixed concentration of cytarabine (30 mg L−1), the adsorption spectrum of cytarabine at 270 nm (hyper-chromism) was enhanced, with a slight blue shift (Fig. 9(A)). According to the outputs, cytarabine interacted with the dsDNA. Additionally, the total adsorption intensity of free cytarabine and free dsDNA was lower than that of the dsDNA–cytarabine complex. Therefore, binding of small molecules to the dsDNA via intercalation led to hyperchromism and a considerable red shift (≥15 nm), whereas the outside binders showed a smaller red shift (≤8 nm).40 Regarding the groove binding molecules binding on the DNA external surface, little or no bathochromism was commonly seen.47 UV spectrum outputs of the cytarabine–DNA complex suggested that cytarabine has possible interaction with dsDNA through the groove binding. According to the modifications of the absorbance spectra of cytarabine by binding to dsDNA, it is possible to determine the binding constant (K) with the following equation:| A0/(A − A0) = εC/(εH–C − εC) + 1/K[DNA] | (3) |
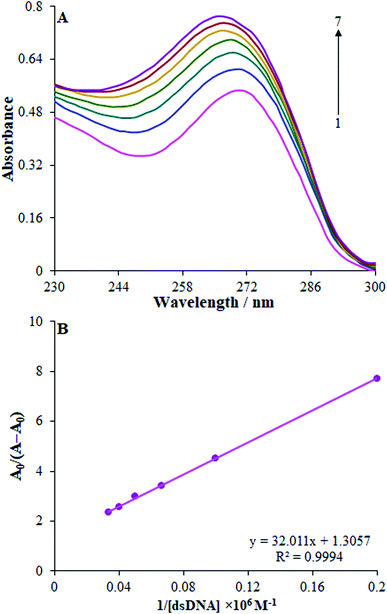 | ||
| Fig. 9 UV-vis absorption spectra of cytarabine (20.0 μM) in the absence and presence of dsDNA in the range of 5.0–30.0 μM. Inset: A0/A − A0 vs. 1/[dsDNA] plot. | ||
3.7. Viscosity examinations
One helpful technique to determine the binding mode between small molecules and DNA is proposed to be viscosity measurements, which have sensitivity to the changes in the length of the double-helix. Thus, this is a prominent experiment of the classical intercalative binding mode. Classical intercalative binding of small molecules usually results in increased viscosity of the DNA solution. Reversely, non-intercalation binding, such as electro-static or groove binding, can partly influence DNA viscosity because it does not make changes in the axial length of the dsDNA during binding.49 Relative viscosity of dsDNA exhibited minor changes, showing that the binding mode of cytarabine with dsDNA is not an intercalative interaction (Fig. 10). The above behavior reflects that non-intercalative and probably groove binding are involved in the interaction mode of cytarabine with dsDNA.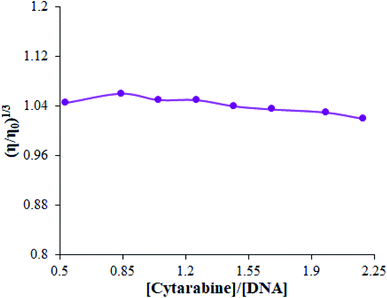 | ||
| Fig. 10 Effect of increasing the amount of cytarabine on the relative viscosity of dsDNA in ABS (pH 4.8). | ||
3.8. Docking
Docking was performed to examining the optimal interaction site and the most acceptable compound conformation on DNA with minimum energy.50 The lowest binding energy and Ki for the interaction between DNA and cytarabine respectively equalled −5.28 kcal mol−1 and 134.57 μM. Analyses showed stability of cytarabine at the DNA minor groove through four hydrogen bonds with hydrophobic and nucleotide interactions (Fig. 11). In addition, it was found that hydrogen bonds significantly contribute to the DNA and cytarabine interactions. Notably, the hydrogen bonds entailed hydrogen (H)3 of adenine 17 (DA17), which has interactions with nitrogen (N)7 of cytarabine. After that, H29 of cytarabine interacts with O4′ from adenine 17 (DA17) and H24 of cytarabine interacts with O3′ from adenine 18 (DA18). Furthermore, H25 of cytarabine showed a hydrogen bond with O3′ from cytosine 9 (DC9). Based on the docking outputs, cytarabine may have interactions with the bases in the DNA minor groove.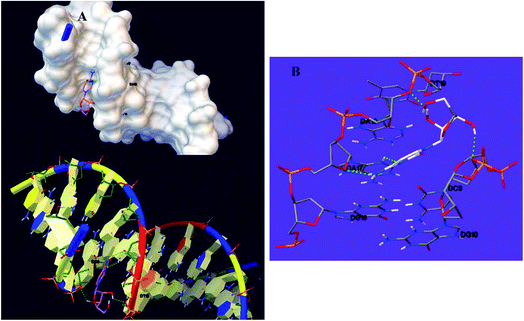 | ||
| Fig. 11 (A) Cytarabine–DNA minor groove interaction. (B) Geometrical disposition of cytarabine in the DNA minor groove. | ||
3.9. Analyzing real samples
The dsDNA/Eu3+/Cu2O CLFNs/CPE was utilized to analyze cytarabine in commercial formulations and human blood serum to investigate the precision of this new technique. In the next step, a specific volume of cytarabine was poured into the samples, and its content was measured using dsDNA/Eu3+/Cu2O CLFNs/CPE with the standard addition method. The recovery value in human blood serum ranged from 98.6% to 102.0% (Table 1). We employed a standard addition method for determining the cytarabine concentration for analyzing biological samples spiked into the test samples (Table 1). The outputs demonstrated the ability of this new electrochemical biosensor based on dsDNA/Eu3+/Cu2O CLFNs/CPE to detect cytarabine in injectable solutions and human blood serum.4. Conclusion
This electrochemical DNA biosensor showed sensitivity, selectivity, and speed to determine cytarabine at a lower concentration. The oxidation signals of adenine and guanine declined based on the interaction between cytarabine and dsDNA. Moreover, the dsDNA/Eu3+/Cu2O CLFNs/CP electrode can be utilized to explore the interaction between cytarabine and dsDNA and detect cytarabine concentration. Electro-chemical, viscosimetric, spectroscopic and docking techniques were used to examine the interaction mechanism between the dsDNA and cytarabine. The cytarabine–dsDNA interactions result in condensation of the DNA double-helix. In addition, DPV, UV-vis spectroscopy, viscosimetric and docking results confirmed a groove binding mechanism of cytarabine molecules with dsDNA. Hence, this sensor may offer worthwhile insight into the drug action mechanism with a fast response time and lower sample volumes (approximately 200 μL). Furthermore, it was substantially utilized to determine cytarabine contents in real samples. Therefore, because this sensor represents an inexpensive and facile recognition platform, it may be extended to pharmacogenomics investigations. Supervision of novel treatment compounds interacting with dsDNA determines sequence-specific DNA hybridization events to develop miniaturized DNA chip/array technologies.Conflicts of interest
The authors declare that they have no known competing financial interests or personal relationships that could have appeared to influence the work reported in this paper.Acknowledgements
The financial supports of Research Councils of Islamic Azad University of Kerman are gratefully acknowledged. M. M. Foroughi acknowledges financial support from the Islamic Azad University of Kerman for “Fabrication of electrochemical nanosensor based on modified electrode with metal oxide nanoparticles for determination of AIDS, anesthetic drugs and anticancer drugs”.References
- C. Sivodia and A. Sinha, Assessment of graphite electrode on the removal of anticancer drug cytarabine via indirect electrochemical oxidation process: kinetics & pathway study, Chemosphere, 2020, 243, 125456 CrossRef CAS PubMed.
- J. Zhang, V. W. Chang, A. Giannis and J. Y. Wang, Removal of cytostatic drugs from aquatic environment: a review, Sci. Total Environ., 2013, 445, 281–298 CrossRef PubMed.
- N. Negreira, M. L. de Alda and D. Barcelo, Cytostatic drugs and metabolites in municipal and hospital wastewaters in Spain: filtration, occurrence, and environmental risk, Sci. Total Environ., 2014, 497, 68–77 CrossRef PubMed.
- T. Haddad, E. Baginska and K. Kümmerer, Transformation products of antibiotic and cytostatic drugs in the aquatic cycle that result from effluent treatment and abiotic/biotic reactions in the environment: an increasing challenge calling for higher emphasis on measures at the beginning of the pipe, Water Res., 2015, 72, 75–126 CrossRef CAS PubMed.
- J. P. Besse, J. F. Latour and J. Garric, Anticancer drugs in surface waters: what can we say about the occurrence and environmental significance of cytotoxic, cytostatic and endocrine therapy drugs?, Environ. Int., 2012, 39, 73–86 CrossRef CAS PubMed.
- I. C. Lopes, S. C. Oliveira and A. Oliveira-Brett, In situ electrochemical evaluation of anticancer drug temozolomide and its metabolites–DNA interaction, Anal. Bioanal. Chem., 2013, 405, 3783–3790 CrossRef CAS PubMed.
- A. Singh, G. Sinsinbar, M. Choudhary, V. Kumar, R. Pasricha, H. N. Verma, S. P. Singh and K. Arora, Graphene oxide-chitosan nanocomposite based electrochemical DNA biosensor for detection of typhoid, Sens. Actuators, B, 2013, 185, 675–684 CrossRef CAS.
- G. A. Tig, B. Zeybek and S. Pekyardimci, Electrochemical DNA biosensor based on poly(2,6-pyridinedicarboxylic acid) modified glassy carbon electrode for the determination of anticancer drug gemcitabine, Talanta, 2016, 154, 312–321 CrossRef CAS PubMed.
- K. Saeedfar, L. Y. Heng and C. P. Chiang, A DNA biosensor based on gold nanoparticle decorated on carboxylated multi-walled carbon nanotubes for gender determination of Arowana fish, Bioelectrochemistry, 2017, 118, 106–113 CrossRef CAS PubMed.
- Q. Zhang, Y. Wu, Q. Xu, F. Ma and C. Y. Zhang, Recent advances in biosensors for in vitro detection and in vivo imaging of DNA methylation, Biosens. Bioelectron., 2021, 171, 112712 CrossRef CAS PubMed.
- A. Hájková, J. Barek and V. Vyskočil, Electrochemical DNA biosensor for detection of DNA damage induced by hydroxyl radicals, Bioelectrochemistry, 2017, 116, 1–9 CrossRef PubMed.
- S. R. Yan, M. M. Foroughi, M. Safaei, Sh. Jahani, N. Ebrahimpour, F. Borhani, N. Rezaei Zade Baravati, Z. Aramesh-Boroujeni and L. K. Foog, A review: recent advances in ultrasensitive and highly specific recognition aptasensors with various detection strategies, RSC Adv., 2020, 155, 184–207 CAS.
- M. M. Foroughi, Sh. Jahani and M. Rajaei, Facile Fabrication of 3D Dandelion-Like Cobalt Oxide Nanoflowers and Its Functionalization in the First Electrochemical Sensing of Oxymorphone: Evaluation of Kinetic Parameters at the Surface Electrode, J. Electrochem. Soc., 2019, 166, B1300–B1311 CrossRef CAS.
- K. M. AlAqad, R. Suleiman, O. C. S. Al Hamouz and T. A. Saleh, Novel graphene modified carbon-paste electrode for promazine detection by square wave voltammetry, J. Mol. Liq., 2018, 252, 75 CrossRef CAS.
- M. Vakili Fathabadi, H. Hashemipour Rafsanjani, M. M. Foroughi, Sh. Jahani and N. Arefi Nia, Synthesis of Magnetic Ordered Mesoporous Carbons (OMC) as an Electrochemical Platform for Ultrasensitive and Simultaneous Detection of Thebaine and Papaverine, J. Electrochem. Soc., 2020, 167, 027509 CrossRef.
- N. Sheibani, M. Kazemipour, Sh. Jahani and M. M. Foroughi, A novel highly sensitive thebaine sensor based on MWCNT and dandelionlike Co3O4 nanoflowers fabricated via solvothermal synthesis, Microchem. J., 2019, 149, 103980 CrossRef CAS.
- T. Tavana, M. A. Khalilzadeh, H. Karimi-Maleh, A. A. Ensafi, H. Beitollahi and D. Zareyee, Sensitive voltammetric determination of epinephrine in the presence of acetaminophen at a novel ionic liquid modified carbon nanotubes paste electrode, J. Mol. Liq., 2012, 168, 69 CrossRef CAS.
- Y. Song, M. Xu, Z. Li, L. He, M. Hu, L. He, Z. Zhang and M. Du, Ultrasensitive detection of bisphenol A under diverse environments with an electrochemical aptasensor based on multicomponent AgMo heteronanostructure, Sens. Actuators, B, 2020, 321, 128527 CrossRef CAS.
- N. Arefi Nia, M. M. Foroughi and Sh. Jahani, Simultaneous determination of theobromine, theophylline, and caffeine using a modified electrode with petal-like MnO2 nanostructure, Talanta, 2020, 222, 121563 Search PubMed.
- M. Wang, M. Hu, B. Hu, C. Guo, Y. Song, Q. Jia, L. He, Z. Zhang and S. Fang, Bimetallic cerium and ferric oxides nanoparticles embedded within mesoporous carbon matrix: Electrochemical immunosensor for sensitive detection of carbohydrate antigen 19-9, Biosens. Bioelectron., 2019, 135, 22–29 CrossRef CAS PubMed.
- H. Mirzaei, A. A. Nasiri, R. Mohamadee, H. Yaghoobi, M. Khatami, O. Azizi, M. A. Zaimy and H. Azizi, Direct growth of ternary copper nickel cobalt oxide nanowires as binder-free electrode on carbon cloth for nonenzymatic glucose sensing, Microchem. J., 2018, 142, 343–351 CrossRef CAS.
- H. Zhang, M. Sun, L. Song, J. Guo and L. Zhang, Fate of NaClO and membrane foulants during in situ cleaning of membrane bioreactors: Combined effect on thermodynamic properties of sludge, Biochem. Eng. J., 2019, 147, 146–152 CrossRef CAS.
- N. Jandaghi, Sh. Jahani, M. M. Foroughi, M. Kazemipour and M. Ansari, Cerium-doped flower-shaped ZnO nano-crystallites as a sensing component for simultaneous electrochemical determination of epirubicin and methotrexate, Microchim. Acta, 2020, 187, 24–35 CrossRef CAS PubMed.
- M. Wang, L. Yang, B. Hu, J. Liu, L. He, Q. Jia, Y. Song and Z. Zhang, Bimetallic NiFe oxide structures derived from hollow NiFe Prussian blue nanobox for label-free electrochemical biosensing adenosine triphosphate, Biosens. Bioelectron., 2018, 113, 16–24 CrossRef CAS PubMed.
- S. Akhtartavan, M. Karimi, K. Karimian, N. Azarpira, M. Khatami and H. Heli, Evaluation of a self-nanoemulsifying docetaxel delivery system, Biomed. Pharmacother., 2019, 109, 2427–2433 CrossRef CAS PubMed.
- W. H. Huang, G. Q. Wang, W. H. Li, T. T. Li, G. J. Ji, S. C. Ren, M. Jiang, L. Yan, H. T. Tang, Y. M. Pan and Y. J. Ding, Porous Ligand Creates New Reaction Route: Bifunctional Single-Atom Palladium Catalyst for Selective Distannylation of Terminal Alkynes, Chem, 2020, 6, 2300–2313 CAS.
- H. Karimi-Maleh, F. Tahernejad-Javazmi, V. K. Gupta, H. Ahmar and M. H. Asadi, A novel biosensor for liquid phase determination of glutathione and amoxicillin in biological and pharmaceutical samples using a ZnO/CNTs nanocomposite/catechol derivative modified electrode, J. Mol. Liq., 2014, 196, 258 CrossRef CAS.
- L. Xu, S. Jiang, J. Wu and Q. Zou, An in silico approach to identification, categorization and prediction of nucleic acid binding proteins, Briefings Bioinf., 2020, bbaa171, DOI:10.1093/bib/bbaa171.
- A. Miri, M. Khatami and M. Sarani, Biosynthesis, magnetic and cytotoxic studies of hematite nanoparticles, J. Inorg. Organomet. Polym., 2020, 30, 767–774 CrossRef CAS.
- Q. Zhu, L. Liu, R. Wang and X. Zhou, A split aptamer (SPA)-based sandwich-type biosensor for facile and rapid detection of streptomycin, J. Hazard. Mater., 2021, 403, 123941 CrossRef CAS PubMed.
- N. Arefi Nia, M. M. Foroughi, Sh. Jahani, M. Shahidi Zandi and N. Rastakhiz, Fabrication of a New Electrochemical Sensor for Simultaneous Determination of Codeine and Diclofenac Using Synergic Effect of Feather-Type La3+-ZnO Nano-Flower, J. Electrochem. Soc., 2019, 166, B489–B497 CrossRef.
- Q. Zou Sr, P. Xing, L. Wei and B. Liu, Gene2vec: gene subsequence embedding for prediction of mammalian N-6-methyladenosine sites from mRNA, RNA, 2019, 25, 205–218 CrossRef PubMed.
- Q. Jiang, S. Jin, Y. Jiang, M. Liao, R. Feng, L. Zhang, G. Liu and J. Hao, Alzheimer's Disease Variants with the Genome-Wide Significance are Significantly Enriched in Immune Pathways and Active in Immune Cells, Mol. Neurobiol., 2017, 54, 594–600 CrossRef CAS PubMed.
- Z. Fathi, Sh. Jahani, M. Shahidi Zandi and M. M. Foroughi, Synthesis of bifunctional cabbage flower–like Ho3+/NiO nanostructures as a modifier for simultaneous determination of methotrexate and carbamazepine, Anal. Bioanal. Chem., 2020, 412, 1011–1024 CrossRef CAS PubMed.
- U. Jain, S. Gupta and N. Chauhan, Construction of an amperometric glycated hemoglobin biosensor based on Au–Pt bimetallic nanoparticles and poly(indole-5-carboxylic acid) modified Au electrode, Int. J. Biol. Macromol., 2017, 105, 549–555 CrossRef CAS PubMed.
- T. Aditya, J. Jana, N. K. Singh, A. Pal and T. Pal, Remarkable facet selective reduction of 4-nitrophenol by morphologically tailored (111) faceted Cu2O nanocatalyst, ACS Omega, 2017, 2, 1968–1984 CrossRef CAS PubMed.
- Y. Wang, N. Yu and Y. Wu, Cu2O/GaN ultraviolet detector synthesized using ZnO nanorod arrays as template by aqueous method, Nano-Struct. Nano-Objects, 2020, 23, 100494 CrossRef CAS.
- M. Zhou, Z. Guo and Z. Liu, FeOOH as hole transfer layer to retard the photocorrosion of Cu2O for enhanced photoelctrochemical performance, Appl. Catal., B, 2020, 260, 118213 CrossRef CAS.
- T. Terasako, R. Kitamoto and H. Okada, Fe-assisted chemical bath deposition of highly oriented Cu2O films and formation of ZnO nanorods/Cu2O heterojunctions, Mater. Today, 2019, 7, 784–791 CAS.
- S. Asadpour, Z. Aramesh-Boroujeni and Sh. Jahani, In vitro anticancer activity of parent and nano-encapsulated samarium(III) complex towards antimicrobial activity studies and FS-DNA/BSA binding affinity, RSC Adv., 2020, 10, 31979–31990 RSC.
- G. M. Morris, D. S. Goodsell, R. S. Halliday, R. Huey, W. E. Hart, R. K. Belew and A. J. Olson, Automated docking using a Lamarckian genetic algorithm and an empirical binding free energy function, J. Comput. Chem., 1998, 19, 1639–1662 CrossRef CAS.
- R. Khan, R. Ahmad, P. Rai, L. W. Jang, J. H. Yun, Y. T. Yu, Y. B. Hahn and I. H. Lee, Glucose-assisted synthesis of Cu2O shuriken-like nanostructures and their application as nonenzymatic glucose biosensors, Sens. Actuators, B, 2014, 203, 471–476 CrossRef CAS.
- A. Erdem, B. Kosmider, R. Osiecka, E. Zyner, J. Ochocki and M. Ozsoz, Electrochemical genosensing of the interaction between the potential chemotherapeutic agent, cis-bis(3-aminoflavone)dichloroplatinum(II) and DNA in comparison with cis-DDP, J. Pharm. Biomed. Anal., 2005, 38, 645–652 CrossRef CAS PubMed.
- B. Dogan-Topal, B. Uslu and S. A. Ozkan, Voltammetric studies on the HIV-1 inhibitory drug Efavirenz: The interaction between dsDNA and drug using electrochemical DNA biosensor and adsorptive stripping voltammetric determination on disposable pencil graphite electrode, Biosens. Bioelectron., 2009, 24, 2358–2364 CrossRef CAS PubMed.
- M. T. Carter, M. Rodriguez and A. J. Bard, Voltammetric studies of the interaction of metal chelates with DNA. 2. Tris-chelated complexes of cobalt(III) and iron(II) with 1,10-phenanthroline and 2,2'-bipyridine, J. Am. Chem. Soc., 1989, 111, 8901–8911 CrossRef CAS.
- A. A. Ensafi, B. Rezaei, M. Amini and E. Heydari-Bafrooei, A novel sensitive DNA–biosensor for detection of a carcinogen, Sudan II, using electrochemically treated pencil graphite electrode by voltammetric methods, Talanta, 2012, 88, 244–251 CrossRef CAS PubMed.
- S. U. Rehman, T. Sarwar, M. A. Husain, H. M. Ishqi and M. Tabish, Studying non-covalent drug–DNA interactions, Arch. Biochem. Biophys., 2015, 576, 49–60 CrossRef PubMed.
- S. S. Kalanur, U. Katrahalli and J. Seetharamappa, Electrochemical studies and spectroscopic investigations on the interaction of an anticancer drug with DNA and their analytical applications, J. Electroanal. Chem., 2009, 636, 93–100 CrossRef CAS.
- D. Yinhua, M. M. Foroughi, Z. Aramesh-Boroujeni, S. Jahani, M. Peydayesh, F. Borhani, M. Khatami, M. Rohani, M. Dusek and V. Eigner, The synthesis, characterization, DNA/BSA/HSA interactions, molecular modeling, antibacterial properties, and in vitro cytotoxic activities of novel parent and niosome nano-encapsulated Ho(III) complexes, RSC Adv., 2020, 10, 22891–22908 RSC.
- Z. Aramesh-Boroujeni, S. Jahani, M. Khorasani-Motlagh, K. Kerman and M. Noroozifar, Evaluation of parent and nano-encapsulated terbium(III) complex toward its photoluminescence properties, FS-DNA, BSA binding affinity, and biological applications, J. Trace Elem. Med. Biol., 2020, 61, 126564 CrossRef CAS PubMed.
| This journal is © The Royal Society of Chemistry 2021 |

